echarts
ECharts 是一个使用 JavaScript 实现的开源可视化库,主要用于数据的可视化展示。ECharts 支持丰富的图表类型,如折线图、柱状图、饼图、地图、K线图等,可以满足不同类型数据的展示需求。
文档地址:echarts
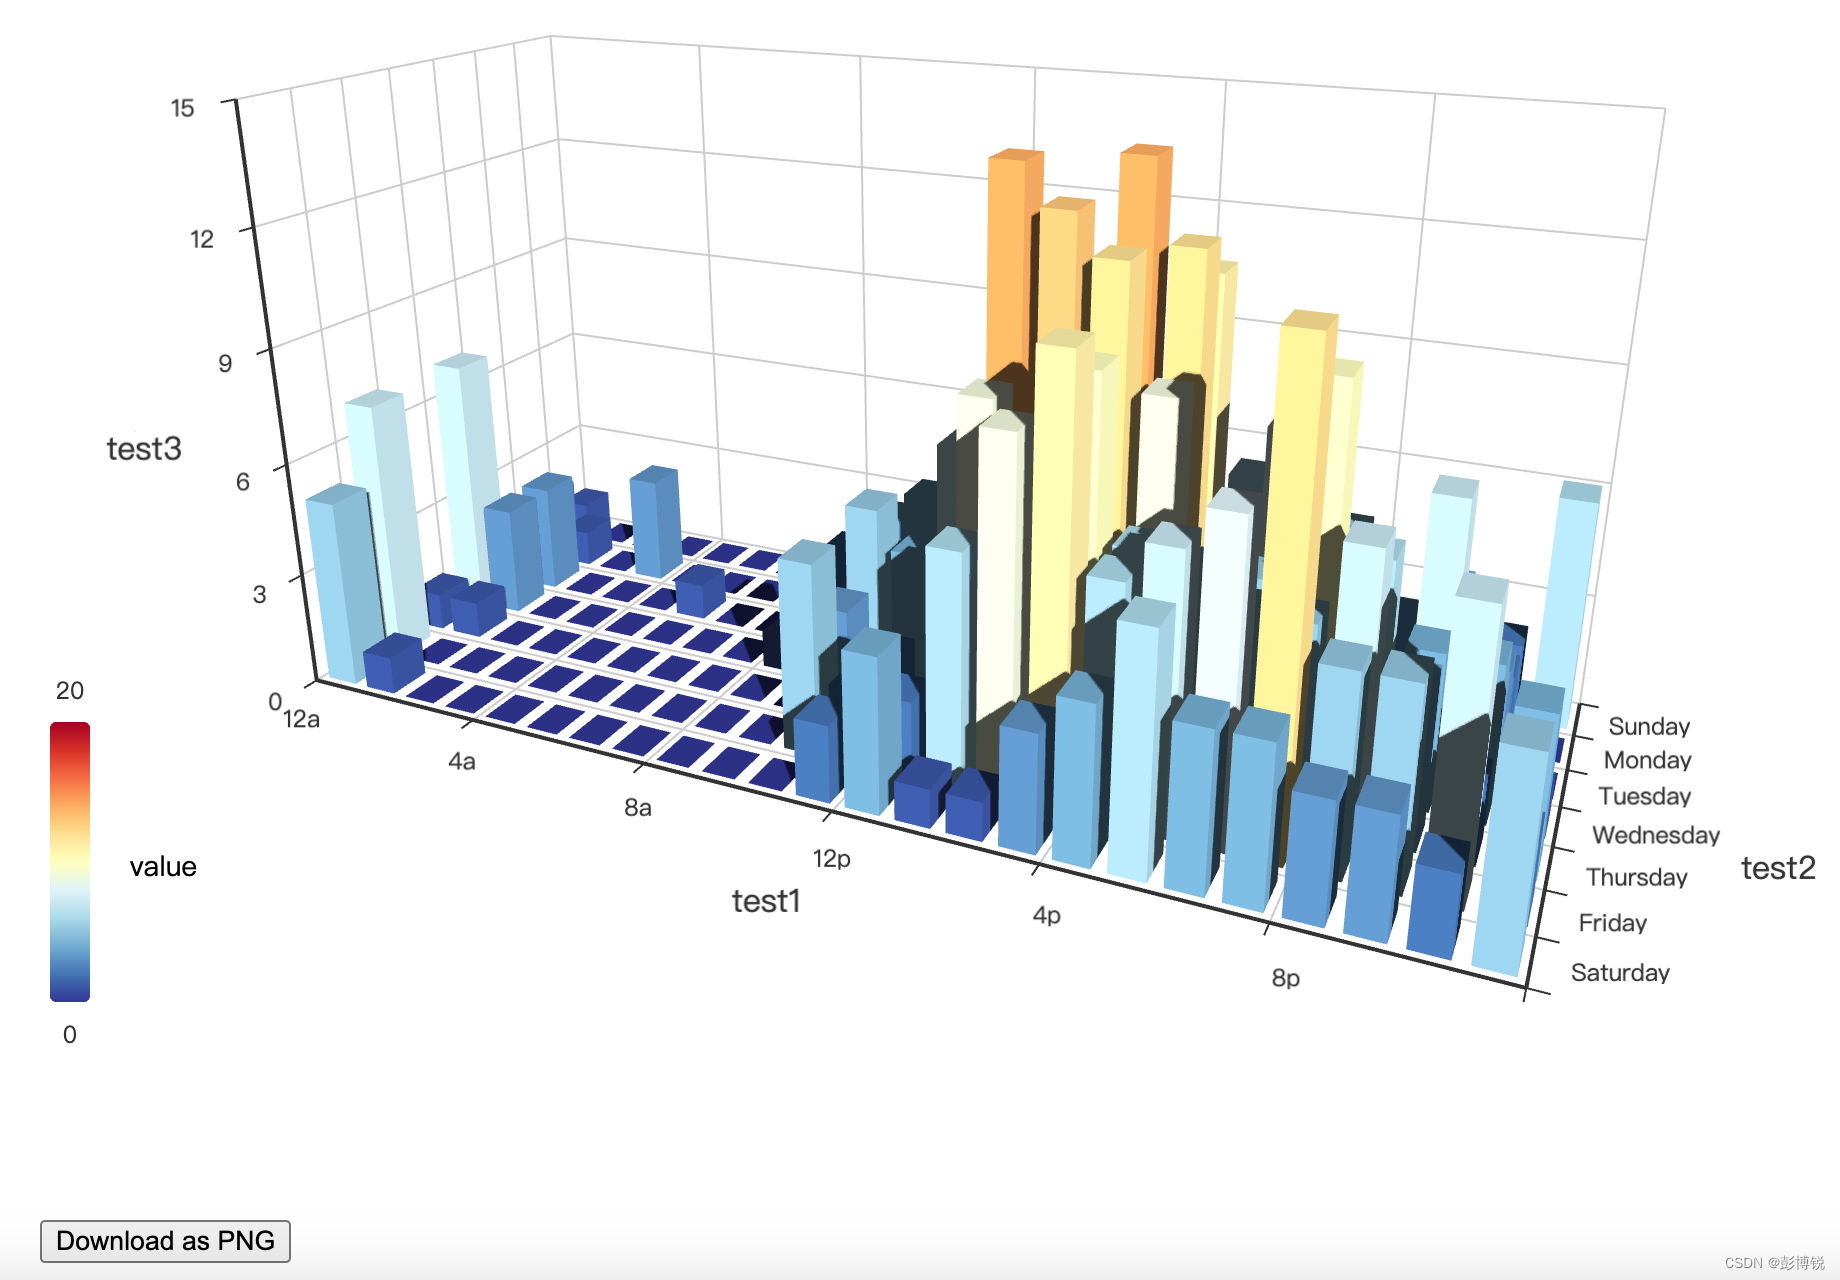
本次所绘制三维柱状图主要使用的是示例源代码,在此基础上做了些修改。
引入CDN
使用echarts需要导入echarts和echarts-gl。
免费的CDN服务可访问网址:Staticfile CDN
html
<!-- 引入 ECharts 文件 -->
<script src="https://cdn.jsdelivr.net/npm/echarts@latest/dist/echarts.min.js"></script>
<script src="https://cdn.staticfile.net/echarts-gl/2.0.8/echarts-gl.js"></script>
HTML结构
设置一个container容器存放三维柱状图,设置一个下载png图片按钮。根据id选择器设置样式。
html
<!DOCTYPE html>
<html lang="">
<head>
    <meta charset="utf-8">
    <title>ECharts</title>
    <!-- 引入 ECharts 文件 -->
    <script src="https://cdn.jsdelivr.net/npm/echarts@latest/dist/echarts.min.js"></script>
    <script src="https://cdn.staticfile.net/echarts-gl/2.0.8/echarts-gl.js"></script>
    <style>
        #container {
            width: 900px;
            height: 800px;
            margin-left: 300px;
            margin-top: -120px;
        }
        #download{
            margin-left: 300px;
        }
    </style>
</head>
<body>
<!-- 准备一个 DOM 容器 -->
<div id="container"></div>
<button id="download">Download as PNG</button>
<script type="text/javascript"...>
</body>
</html>
echarts属性设置
visualMap组件可以根据Z轴值的大小映射出不同的颜色。graphic组件可以添加文字说明。
javascript
const dom = document.getElementById('container');
    const myChart = echarts.init(dom, null, {
        renderer: 'canvas',
        useDirtyRect: false
    });

    let option;

    // prettier-ignore
    const hours = ['12a', '1a', '2a', '3a', '4a', '5a', '6a',
        '7a', '8a', '9a', '10a', '11a',
        '12p', '1p', '2p', '3p', '4p', '5p',
        '6p', '7p', '8p', '9p', '10p', '11p'];
    // prettier-ignore
    const days = ['Saturday', 'Friday', 'Thursday',
        'Wednesday', 'Tuesday', 'Monday', 'Sunday'];
    // prettier-ignore
    const data = [[0, 0, 5], [0, 1, 1], [0, 2, 0], [0, 3, 0], [0, 4, 0], [0, 5, 0], [0, 6, 0], [0, 7, 0], [0, 8, 0], [0, 9, 0], [0, 10, 0], [0, 11, 2], [0, 12, 4], [0, 13, 1], [0, 14, 1], [0, 15, 3], [0, 16, 4], [0, 17, 6], [0, 18, 4], [0, 19, 4], [0, 20, 3], [0, 21, 3], [0, 22, 2], [0, 23, 5], [1, 0, 7], [1, 1, 0], [1, 2, 0], [1, 3, 0], [1, 4, 0], [1, 5, 0], [1, 6, 0], [1, 7, 0], [1, 8, 0], [1, 9, 0], [1, 10, 5], [1, 11, 2], [1, 12, 2], [1, 13, 6], [1, 14, 9], [1, 15, 11], [1, 16, 6], [1, 17, 7], [1, 18, 8], [1, 19, 12], [1, 20, 5], [1, 21, 5], [1, 22, 7], [1, 23, 2], [2, 0, 1], [2, 1, 1], [2, 2, 0], [2, 3, 0], [2, 4, 0], [2, 5, 0], [2, 6, 0], [2, 7, 0], [2, 8, 0], [2, 9, 0], [2, 10, 3], [2, 11, 2], [2, 12, 1], [2, 13, 9], [2, 14, 8], [2, 15, 10], [2, 16, 6], [2, 17, 5], [2, 18, 5], [2, 19, 5], [2, 20, 7], [2, 21, 4], [2, 22, 2], [2, 23, 4], [3, 0, 7], [3, 1, 3], [3, 2, 0], [3, 3, 0], [3, 4, 0], [3, 5, 0], [3, 6, 0], [3, 7, 0], [3, 8, 1], [3, 9, 0], [3, 10, 5], [3, 11, 4], [3, 12, 7], [3, 13, 14], [3, 14, 13], [3, 15, 12], [3, 16, 9], [3, 17, 5], [3, 18, 5], [3, 19, 10], [3, 20, 6], [3, 21, 4], [3, 22, 4], [3, 23, 1], [4, 0, 1], [4, 1, 3], [4, 2, 0], [4, 3, 0], [4, 4, 0], [4, 5, 1], [4, 6, 0], [4, 7, 0], [4, 8, 0], [4, 9, 2], [4, 10, 4], [4, 11, 4], [4, 12, 2], [4, 13, 4], [4, 14, 4], [4, 15, 14], [4, 16, 12], [4, 17, 1], [4, 18, 8], [4, 19, 5], [4, 20, 3], [4, 21, 7], [4, 22, 3], [4, 23, 0], [5, 0, 2], [5, 1, 1], [5, 2, 0], [5, 3, 3], [5, 4, 0], [5, 5, 0], [5, 6, 0], [5, 7, 0], [5, 8, 2], [5, 9, 0], [5, 10, 4], [5, 11, 1], [5, 12, 5], [5, 13, 10], [5, 14, 5], [5, 15, 7], [5, 16, 11], [5, 17, 6], [5, 18, 0], [5, 19, 5], [5, 20, 3], [5, 21, 4], [5, 22, 2], [5, 23, 0], [6, 0, 1], [6, 1, 0], [6, 2, 0], [6, 3, 0], [6, 4, 0], [6, 5, 0], [6, 6, 0], [6, 7, 0], [6, 8, 0], [6, 9, 0], [6, 10, 1], [6, 11, 0], [6, 12, 2], [6, 13, 1], [6, 14, 3], [6, 15, 4], [6, 16, 0], [6, 17, 0], [6, 18, 0], [6, 19, 0], [6, 20, 1], [6, 21, 2], [6, 22, 2], [6, 23, 6]];
    option = {
        tooltip: {},
        // visualMap组件根据Z轴值的大小映射不同的颜色
        visualMap: {
            min: 0,
            max: 20,
            text: ['20', '0'],
            bottom: '10%',
            inRange: {
                color: [
                    '#313695',
                    '#4575b4',
                    '#74add1',
                    '#abd9e9',
                    '#e0f3f8',
                    '#ffffbf',
                    '#fee090',
                    '#fdae61',
                    '#f46d43',
                    '#d73027',
                    '#a50026'
                ]
            }
        },
        // graphic组件添加说明文本
        graphic: [
            {
                type: 'text',
                left: '5%',
                bottom: '21%',
                style: {
                    text: 'value',
                    fill: '#000',
                    font: '14px Microsoft YaHei'
                }
            }
        ],
        xAxis3D: {
            type: 'category',
            data: hours,
            name: 'test1'
        },
        yAxis3D: {
            type: 'category',
            data: days,
            name: 'test2',
            nameGap: 25,      // 设置Y轴名称与轴线之间的距离,单位是像素
            axisLabel: {
                // 设置标注与轴线之间的间距
                margin: 5  // 这里的20可以根据需要调整为其他值
            }
        },
        zAxis3D: {
            type: 'value',
            name: 'test3'
        },
        grid3D: {
            boxWidth: 200,
            boxDepth: 80,
            viewControl: {
                // projection: 'orthographic'
            },
            light: {
                main: {
                    intensity: 1.2,
                    shadow: true
                },
                ambient: {
                    intensity: 0.3
                }
            }
        },
        series: [
            {
                type: 'bar3D',
                data: data.map(function (item) {
                    return {
                        value: [item[1], item[0], item[2]]
                    };
                }),
                shading: 'lambert',
                label: {
                    fontSize: 16,
                    borderWidth: 1
                },
                emphasis: {
                    label: {
                        fontSize: 20,
                        color: '#900'
                    },
                    itemStyle: {
                        color: '#900'
                    }
                }
            }
        ]
    };
if (option && typeof option === 'object') {
        myChart.setOption(option);
    }

    window.addEventListener('resize', myChart.resize);
添加下载事件
通过添加下载事件可以将HTML中的图片转换成png格式。
javascript
// 添加下载事件
document.getElementById('download').addEventListener('click', function() {
    // 使用echarts的getDataURL方法获取图表的Base64编码
    const url = myChart.getDataURL({
        type: 'png',
        pixelRatio: 2, // 设置图像的分辨率
        backgroundColor: '#fff' // 设置背景色(可选)
    });

    // 创建一个下载链接
    const a = document.createElement('a');
    a.href = url;
    a.download = 'chart.png';
    document.body.appendChild(a);
    a.click();
    document.body.removeChild(a);
});
完整代码
html
<!DOCTYPE html>
<html lang="">
<head>
    <meta charset="utf-8">
    <title>ECharts</title>
    <!-- 引入 ECharts 文件 -->
    <script src="https://cdn.jsdelivr.net/npm/echarts@latest/dist/echarts.min.js"></script>
    <script src="https://cdn.staticfile.net/echarts-gl/2.0.8/echarts-gl.js"></script>
    <style>
        #container {
            width: 900px;
            height: 800px;
            margin-left: 300px;
            margin-top: -120px;
        }
        #download{
            margin-left: 300px;
        }
    </style>
</head>
<body>
<!-- 准备一个 DOM 容器 -->
<div id="container"></div>
<button id="download">Download as PNG</button>
<script type="text/javascript">
    const dom = document.getElementById('container');
    const myChart = echarts.init(dom, null, {
        renderer: 'canvas',
        useDirtyRect: false
    });

    let option;

    // prettier-ignore
    const hours = ['12a', '1a', '2a', '3a', '4a', '5a', '6a',
        '7a', '8a', '9a', '10a', '11a',
        '12p', '1p', '2p', '3p', '4p', '5p',
        '6p', '7p', '8p', '9p', '10p', '11p'];
    // prettier-ignore
    const days = ['Saturday', 'Friday', 'Thursday',
        'Wednesday', 'Tuesday', 'Monday', 'Sunday'];
    // prettier-ignore
    const data = [[0, 0, 5], [0, 1, 1], [0, 2, 0], [0, 3, 0], [0, 4, 0], [0, 5, 0], [0, 6, 0], [0, 7, 0], [0, 8, 0], [0, 9, 0], [0, 10, 0], [0, 11, 2], [0, 12, 4], [0, 13, 1], [0, 14, 1], [0, 15, 3], [0, 16, 4], [0, 17, 6], [0, 18, 4], [0, 19, 4], [0, 20, 3], [0, 21, 3], [0, 22, 2], [0, 23, 5], [1, 0, 7], [1, 1, 0], [1, 2, 0], [1, 3, 0], [1, 4, 0], [1, 5, 0], [1, 6, 0], [1, 7, 0], [1, 8, 0], [1, 9, 0], [1, 10, 5], [1, 11, 2], [1, 12, 2], [1, 13, 6], [1, 14, 9], [1, 15, 11], [1, 16, 6], [1, 17, 7], [1, 18, 8], [1, 19, 12], [1, 20, 5], [1, 21, 5], [1, 22, 7], [1, 23, 2], [2, 0, 1], [2, 1, 1], [2, 2, 0], [2, 3, 0], [2, 4, 0], [2, 5, 0], [2, 6, 0], [2, 7, 0], [2, 8, 0], [2, 9, 0], [2, 10, 3], [2, 11, 2], [2, 12, 1], [2, 13, 9], [2, 14, 8], [2, 15, 10], [2, 16, 6], [2, 17, 5], [2, 18, 5], [2, 19, 5], [2, 20, 7], [2, 21, 4], [2, 22, 2], [2, 23, 4], [3, 0, 7], [3, 1, 3], [3, 2, 0], [3, 3, 0], [3, 4, 0], [3, 5, 0], [3, 6, 0], [3, 7, 0], [3, 8, 1], [3, 9, 0], [3, 10, 5], [3, 11, 4], [3, 12, 7], [3, 13, 14], [3, 14, 13], [3, 15, 12], [3, 16, 9], [3, 17, 5], [3, 18, 5], [3, 19, 10], [3, 20, 6], [3, 21, 4], [3, 22, 4], [3, 23, 1], [4, 0, 1], [4, 1, 3], [4, 2, 0], [4, 3, 0], [4, 4, 0], [4, 5, 1], [4, 6, 0], [4, 7, 0], [4, 8, 0], [4, 9, 2], [4, 10, 4], [4, 11, 4], [4, 12, 2], [4, 13, 4], [4, 14, 4], [4, 15, 14], [4, 16, 12], [4, 17, 1], [4, 18, 8], [4, 19, 5], [4, 20, 3], [4, 21, 7], [4, 22, 3], [4, 23, 0], [5, 0, 2], [5, 1, 1], [5, 2, 0], [5, 3, 3], [5, 4, 0], [5, 5, 0], [5, 6, 0], [5, 7, 0], [5, 8, 2], [5, 9, 0], [5, 10, 4], [5, 11, 1], [5, 12, 5], [5, 13, 10], [5, 14, 5], [5, 15, 7], [5, 16, 11], [5, 17, 6], [5, 18, 0], [5, 19, 5], [5, 20, 3], [5, 21, 4], [5, 22, 2], [5, 23, 0], [6, 0, 1], [6, 1, 0], [6, 2, 0], [6, 3, 0], [6, 4, 0], [6, 5, 0], [6, 6, 0], [6, 7, 0], [6, 8, 0], [6, 9, 0], [6, 10, 1], [6, 11, 0], [6, 12, 2], [6, 13, 1], [6, 14, 3], [6, 15, 4], [6, 16, 0], [6, 17, 0], [6, 18, 0], [6, 19, 0], [6, 20, 1], [6, 21, 2], [6, 22, 2], [6, 23, 6]];
    option = {
        tooltip: {},
        // visualMap组件根据Z轴值的大小映射不同的颜色
        visualMap: {
            min: 0,
            max: 20,
            text: ['20', '0'],
            bottom: '10%',
            inRange: {
                color: [
                    '#313695',
                    '#4575b4',
                    '#74add1',
                    '#abd9e9',
                    '#e0f3f8',
                    '#ffffbf',
                    '#fee090',
                    '#fdae61',
                    '#f46d43',
                    '#d73027',
                    '#a50026'
                ]
            }
        },
        // graphic组件添加说明文本
        graphic: [
            {
                type: 'text',
                left: '5%',
                bottom: '21%',
                style: {
                    text: 'value',
                    fill: '#000',
                    font: '14px Microsoft YaHei'
                }
            }
        ],
        xAxis3D: {
            type: 'category',
            data: hours,
            name: 'test1'
        },
        yAxis3D: {
            type: 'category',
            data: days,
            name: 'test2',
            nameGap: 25,      // 设置Y轴名称与轴线之间的距离,单位是像素
            axisLabel: {
                // 设置标注与轴线之间的间距
                margin: 5  // 这里的20可以根据需要调整为其他值
            }
        },
        zAxis3D: {
            type: 'value',
            name: 'test3'
        },
        grid3D: {
            boxWidth: 200,
            boxDepth: 80,
            viewControl: {
                // projection: 'orthographic'
            },
            light: {
                main: {
                    intensity: 1.2,
                    shadow: true
                },
                ambient: {
                    intensity: 0.3
                }
            }
        },
        series: [
            {
                type: 'bar3D',
                data: data.map(function (item) {
                    return {
                        value: [item[1], item[0], item[2]]
                    };
                }),
                shading: 'lambert',
                label: {
                    fontSize: 16,
                    borderWidth: 1
                },
                emphasis: {
                    label: {
                        fontSize: 20,
                        color: '#900'
                    },
                    itemStyle: {
                        color: '#900'
                    }
                }
            }
        ]
    };

    // 添加下载事件
    document.getElementById('download').addEventListener('click', function() {
        // 使用echarts的getDataURL方法获取图表的Base64编码
        const url = myChart.getDataURL({
            type: 'png',
            pixelRatio: 2, // 设置图像的分辨率
            backgroundColor: '#fff' // 设置背景色(可选)
        });

        // 创建一个下载链接
        const a = document.createElement('a');
        a.href = url;
        a.download = 'chart.png';
        document.body.appendChild(a);
        a.click();
        document.body.removeChild(a);
    });

    if (option && typeof option === 'object') {
        myChart.setOption(option);
    }

    window.addEventListener('resize', myChart.resize);
</script>
</body>
</html>
结果展示
点击下载按钮,即可保存为png格式。