1、
python
from ming import *  # 有点像C语言中的头文件
"""
  在Python开发环境中,封装一个函数,功能目标为:通过两个整数参数一次性获取和、差、积、商四个值
"""
def calc(a, b):
    return a + b, a - b, a * b, a / b, a ** 2 + b ** 2
x, y = rd(), rd()#首先生成两个随机整数x和y
print('x ->', x)
print('y ->', y)
print()
tp = calc(x, y)
print('->', tp)
print('* * * * * * * * * * * * * * * * * * * * * * * * *')
x, y = y, x#交换x和y的值
print('x ->', x)
print('y ->', y)
运行结果:
python
x -> 40
y -> 37

-> (77, 3, 1480, 1.0810810810810811, 2969)
* * * * * * * * * * * * * * * * * * * * * * * * *
x -> 37
y -> 40
2、
python
# from pyecharts.faker import Faker
from faker import Faker
ff = Faker('zh_CN')
ff1 = Faker()
# 创建名字
print('->', ff.name())  # 中文
print('->', ff1.name())  # 英文
print()
# 产生地址
for i in range(5):
    print('->', ff.address())
print()
# 产生城市名字
for i in range(5):
    print('->', ff.city())
print()
# 产生邮箱
for i in range(3):
    print('->', ff.email())
print()
# 产生银行
for i in range(6):
    print('->', ff.bank())
print()
# 产生公司名称
print('->', ff.company())
print('->', ff.company())
print('->', ff.company())
print()
# 产生端口号
print('->', ff.port_number())
print('->', ff.port_number())
print()
# 产生 16 进制的随机颜色
print('->', ff.hex_color())
print('->', ff.hex_color())
print('->', ff.hex_color())
print()
# 产生 10  进制的随机颜色
for i in range(4):
    print('->', ff.rgb_color())
print()
# 产生手随机号码
print('->', ff.phone_number())
print('->', ff.phone_number())
print('->', ff.phone_number())
print()
# 产生国家
print('->', ff.country())
print('->', ff.country())
print('->', ff.country())
print('->', ff.country())
print()
# 产生某个范围内的整数
for i in range(5):
    print('->', ff.random_int())
    print('->', ff.random_int(200, 500))
    print()
# 产生颜色名称
print('->', ff.color_name())
print('->', ff.color_name())
print('->', ff.color_name())
print('->', ff.color_name())
print('->', ff.color_name())
print('->', ff.color_name())
print()
# 产生年、月、日
print('->', ff.year(), ff.month(), ff.day_of_month())
print('->', ff.year(), ff.month(), ff.day_of_month())
print('->', ff.year(), ff.month(), ff.day_of_month())
print()
# 产生日期和时间
print('->', ff.date(), ff.time())
print('->', ff.date(), ff.time())
print('->', ff.date(), ff.time())
print()
运行结果:
python
-> 李梅
-> Philip Serrano

-> 吉林省芳市徐汇左街n座 173968
-> 山东省勇县黄浦鄢街L座 243290
-> 海南省亮市南溪哈尔滨路V座 186071
-> 江西省福州市大兴张路S座 302244
-> 江西省东莞县大东高路J座 318712

-> 辽阳县
-> 志强县
-> 英县
-> 太原县
-> 东莞市

-> caojie@example.org
-> azeng@example.net
-> songyan@example.com

-> 中信银行
-> 中信银行
-> 国家开发银行
-> 中国邮政储蓄银行
-> 中国进出口银行
-> 西安银行

-> 诺依曼软件传媒有限公司
-> 泰麒麟信息有限公司
-> 数字100网络有限公司

-> 11082
-> 51458

-> #5f226d
-> #792709
-> #db6dff

-> 124,11,3
-> 100,27,191
-> 214,137,37
-> 215,170,55

-> 18619614132
-> 13692703263
-> 18069931575

-> 墨西哥
-> 圣多美和普林西比
-> 巴西
-> 朝鲜

-> 9671
-> 280

-> 3189
-> 278

-> 8303
-> 272

-> 36
-> 417

-> 95
-> 434

-> Azure
-> DimGray
-> Lavender
-> Orchid
-> MediumOrchid
-> MediumOrchid

-> 2017 11 30
-> 1987 03 04
-> 2002 02 06

-> 1992-10-13 18:36:17
-> 2024-06-14 08:59:41
-> 1983-06-24 05:08:04
3、
python
import numpy as np
# 通过原生Python数组产生numpy数组
aa = [3, 4, 5, 21, 17, ]
bb = [1, 2, 3, 4, 5]
print('aa ->', aa)
print('bb ->', bb)
print()
cc = aa + bb#合并两个数组
print('cc ->', cc)
print()
cc = []
dd = []
for i in range(aa.__len__()):
    cc.append(aa[i] + bb[i])#两个数组相加
    dd.append(aa[i] * bb[i])#两个数组相乘
print('cc ->', cc)
print('dd ->', dd)
print('* * * * * * * * * * * * * * * * * * * * * * * * *')
aa = np.array(aa)
bb = np.array(bb)
"""
  在C++中有一个重要的技术点:运算符重载,目的操作直观;
"""
cc = aa + bb
dd = aa * bb
ee = aa // bb
print('cc ->', cc)
print('dd ->', dd)
print('ee ->',ee)
运行结果:
python
aa -> [3, 4, 5, 21, 17]
bb -> [1, 2, 3, 4, 5]

cc -> [3, 4, 5, 21, 17, 1, 2, 3, 4, 5]

cc -> [4, 6, 8, 25, 22]
dd -> [3, 8, 15, 84, 85]
* * * * * * * * * * * * * * * * * * * * * * * * *
cc -> [ 4  6  8 25 22]
dd -> [ 3  8 15 84 85]
ee -> [3 2 1 5 3]
4、
python
# 引用matplotlib模块
import matplotlib.pyplot as plt # 画笔
# 引用 numpy 模块
import numpy as np
# 中文处理和负号的处理
plt.rcParams['font.family'] = ['SimHei']
plt.rcParams['axes.unicode_minus'] = False
# 设置画布大小和分辨率
fig = plt.figure(figsize=(8, 5), dpi=100)
# 提供数据: 在水平方向(x轴)提供的角度,单位是弧度
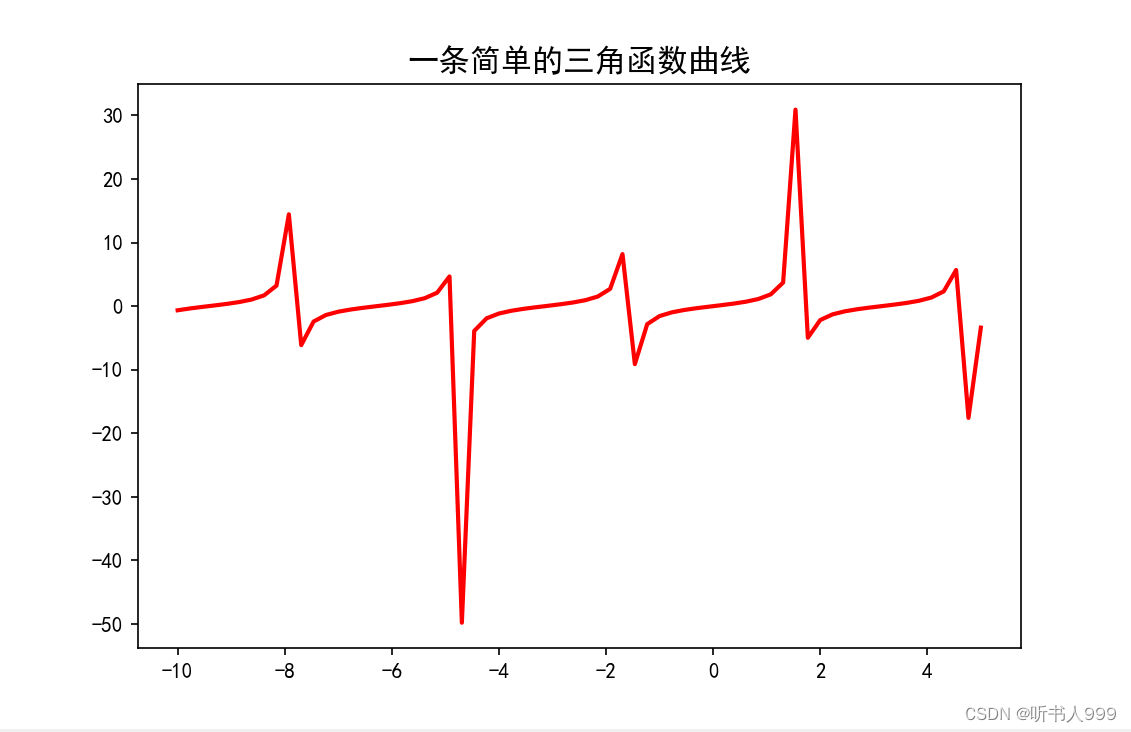
x = np.linspace(-10, 5, 66)
y = np.tan(x)
# 指定颜色为红色(c='r'),线型为实线(ls='-'),线宽为 2 像素(lw=2)。
plt.plot(x, y, c='r', ls='-', lw=2)
# 水平轴和竖直轴上的数据显示采用相同的比
# plt.axis("equal")
# 设置标题为 "一条简单的三角函数曲线",字体大小为 15,字体加粗。
plt.title("一条简单的三角函数曲线", fontsize=15, fontweight='bold')
# 让图像正常显示
plt.show()运行结果:
5、
python
# 引用matplotlib模块
import matplotlib.pyplot as plt # 画笔
# 引用 numpy 模块
import numpy as np
# 中文处理和负号的处理
plt.rcParams['font.family'] = ['SimHei']
plt.rcParams['axes.unicode_minus'] = False
# 设置画布大小和分辨率
fig = plt.figure(figsize=(10, 5), dpi=100)
# 提供数据: 在水平方向(x轴)提供的角度,单位是弧度
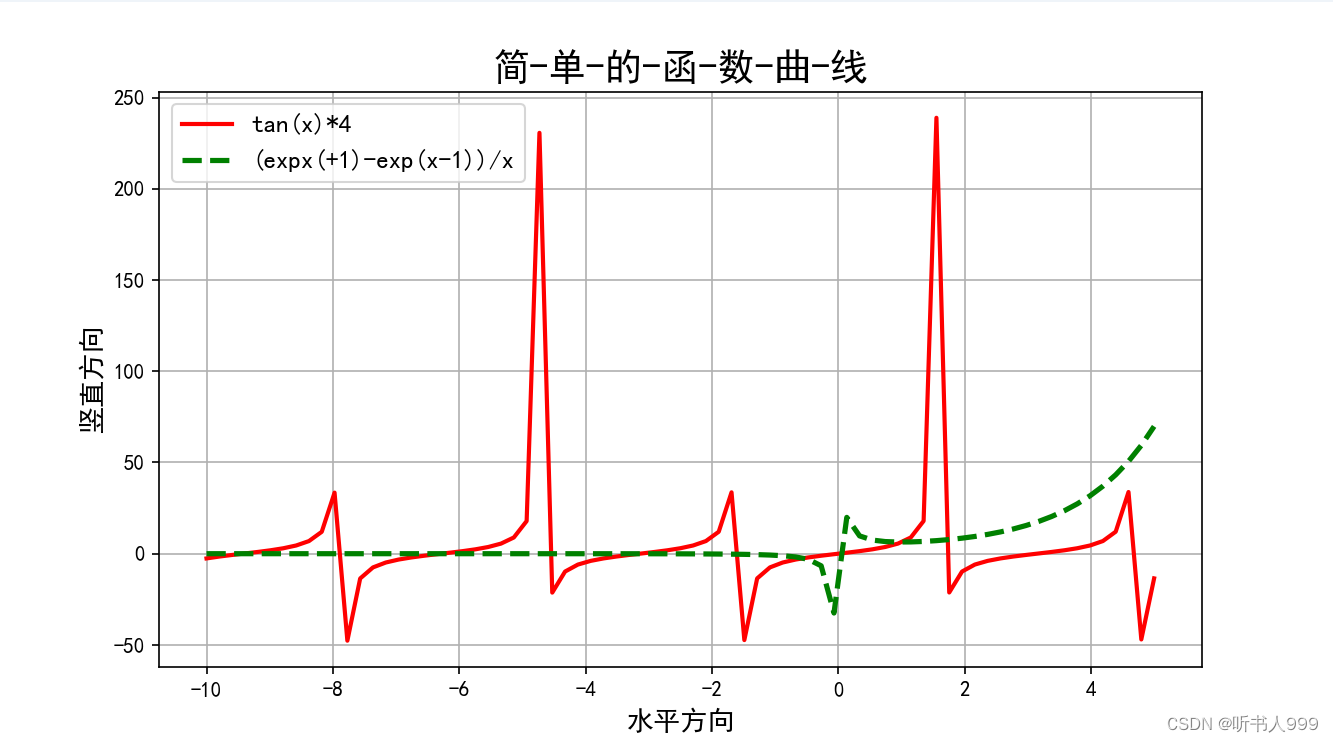
x = np.linspace(-10, 5, 75)
y = np.tan(x) * 4
y1 = (np.exp(x + 1) - np.exp(x - 1)) / x
y1[x == 0] = np.nan
# 画函数曲线;
plt.plot(x, y, c='r', ls='-', lw=2, label='tan(x)*4')
plt.plot(x, y1, c='g', ls='--', lw=2.5, label='(expx(+1)-exp(x-1))/x')
# 水平轴和竖直轴上的数据显示采用相同的比
# plt.axis("equal")
# 设置标题
plt.title("简-单-的-函-数-曲-线", fontsize=18, fontweight='bold')
plt.xlabel('水平方向', fontsize=13)
plt.ylabel('竖直方向', fontsize=13)
plt.legend(loc='best', fontsize=12)
plt.grid(True)
# 让图像正常显示
plt.show()运行结果:
6、画出下面这个图像
python
# 引用matplotlib模块
import matplotlib.pyplot as plt # 画笔
# 引用 numpy 模块
import numpy as np
# 中文处理和负号的处理
plt.rcParams['font.family'] = ['SimHei']
plt.rcParams['axes.unicode_minus'] = False
# 设置画布大小和分辨率
fig = plt.figure(figsize=(10, 5), dpi=100)
# 提供数据: 在水平方向(x轴)提供的角度,单位是弧度
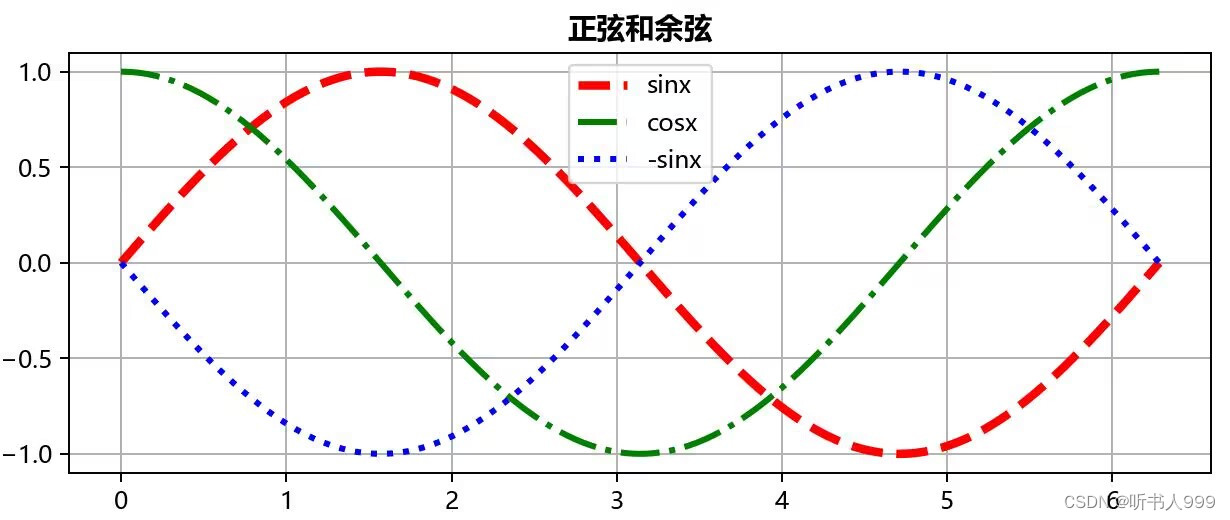
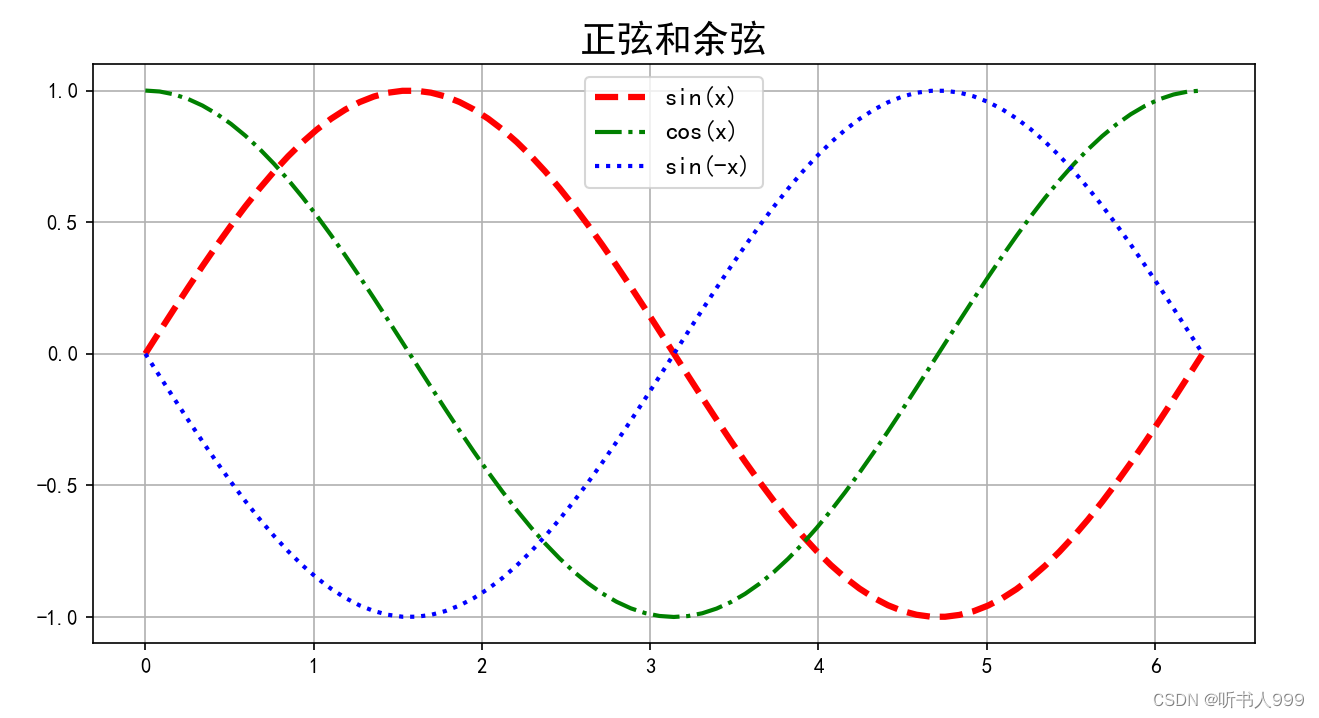
x = np.linspace(0, 2*3.14, 75)
plt.yticks(np.arange(-1.0, 1.5, step=0.5)) # 设置纵坐标的刻度范围和步长为0.5
y1 = np.sin(x)
y2 = np.cos(x)
y3 = np.sin(-x)
# 画函数曲线;
plt.plot(x, y1, c='r', ls='--', lw=3, label='sin(x)')
plt.plot(x, y2, c='g', ls='-.', lw=2, label='cos(x)')
plt.plot(x, y3, c='b', ls=':', lw=2, label='sin(-x)')
# 水平轴和竖直轴上的数据显示采用相同的比
# plt.axis("equal")
# 设置标题
plt.title("正弦和余弦", fontsize=18, fontweight='bold')
#plt.xlabel('水平方向', fontsize=13)
#plt.ylabel('竖直方向', fontsize=13)
plt.legend(loc='best', fontsize=12)
plt.grid(True)
# 让图像正常显示
plt.show()运行结果:
7、
python
import numpy as np
import matplotlib.pyplot as plt
from ming import hexcolor
plt.rcParams['font.family'] = ['SimHei']#宋体
fig = plt.figure(figsize=(12, 5), dpi=100)
x = np.arange(1, 16)#生成了一个从1到15的整数数组x
# print('->', x)
y = np.random.randint(10, 70, x.__len__())#与x长度相同的随机整数数组y
# print('->', y)
#设置了参数c='g'表示折线颜色为绿色,lw=3表示线宽为3,ls=":"表示线型为虚线,
# marker='D'表示数据点的图标为菱形,ms=10表示数据点大小为10,
# markeredgecolor='red'表示数据点边缘颜色为红色,mfc='yellow'表示数据点填充颜色为黄色,
# label="带标记的折线图"为图例标签。
plt.plot(x, y, c='g', lw=3, ls=":", marker='D', ms=10,
         markeredgecolor='red', mfc='yellow', label="带标记的折线图")
plt.legend()
# plt.grid(True)
plt.show()
运行结果:

8、
python
# 引入多个模块
from pyecharts.faker import Faker
import numpy as np
import matplotlib.pyplot as plt
# 处理中文
plt.rcParams['font.family'] = ['SimHei']
# 设置画布和分辨率
fig = plt.figure(figsize=(8, 5), dpi=100)
# 提供数据
weeks = Faker.week
values = Faker.values()
#颜色设置为每个柱子随机生成一个颜色
plt.bar(weeks, values, color=[Faker.rand_color() for k in range(7)])
# plt.text()方法在每个柱子上方显示数值,fontsize设置文本大小为14,
# fontweight设置为粗体,ha设置为水平居中。
for a, b in zip(weeks, values):
    plt.text(a, b, b, fontsize=14, fontweight='bold', ha='center')
plt.grid(True)#显示网格线
plt.show()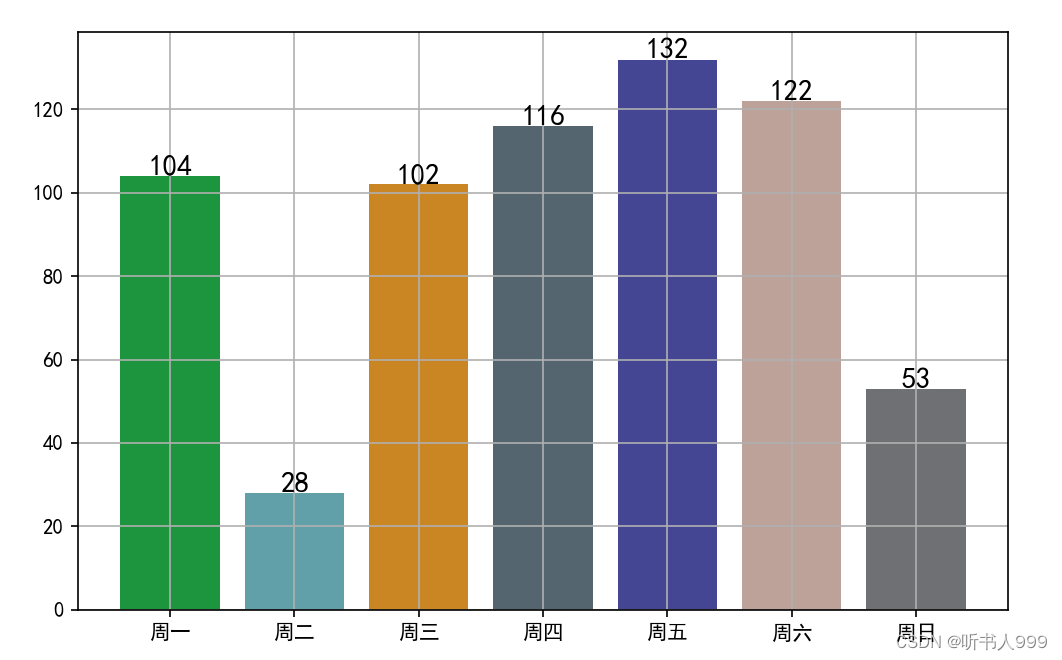
9、
python
ids = [1234, 5678, 4567, ]
names = ['张三', '李四', '王小五']
ages = [16, 20, 18]
for id, name, age in zip(ids, names, ages):
    info = id, name, age
    print('->',info)
#ids列表中有4个元素,而names和ages列表分别只有3个元素。在这种情况下,zip()
#函数会以最短的列表为准,只会配对3个元素。
运行结果:
python
-> (1234, '张三', 16)
-> (5678, '李四', 20)
-> (4567, '王小五', 18)
10、
python
import numpy as np
# 通过原生Python数组产生numpy数组
nn = 5
xx = np.random.randint(11, 90, nn)
print('xx ->', xx)
yy = np.random.randint(0, 100, nn)
print('yy ->', yy)
print()
print(xx + yy)
print(xx - yy)
print(xx * yy)
# print(xx % yy)
print('* * * * * * * * * * * * * * * * * * * * * * * * *')
aa = np.random.randint(10, 100, (4, 5))
for a in aa:
    print('->', a)
print()
bb = np.random.randint(10, 100, (4, 5))
for b in bb:
    print('->', b)
print()
cc = aa + bb
print(cc)
print('* * * * * * * * * * * * * * * * * * * * * * * * *')
xxx = np.random.randint(10, 200, (2, 3, 4))
for xx in xxx:
    for x in xx:
        print(x)
    print()
print('* * * * * * * * * * * * * * * * * * * * * * * * *')
"""
  numpy中的数组维度的转换:1->2->1->3 维度是任意的;
  将xxx这个三维数组,24元素,转换为 2:(2,12),(6,4),(4,6),(8,3),(3,8)
"""
aa = xxx.reshape(2, 12)
print(aa)
print()
aa = xxx.reshape(8, 3)
print(aa)
print('* * * * * * * * * * * * * * * * * * * * * * * * *')
"""
  将三维数组xxx变为一维数组;
  在编程语言中,数组有维度的区别;实际在内存中,没有多维数组的存在,
  只有一维数组;
"""
a = xxx.reshape(24)
print(a)
print('* * * * * * * * * * * * * * * * * * * * * * * * *')
x = np.random.randint(1, 50, 12)
print('x ->', x)
print()
xx = x.reshape(3, 4)
print(xx)
print()
xxx = x.reshape(2, 2, 3)
print(xxx)
print('* * * * * * * * * * * * * * * * * * * * * * * * *')
# 最常用的方式:产生大量琐碎的测试数据;
x = np.linspace(-10, 11, 20)
print(x)
print(type(x))
运行结果:
python
xx -> [74 70 87 15 62]
yy -> [41 91  9 93 20]

[115 161  96 108  82]
[ 33 -21  78 -78  42]
[3034 6370  783 1395 1240]
* * * * * * * * * * * * * * * * * * * * * * * * *
-> [85 77 33 80 35]
-> [40 29 76 49 75]
-> [54 19 93 14 49]
-> [17 36 68 77 89]

-> [87 74 76 68 30]
-> [53 59 79 70 32]
-> [39 72 34 83 29]
-> [70 58 25 18 71]

[[172 151 109 148  65]
 [ 93  88 155 119 107]
 [ 93  91 127  97  78]
 [ 87  94  93  95 160]]
* * * * * * * * * * * * * * * * * * * * * * * * *
[ 39 156 155 104]
[140 108  35 160]
[ 78 154  26  40]

[183 114 167  68]
[ 64 187  13  16]
[ 24  29  52 117]

* * * * * * * * * * * * * * * * * * * * * * * * *
[[ 39 156 155 104 140 108  35 160  78 154  26  40]
 [183 114 167  68  64 187  13  16  24  29  52 117]]

[[ 39 156 155]
 [104 140 108]
 [ 35 160  78]
 [154  26  40]
 [183 114 167]
 [ 68  64 187]
 [ 13  16  24]
 [ 29  52 117]]
* * * * * * * * * * * * * * * * * * * * * * * * *
[ 39 156 155 104 140 108  35 160  78 154  26  40 183 114 167  68  64 187
  13  16  24  29  52 117]
* * * * * * * * * * * * * * * * * * * * * * * * *
x -> [42 15  2 22 33 37 48 39 34  5  7 49]

[[42 15  2 22]
 [33 37 48 39]
 [34  5  7 49]]

[[[42 15  2]
  [22 33 37]]

 [[48 39 34]
  [ 5  7 49]]]
* * * * * * * * * * * * * * * * * * * * * * * * *
[-10.          -8.89473684  -7.78947368  -6.68421053  -5.57894737
  -4.47368421  -3.36842105  -2.26315789  -1.15789474  -0.05263158
   1.05263158   2.15789474   3.26315789   4.36842105   5.47368421
   6.57894737   7.68421053   8.78947368   9.89473684  11.        ]