目录
[① 设置键值](#① 设置键值)
[② 在zabbix web端完成自定义监控项](#② 在zabbix web端完成自定义监控项)
[③ garafana里添加nginx上面的的三个监控项](#③ garafana里添加nginx上面的的三个监控项)
以下实验沿用上一篇zabbix部署,再添加一台虚拟机192.168.170.6
1、初始化、安装grafana
bash
初始化操作
systemctl disable --now firewalld
setenforce 0
vim /etc/selinux/config
SELINUX=disabled
bash
cd /opt
#上传软件包
yum localinstall -y grafana-enterprise-9.4.7-1.x86_64.rpm #安装
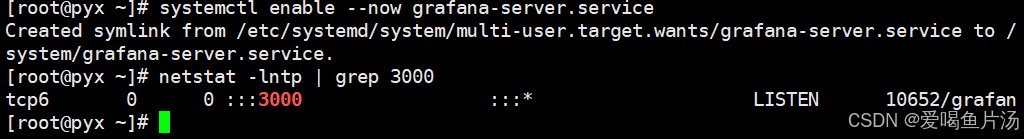
systemctl enable --now grafana-server.service #开启服务
netstat -lntp | grep 3000 #查询是否已经开启服务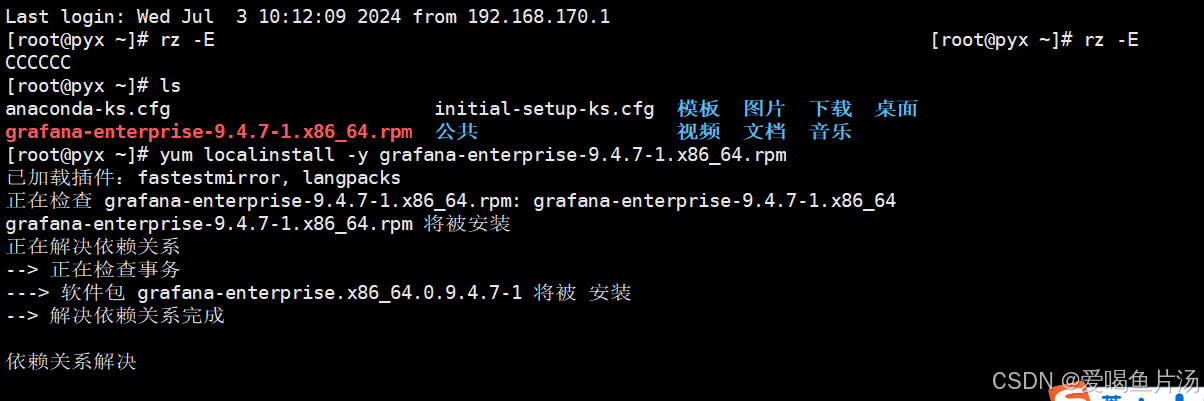
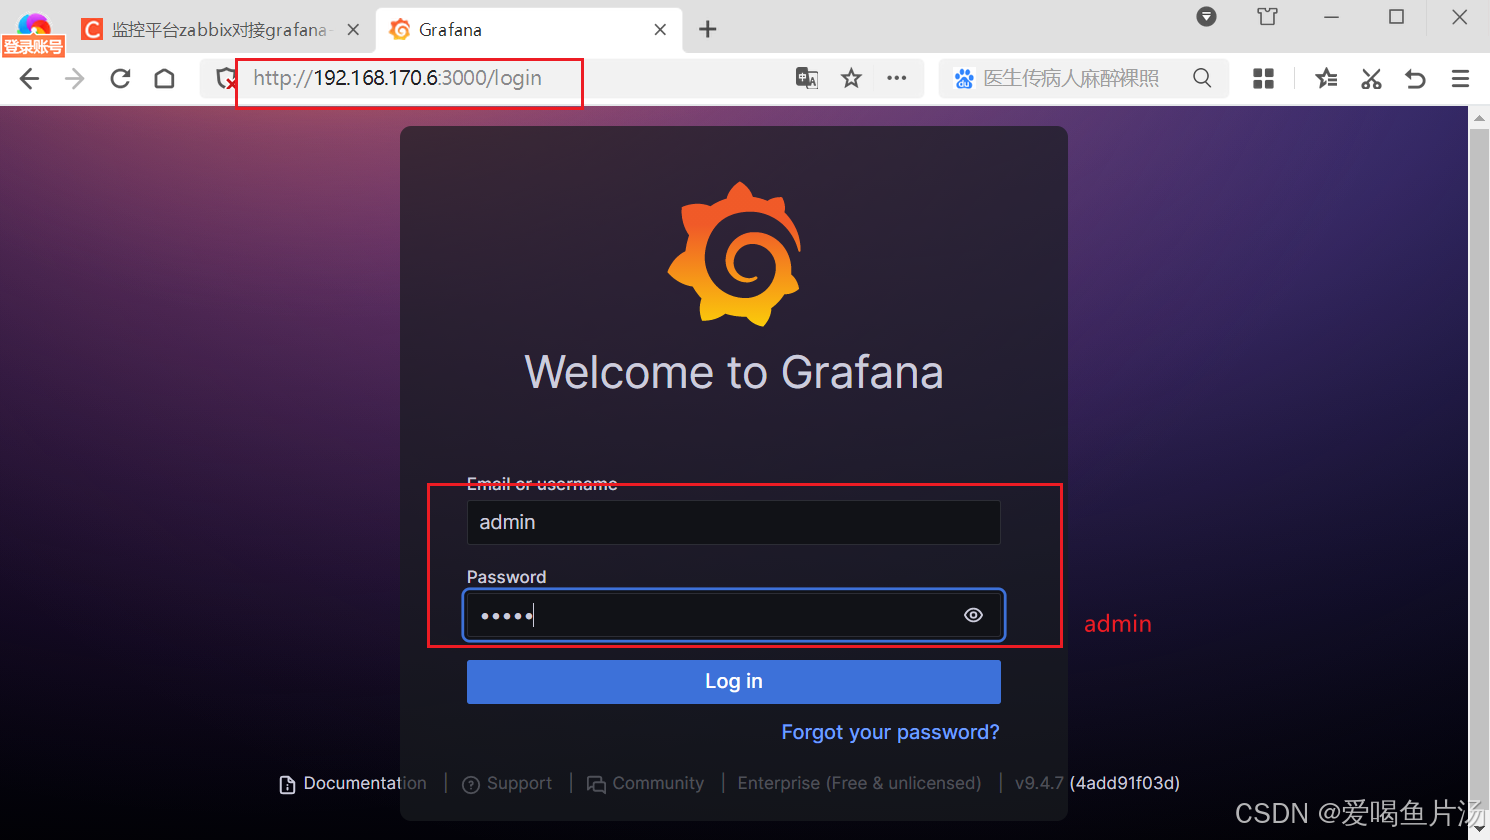
2、浏览器访问
浏览器输入http://192.168.170.6:3000
账号/密码:admin / admin
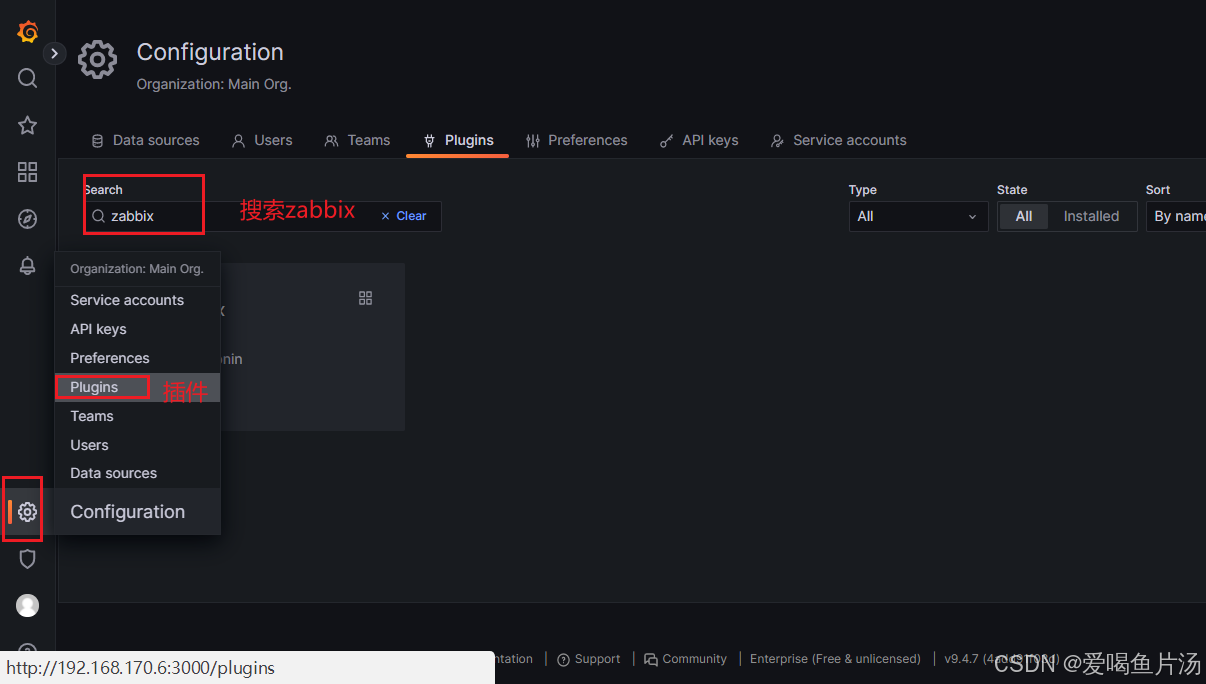
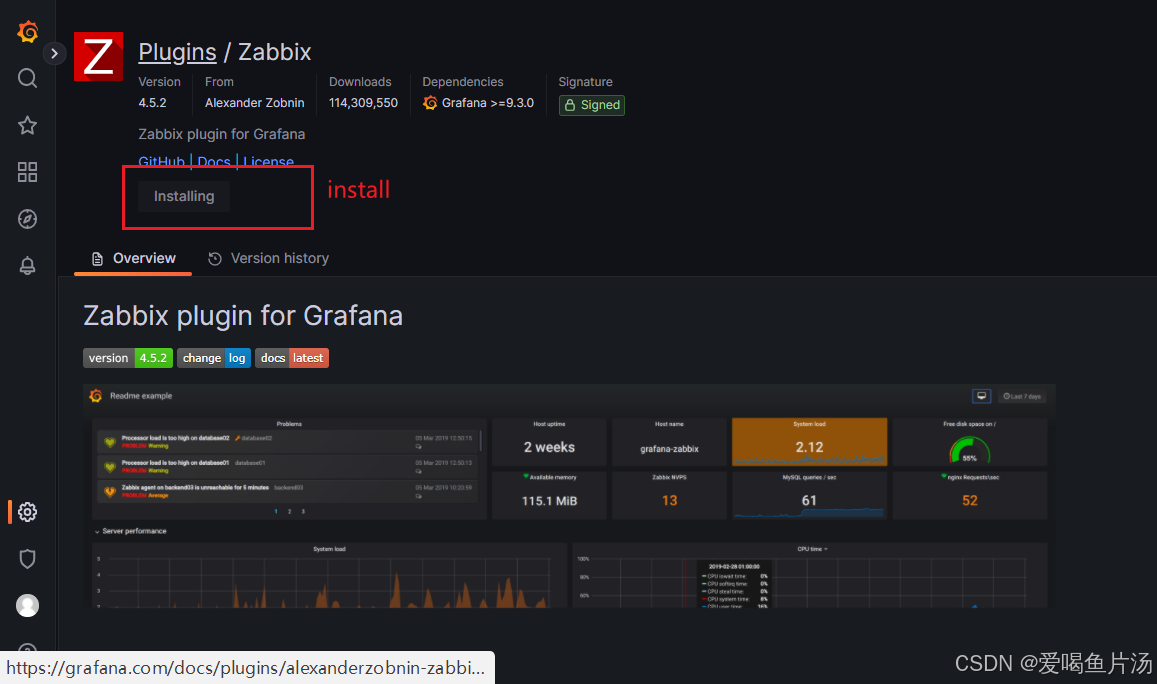
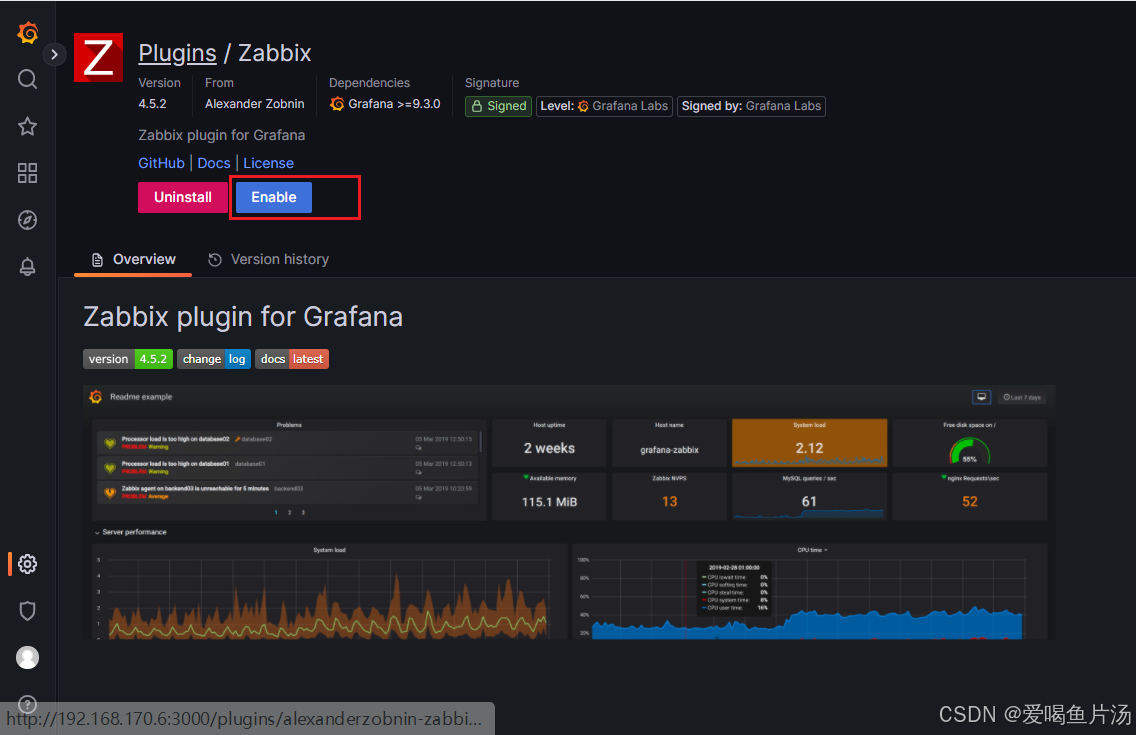
3、安装zabbix
【设置】-【plugins】-搜索zabbix-【install】-刷新页面 - 点击开启【enable】
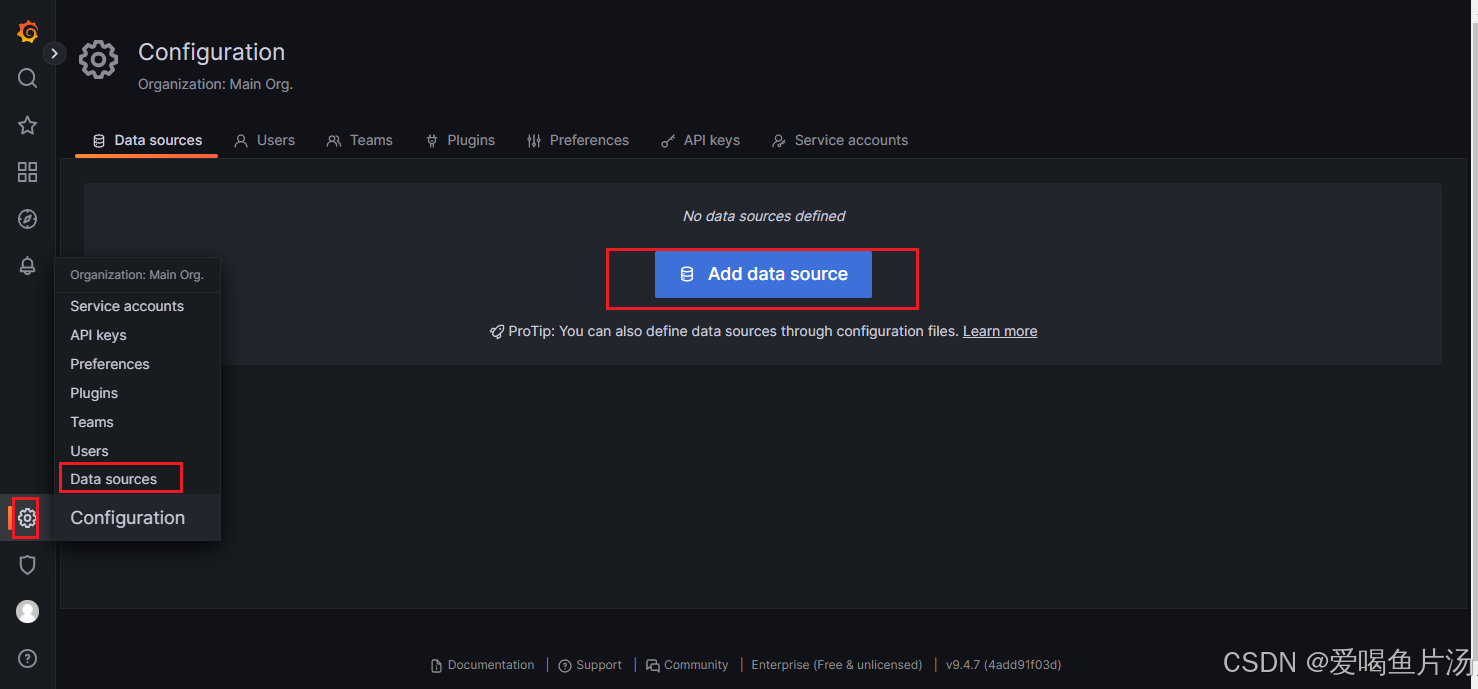
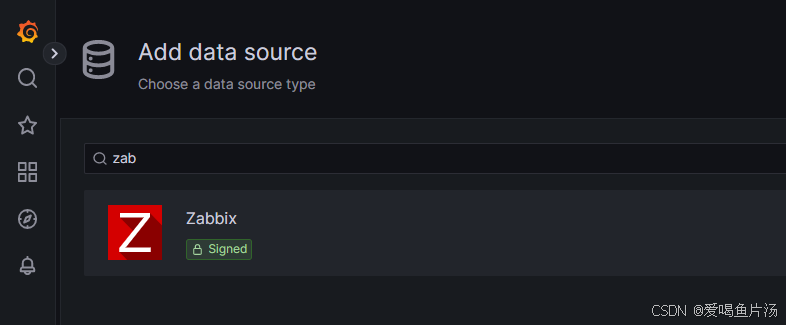
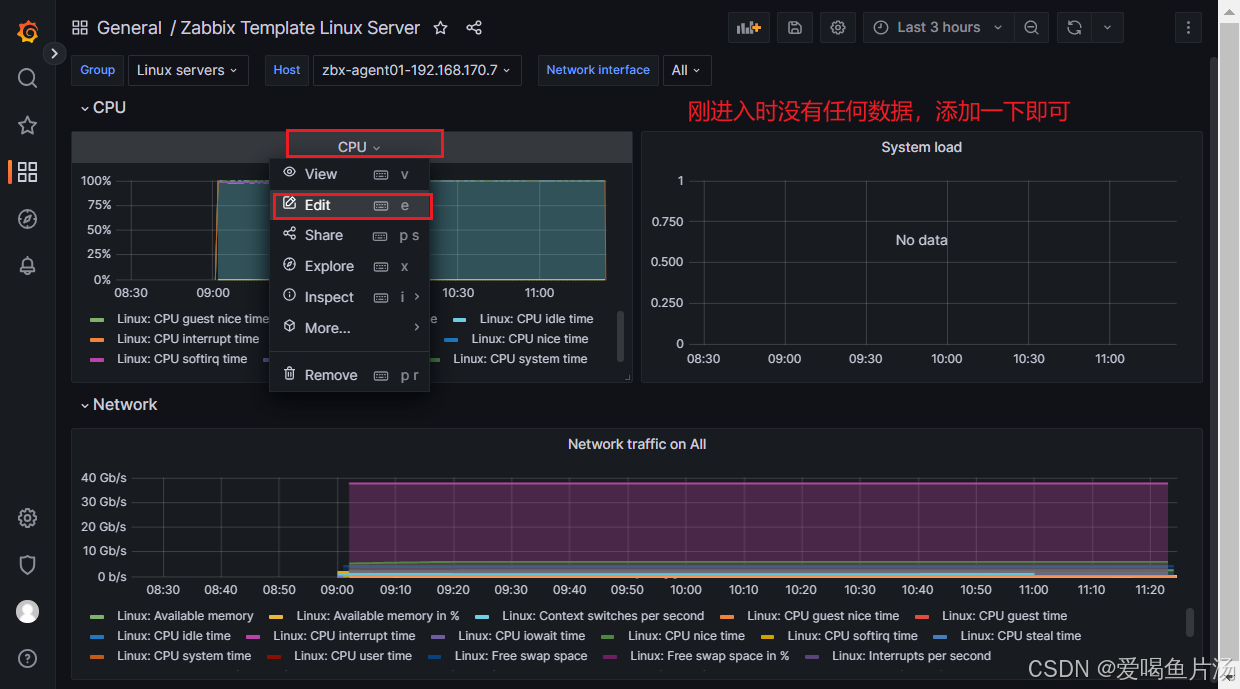
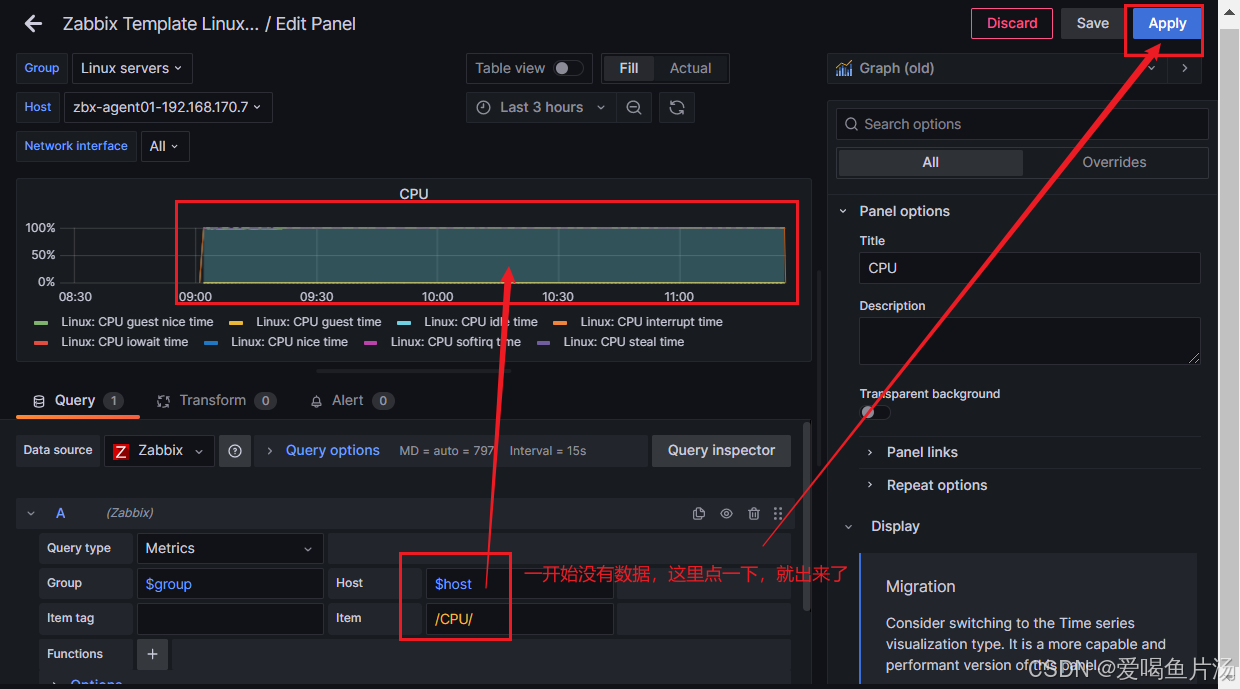
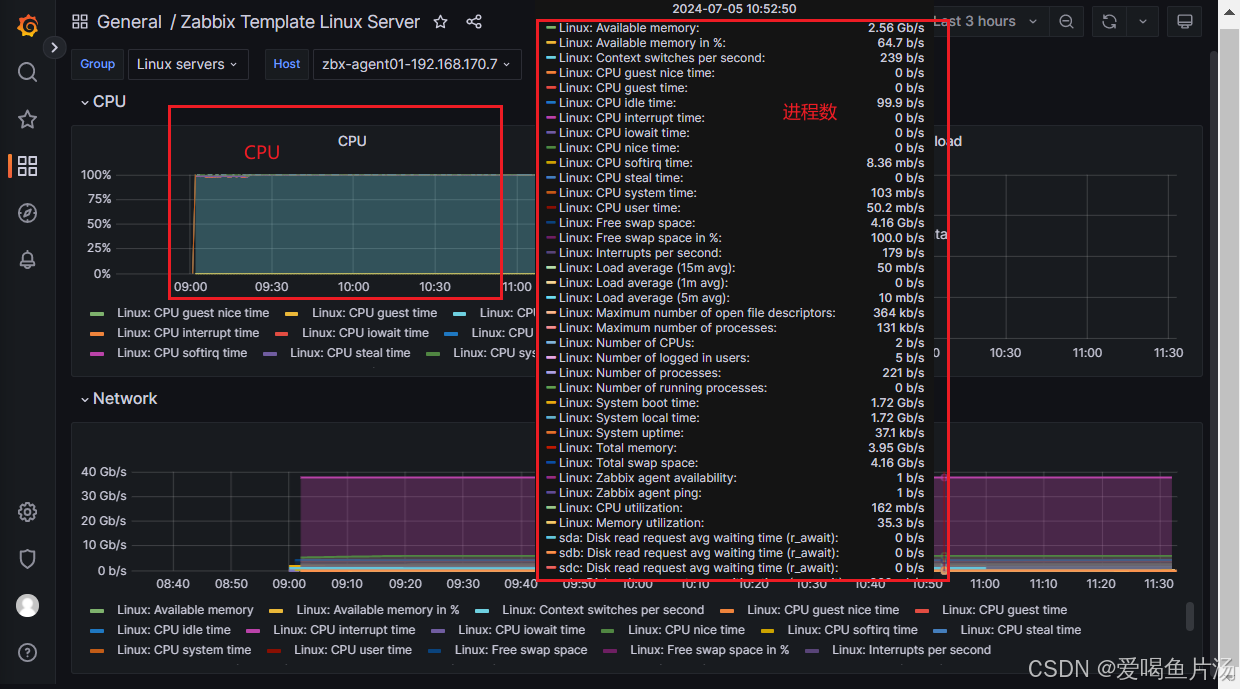
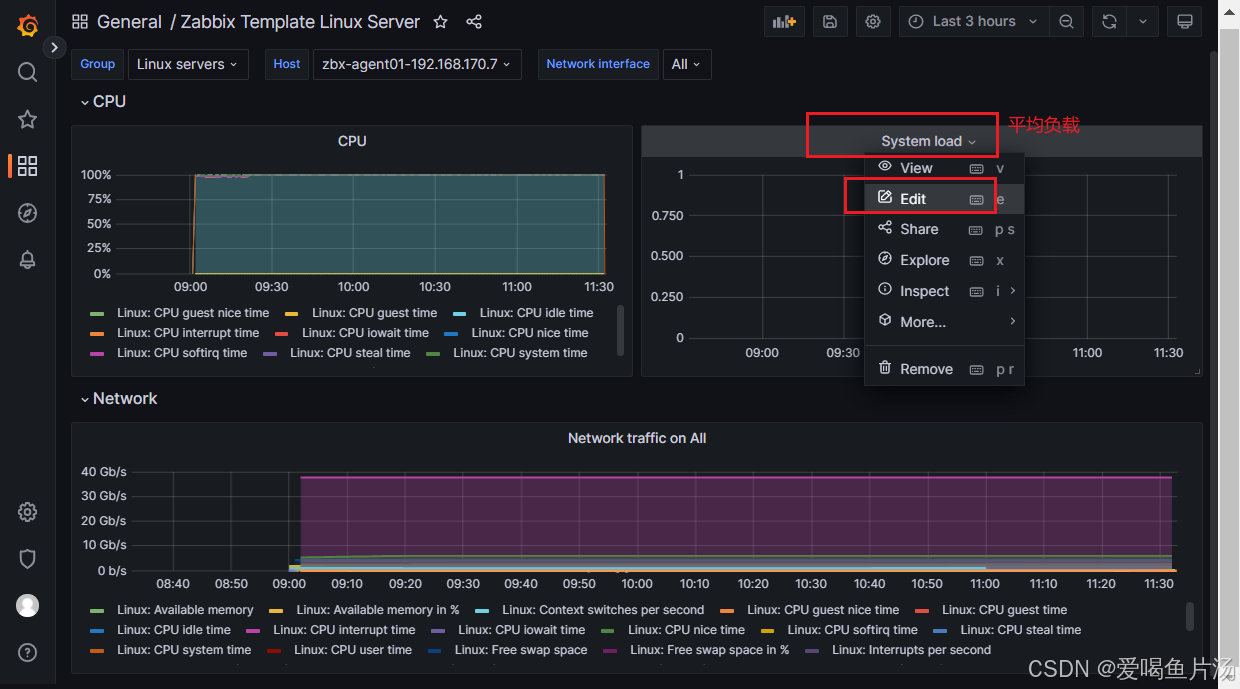
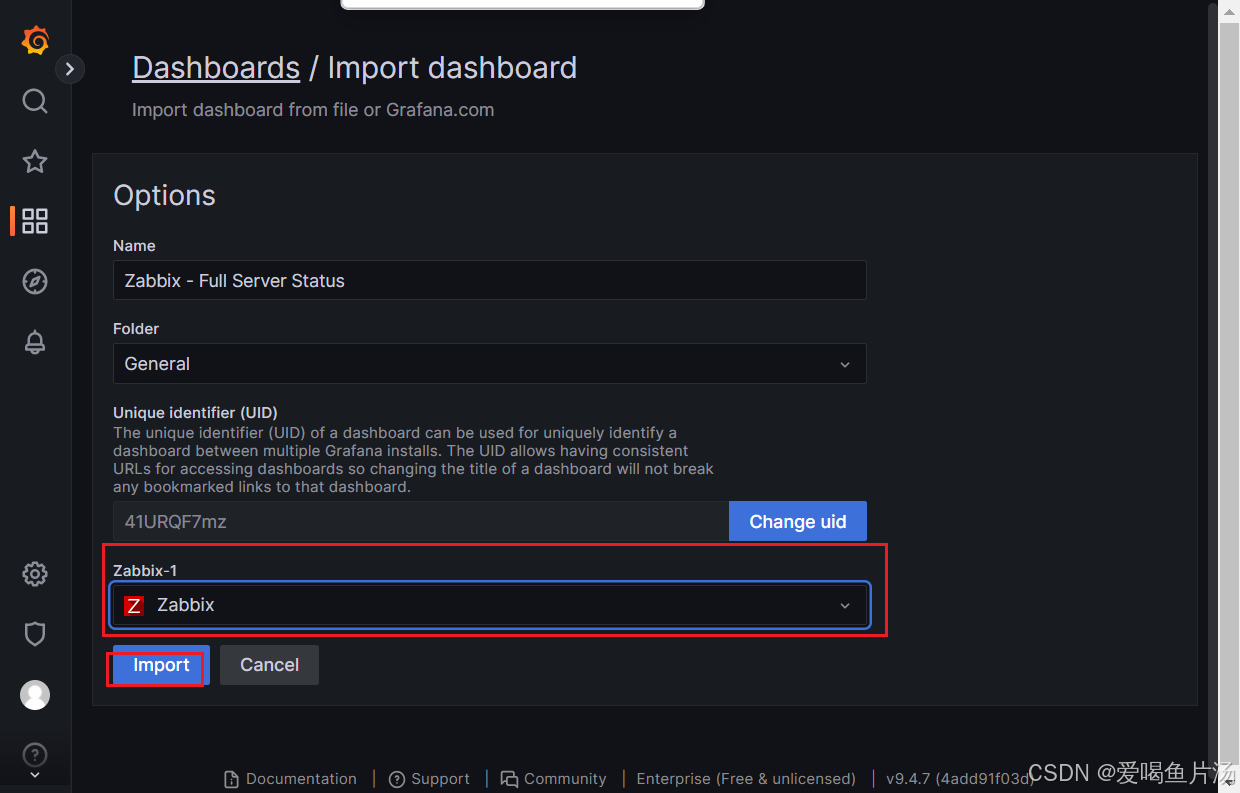
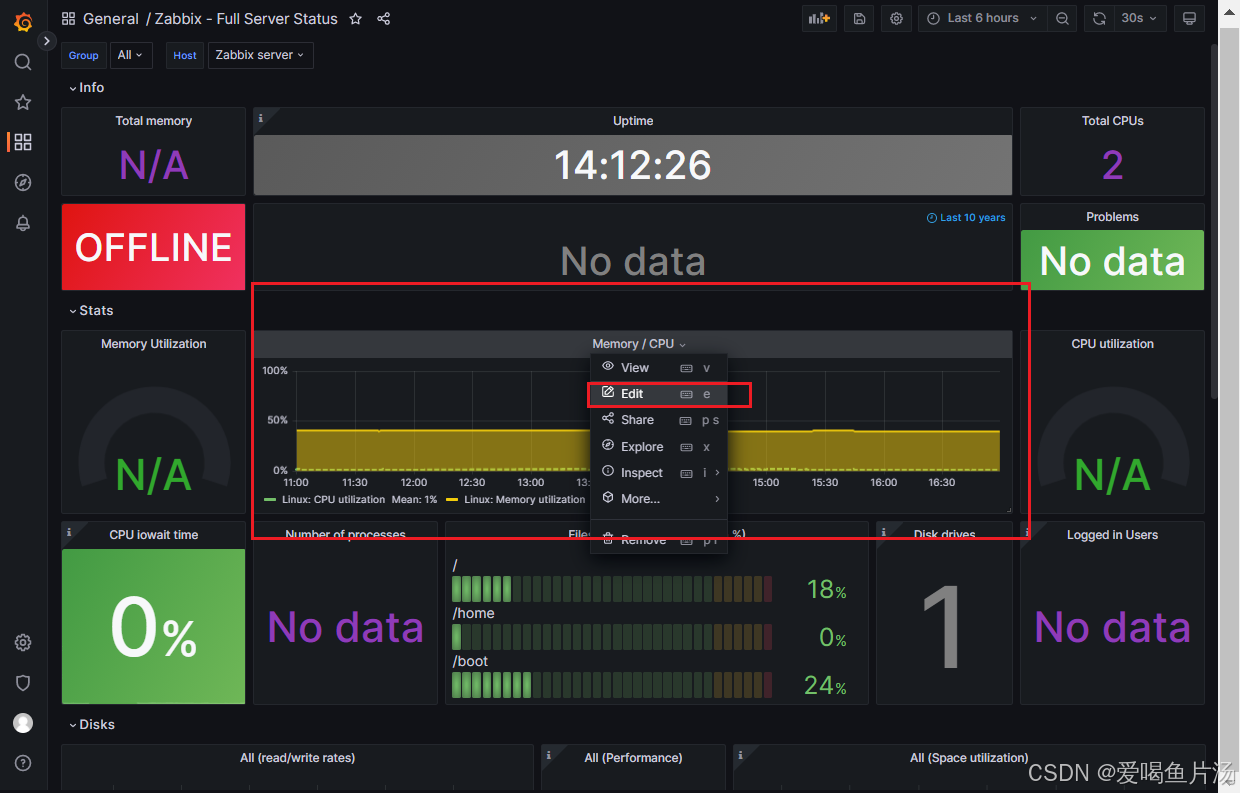
4、zabbix数据对接grafana
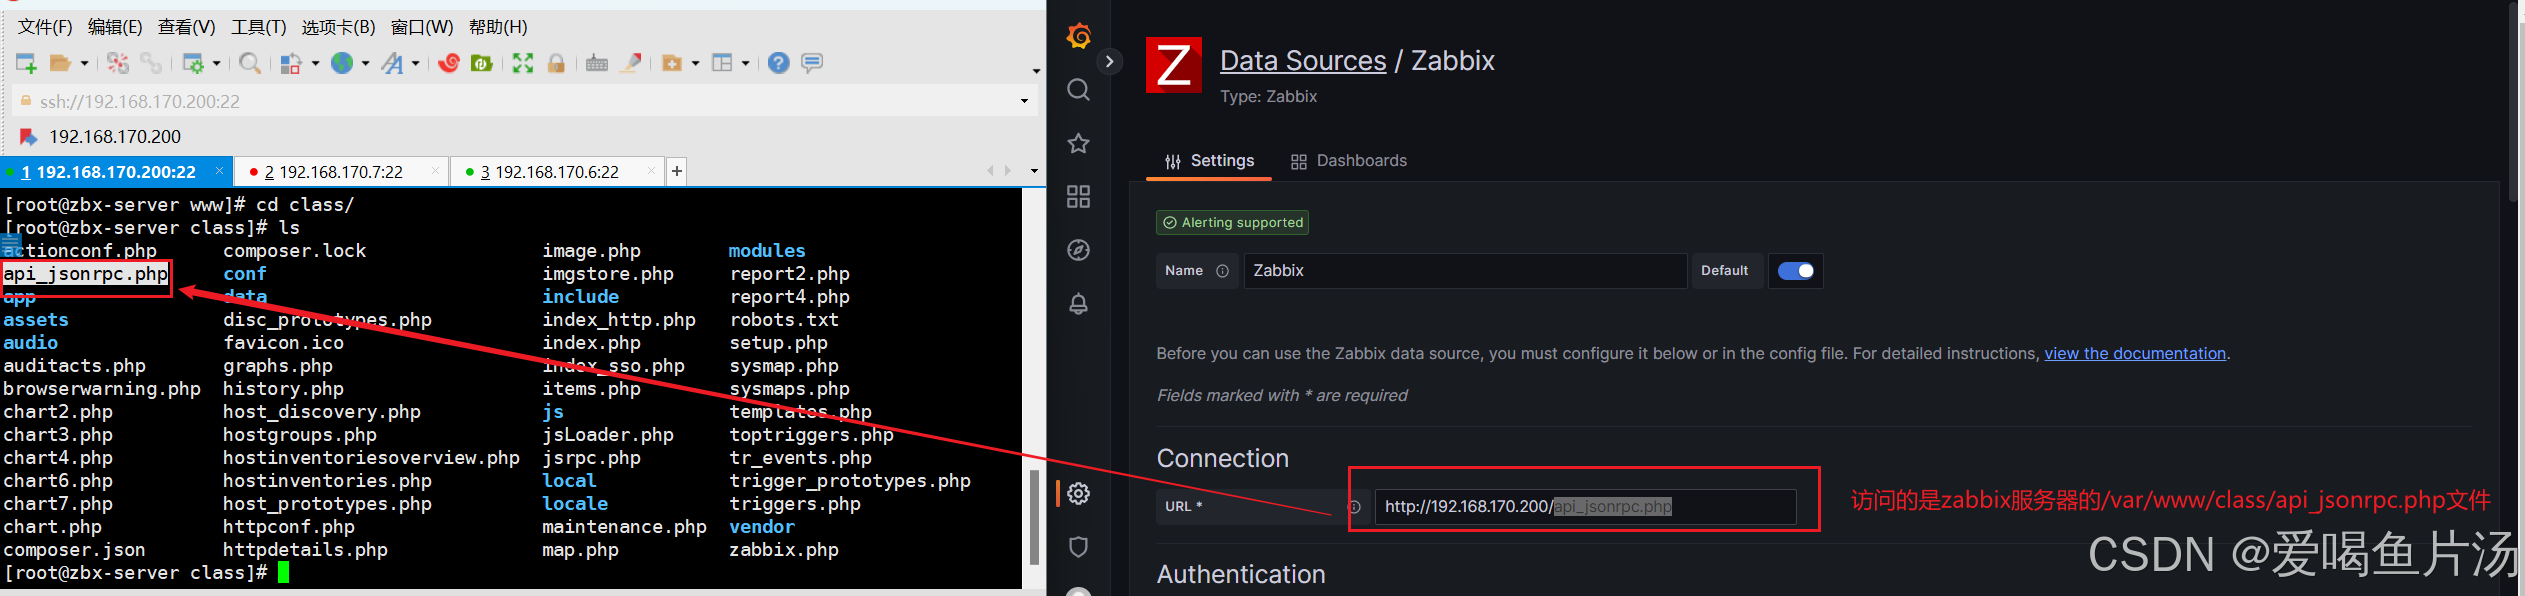
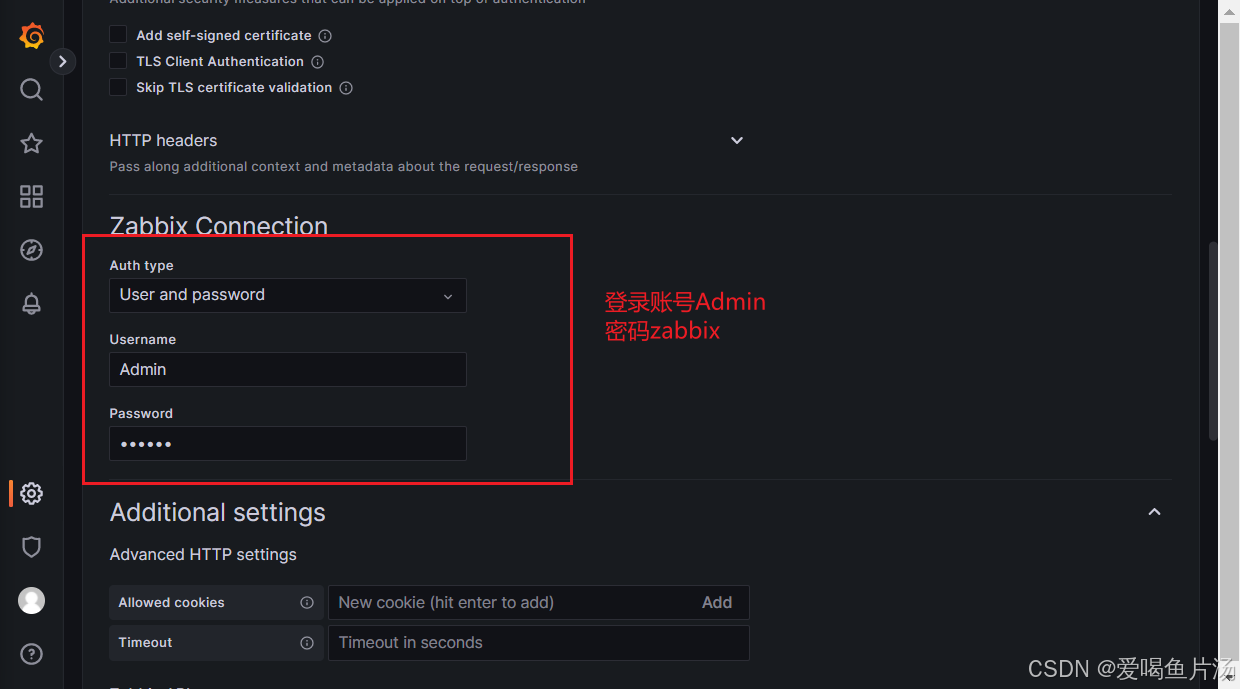
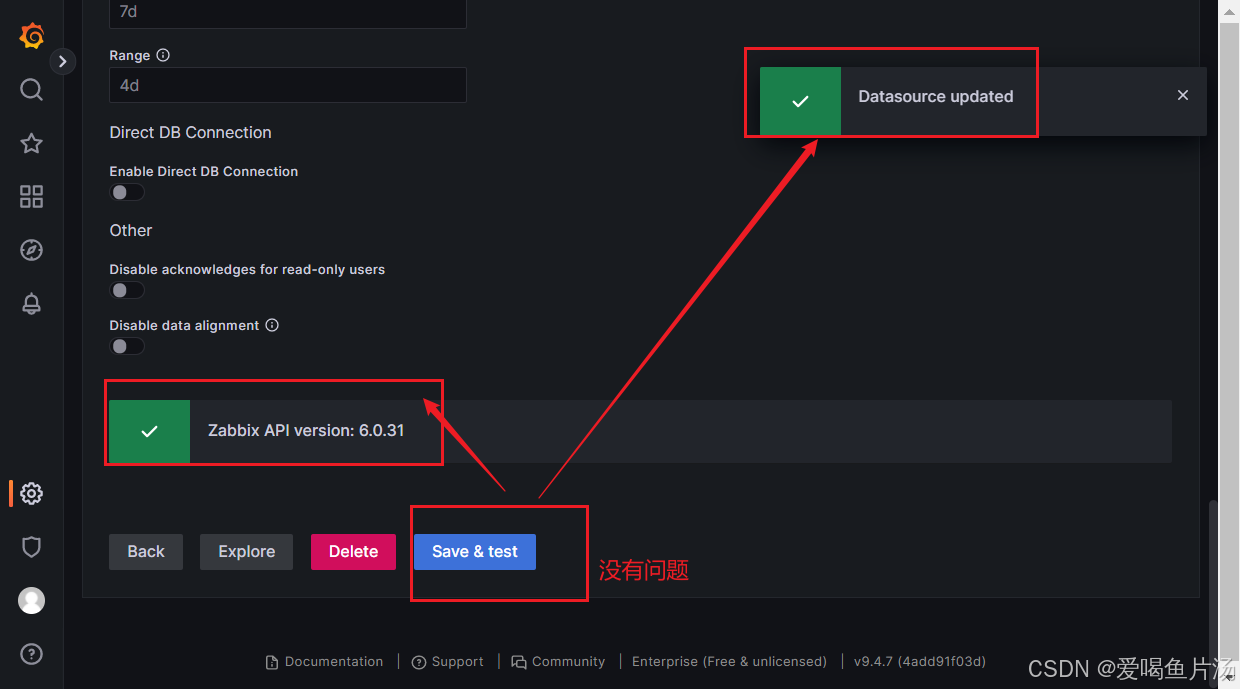
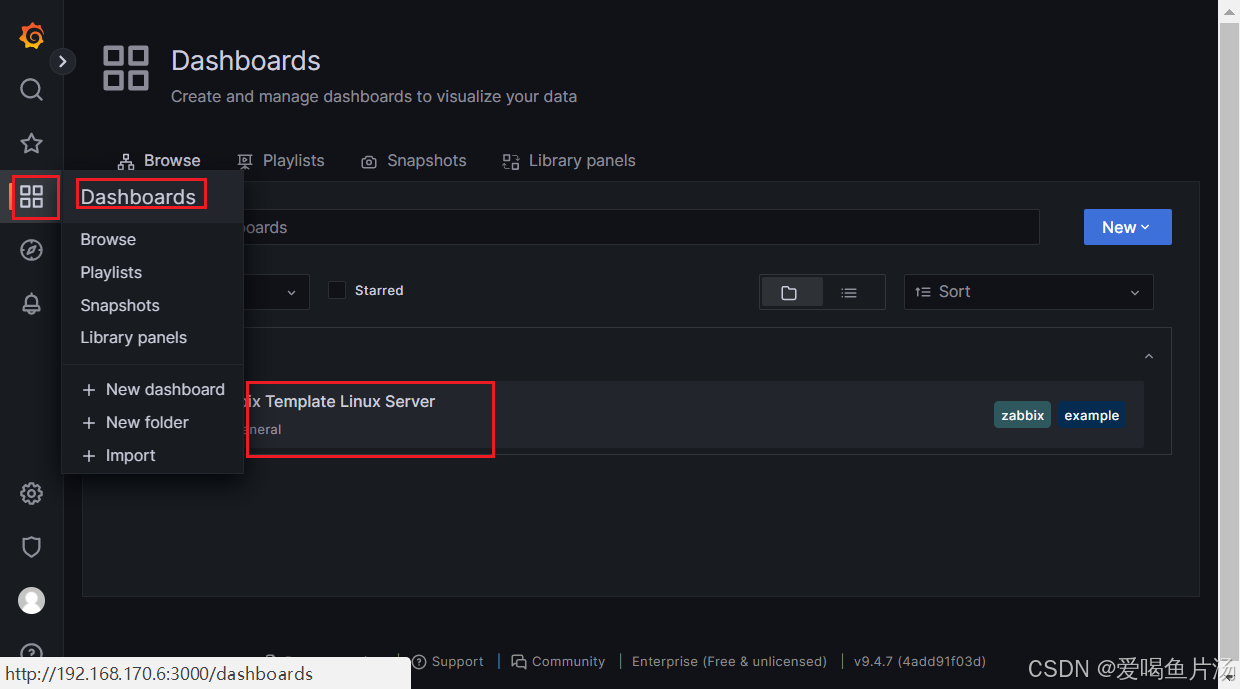
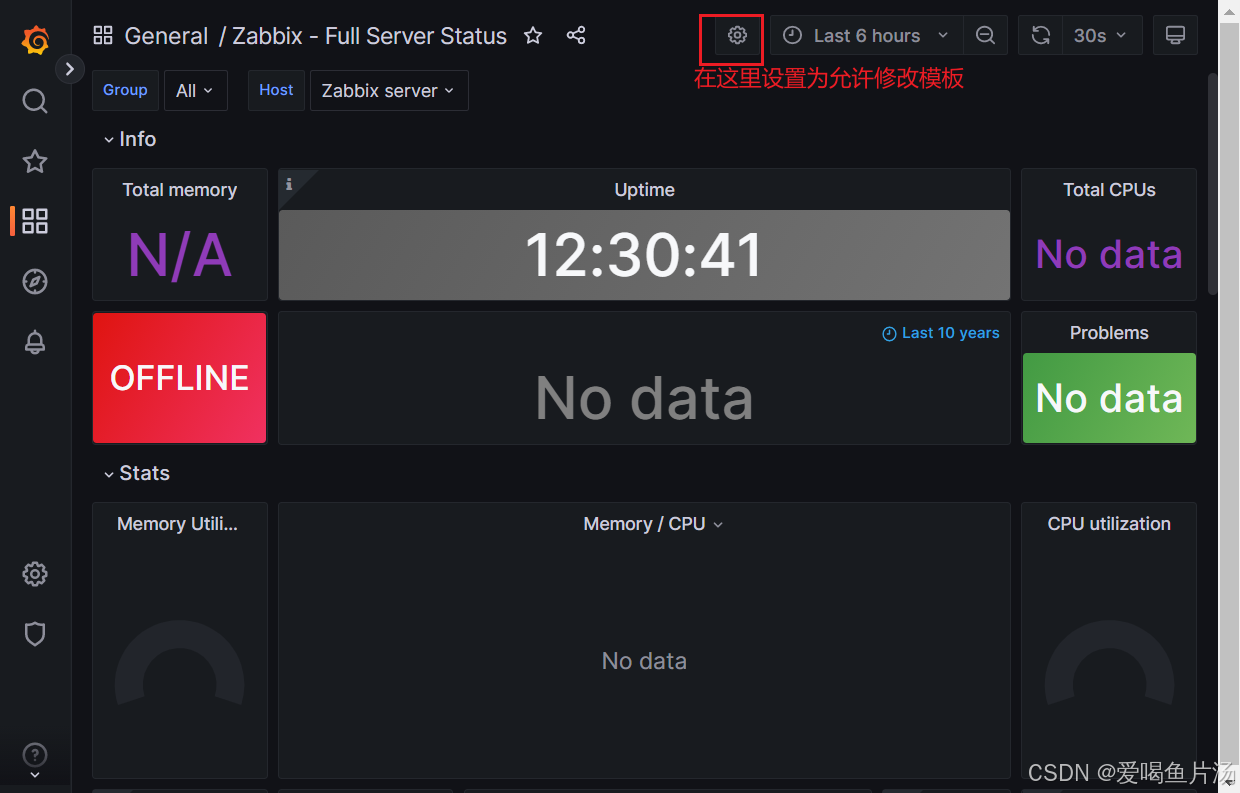
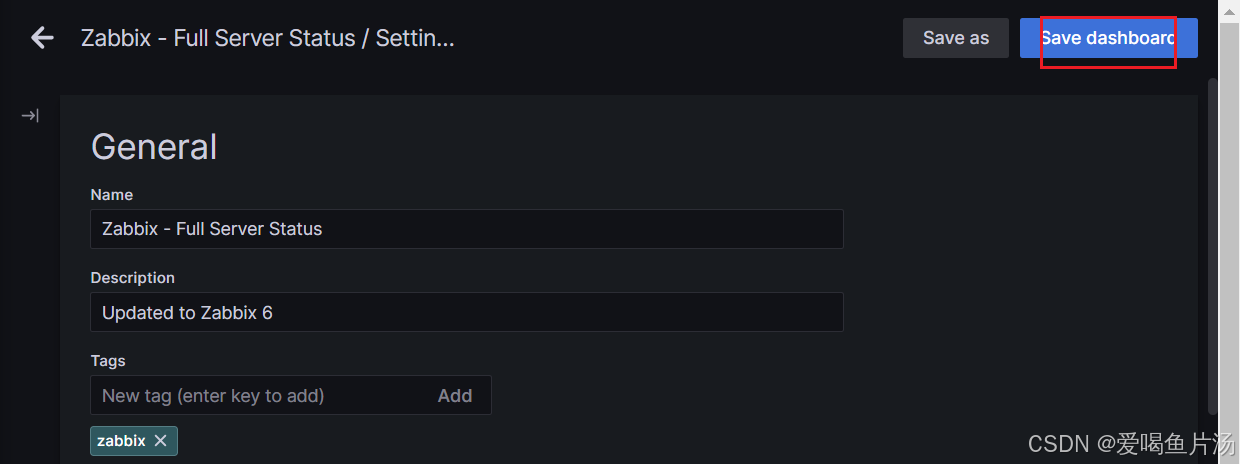
调试模板


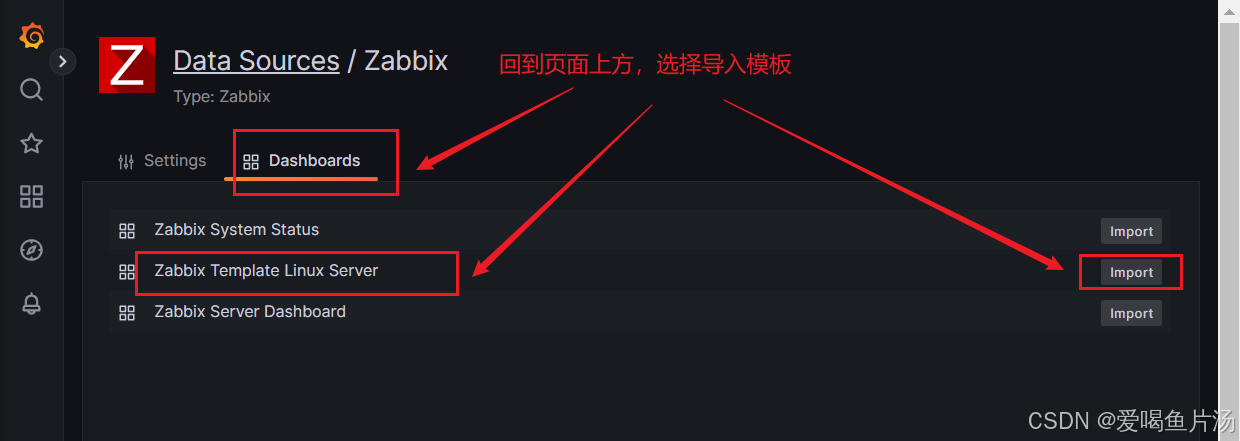
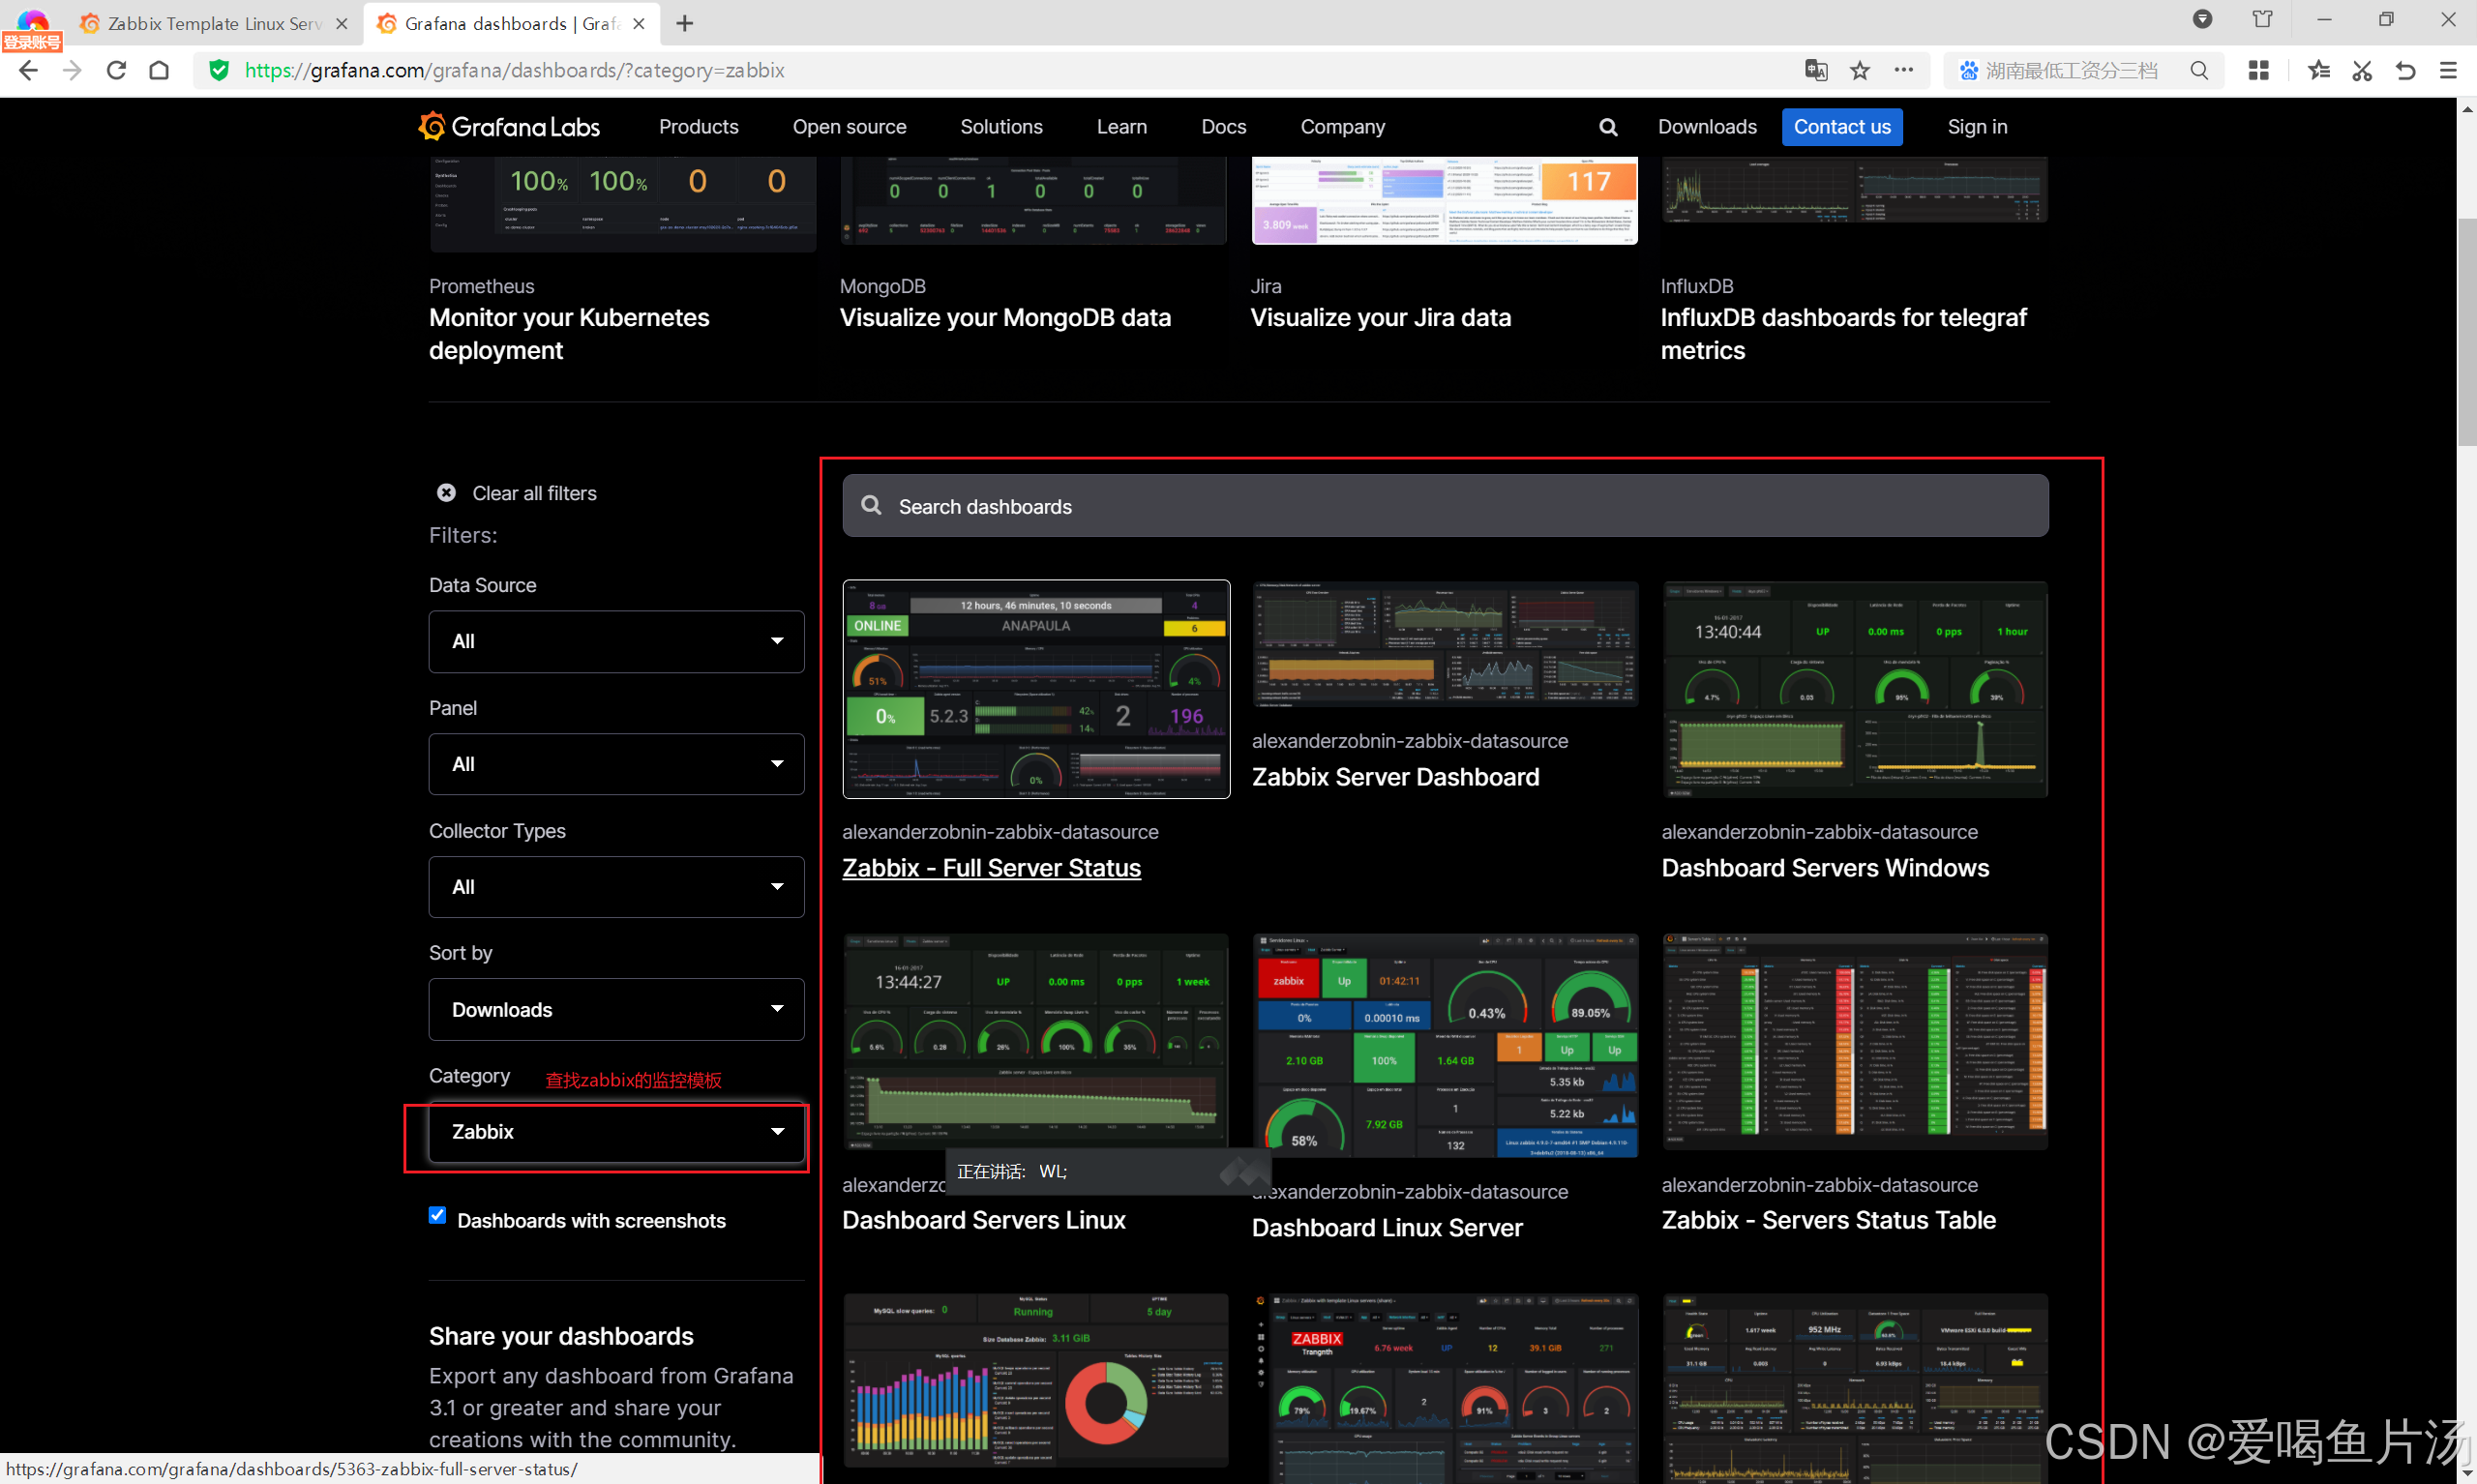
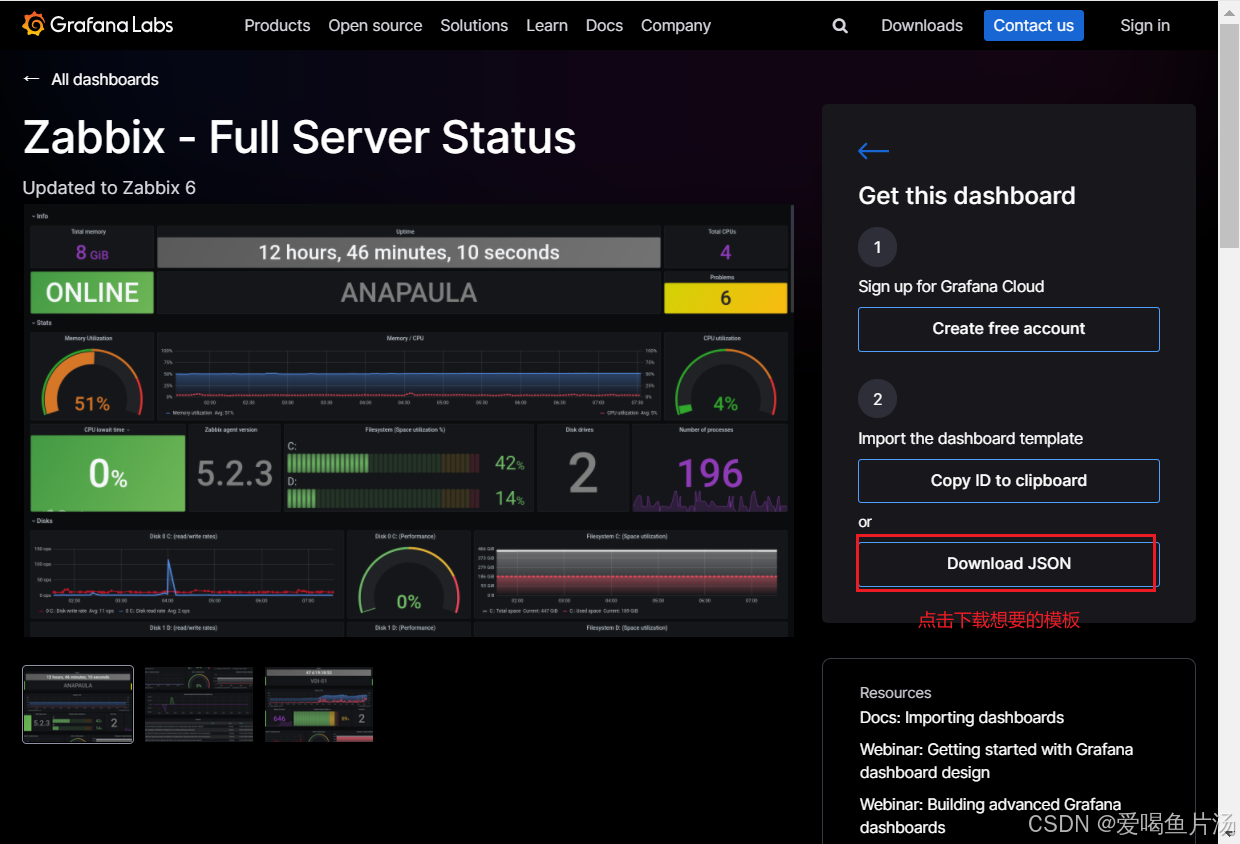
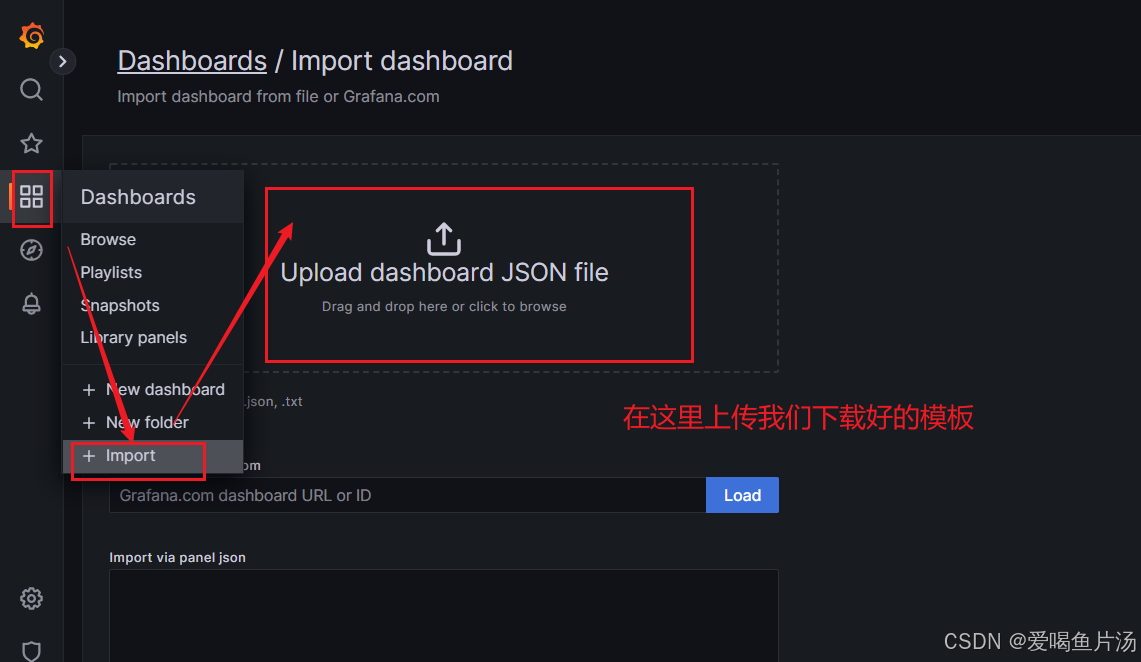
5、如何导入模板?
https://grafana.com/dashboards 可登录该网站进行
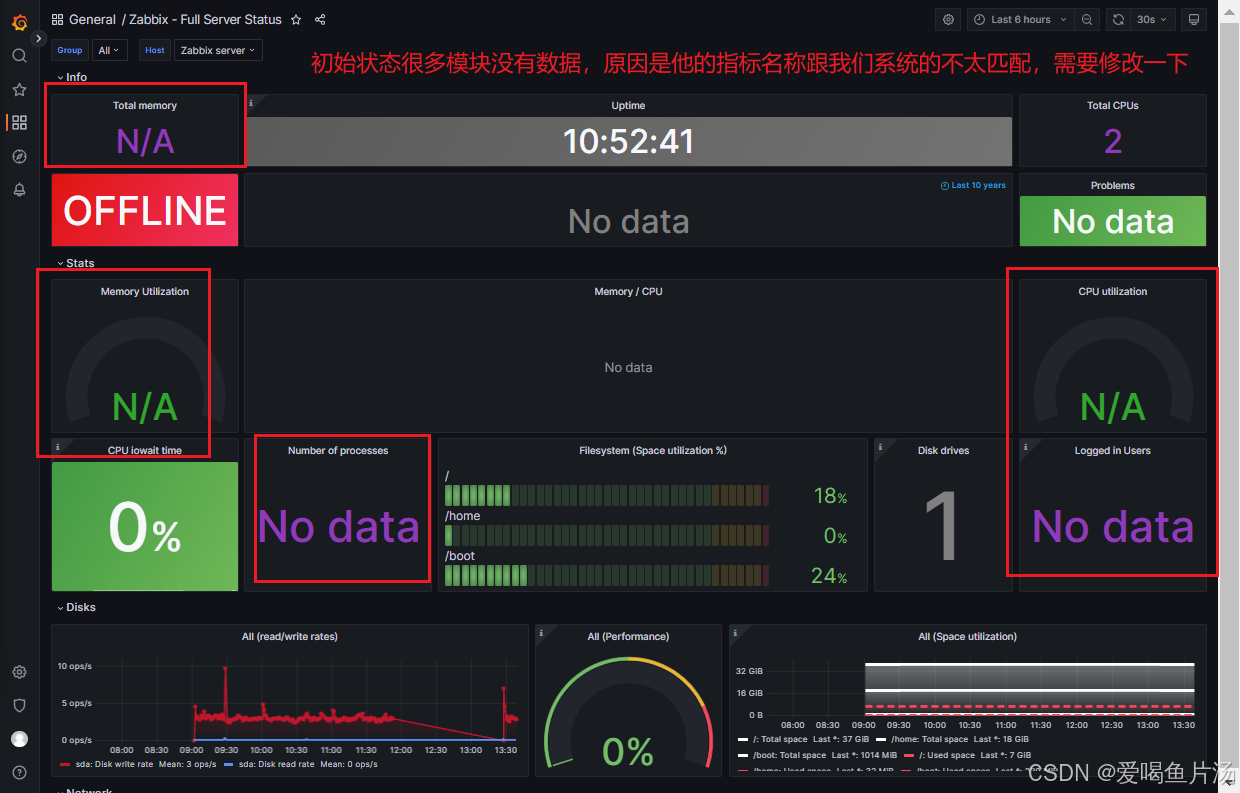
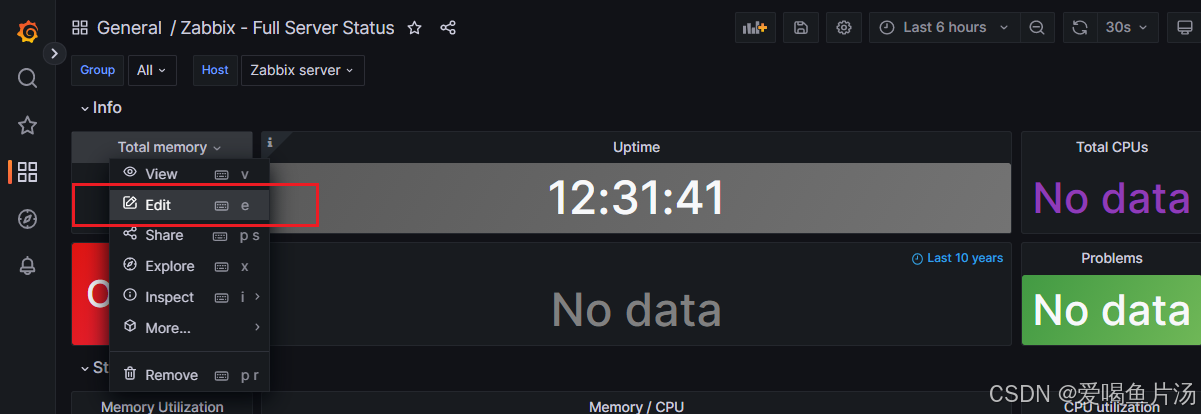
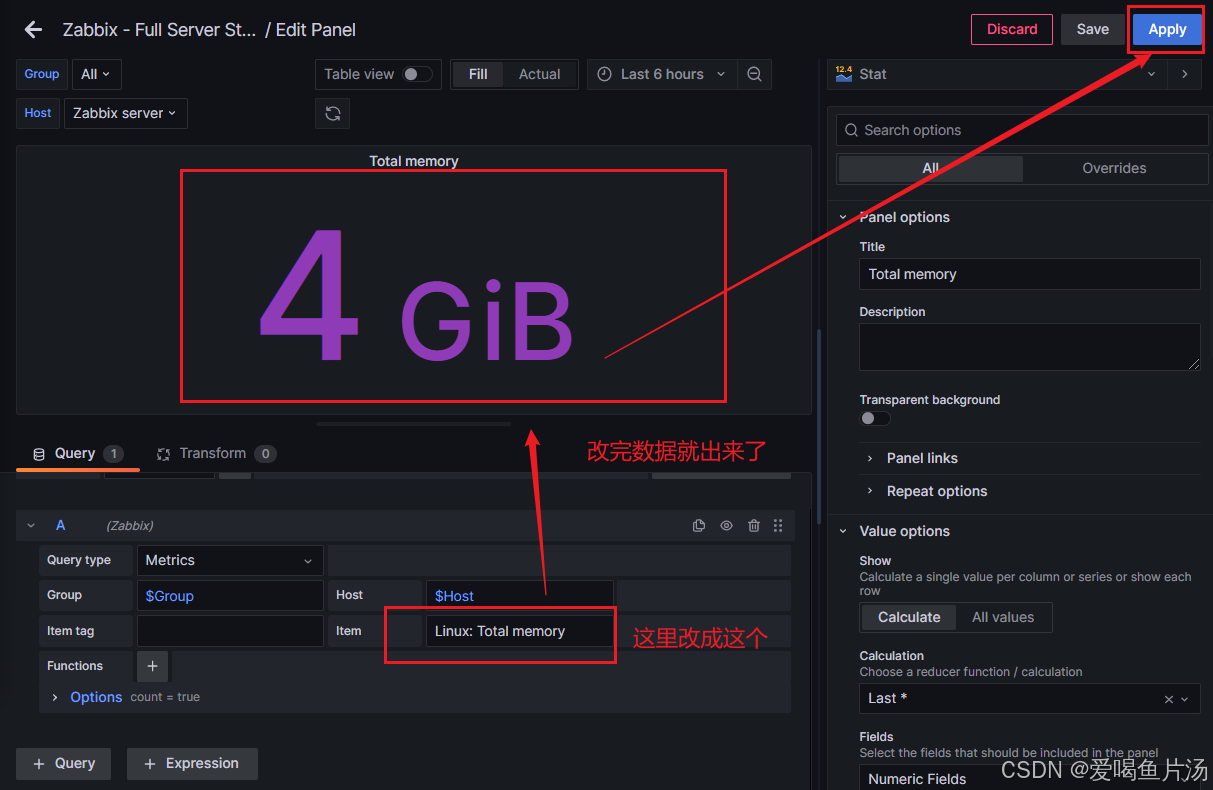
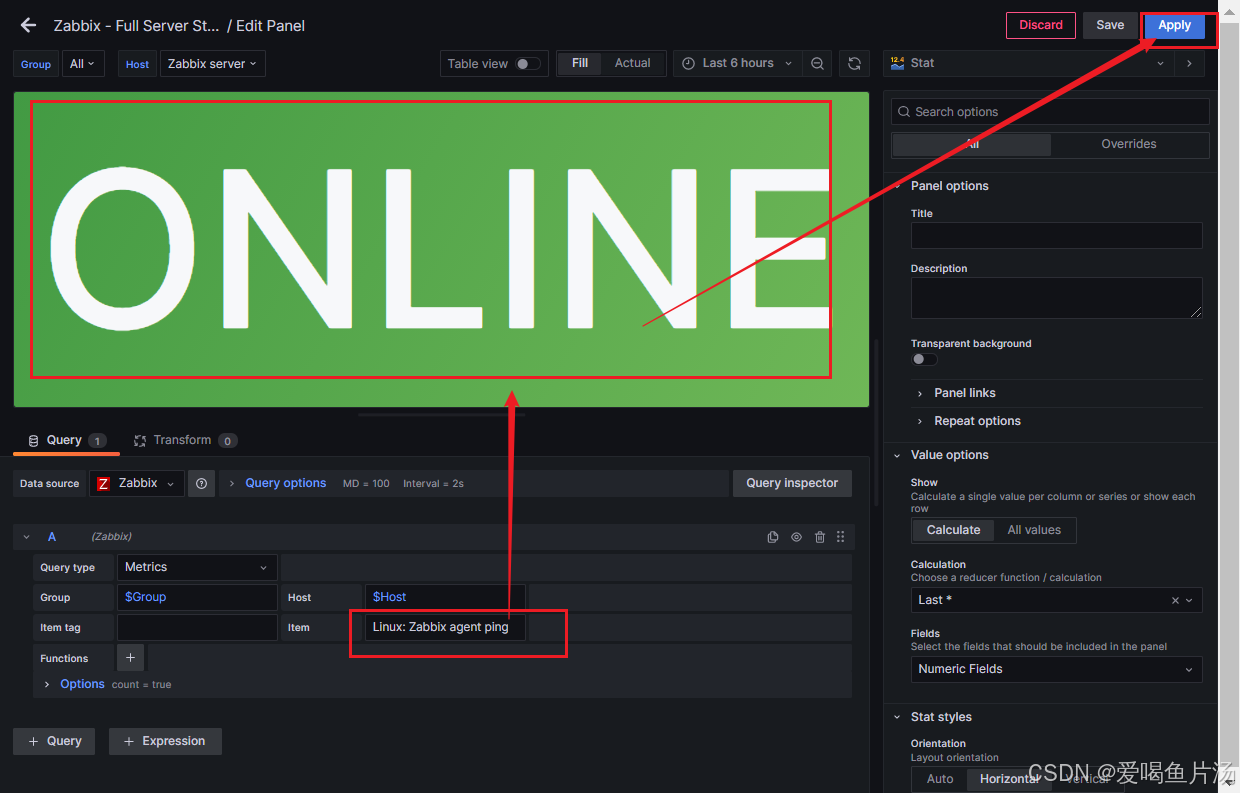
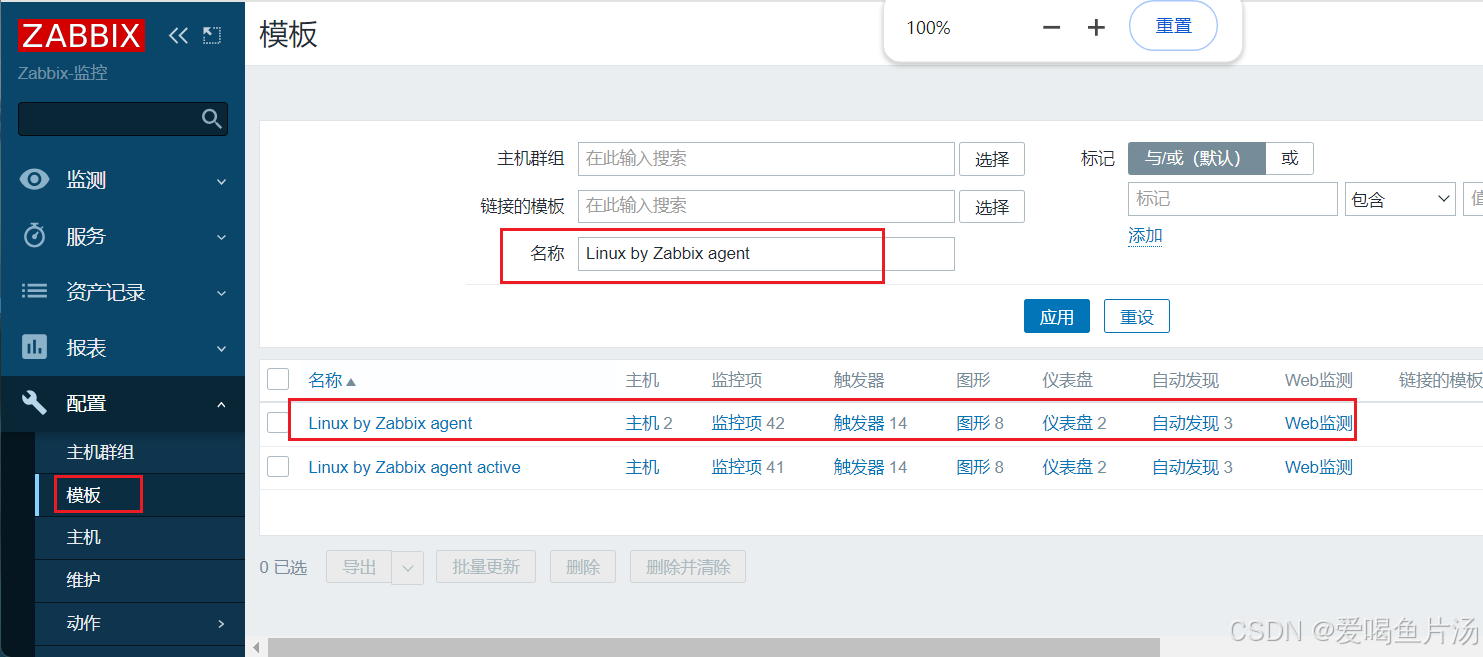
创建监控项,举例监控cpu总数
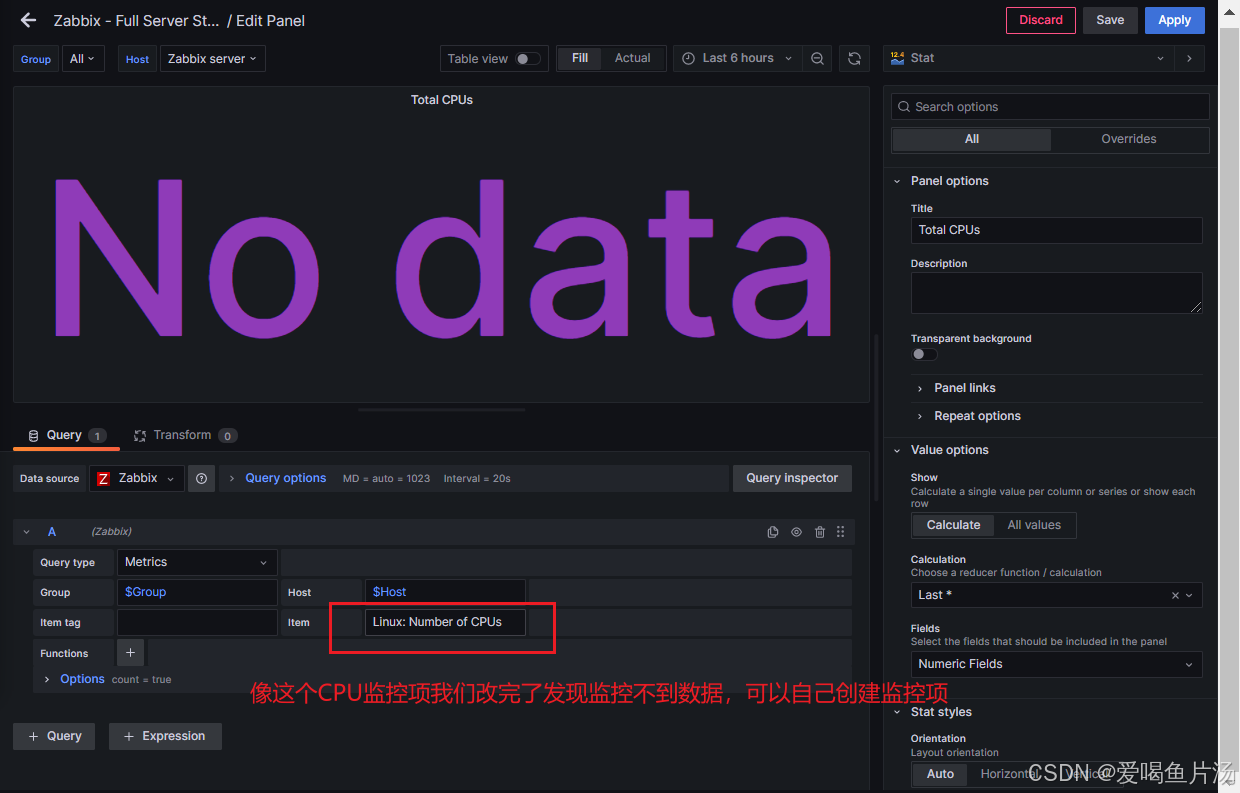
total cpus
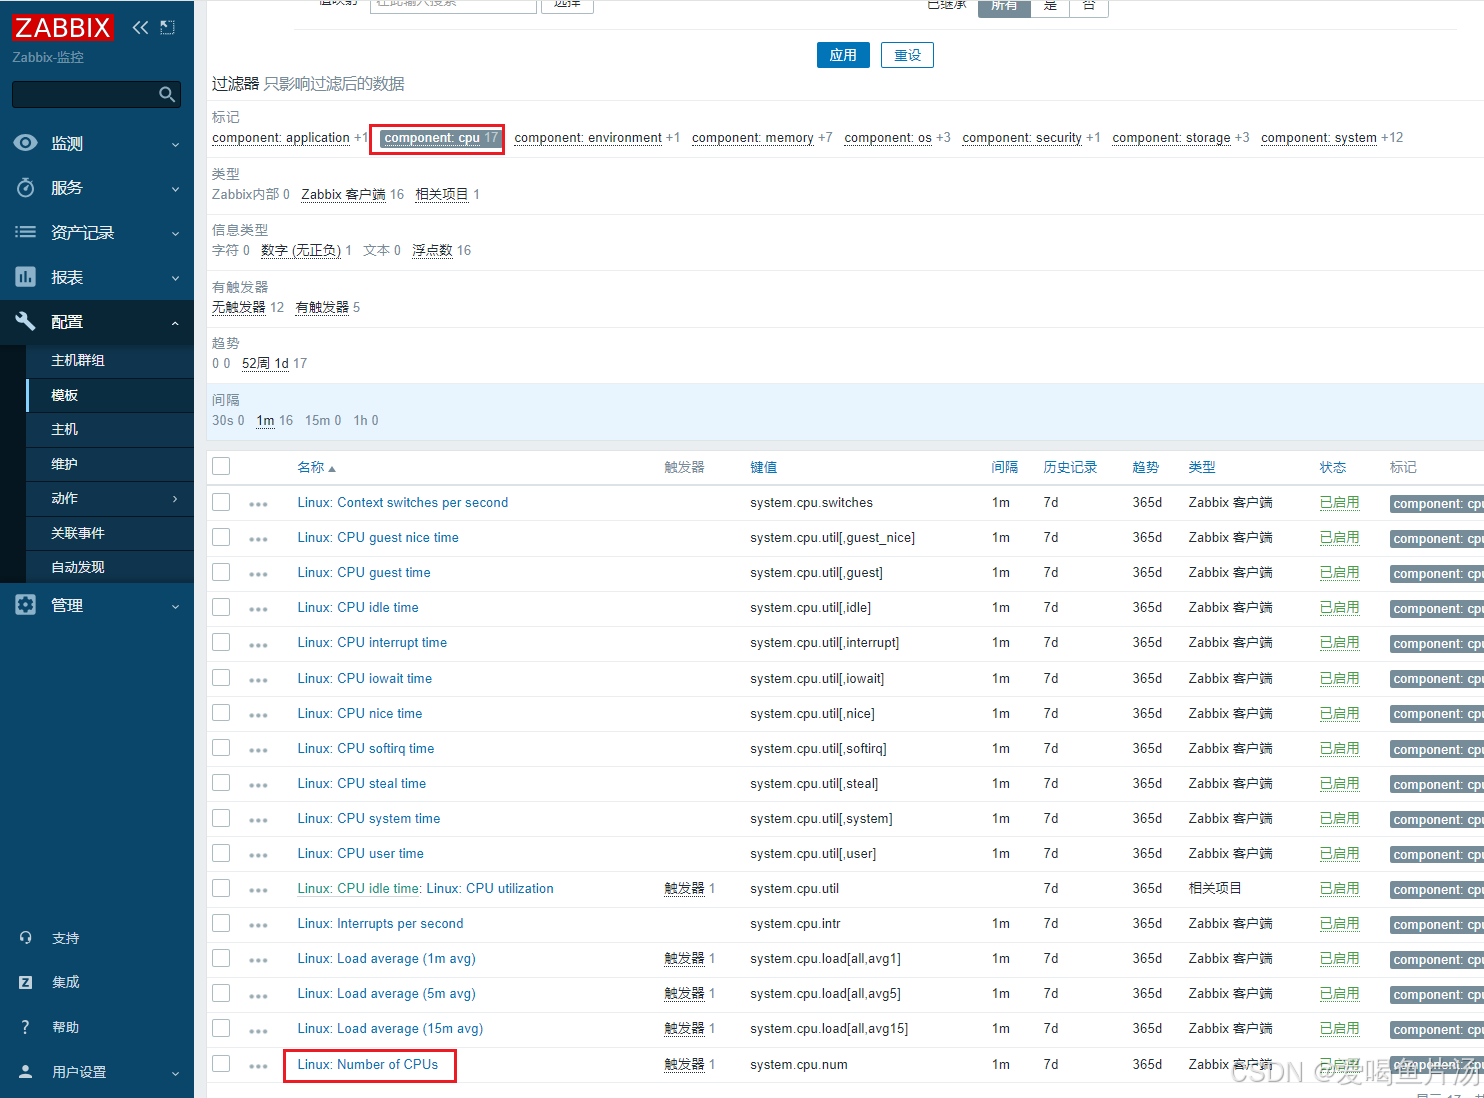
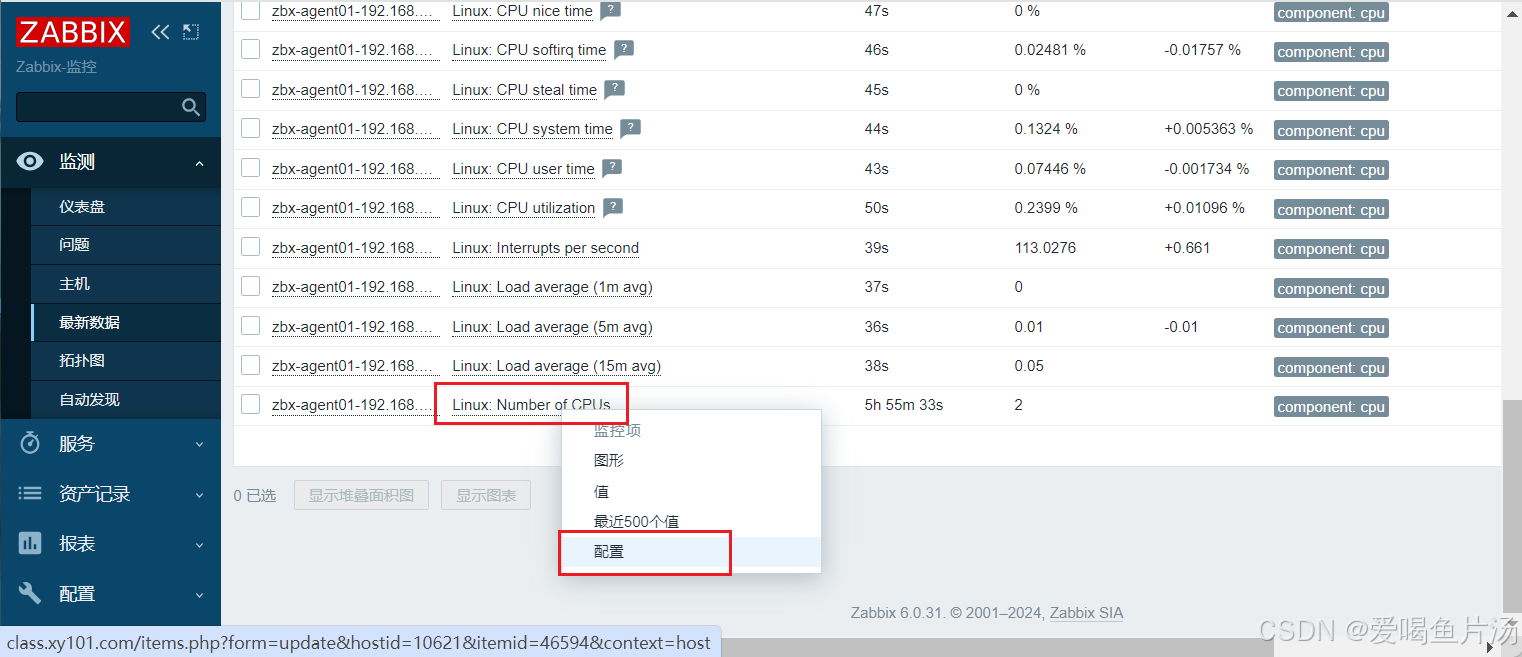
左侧【配置】点击【模板】找到【Linux by Zabbix agent】进入;点击上方【监控项】找到【Linux: Number of CPUs】进入;点击上方【预处理】,点击移除然后更新。
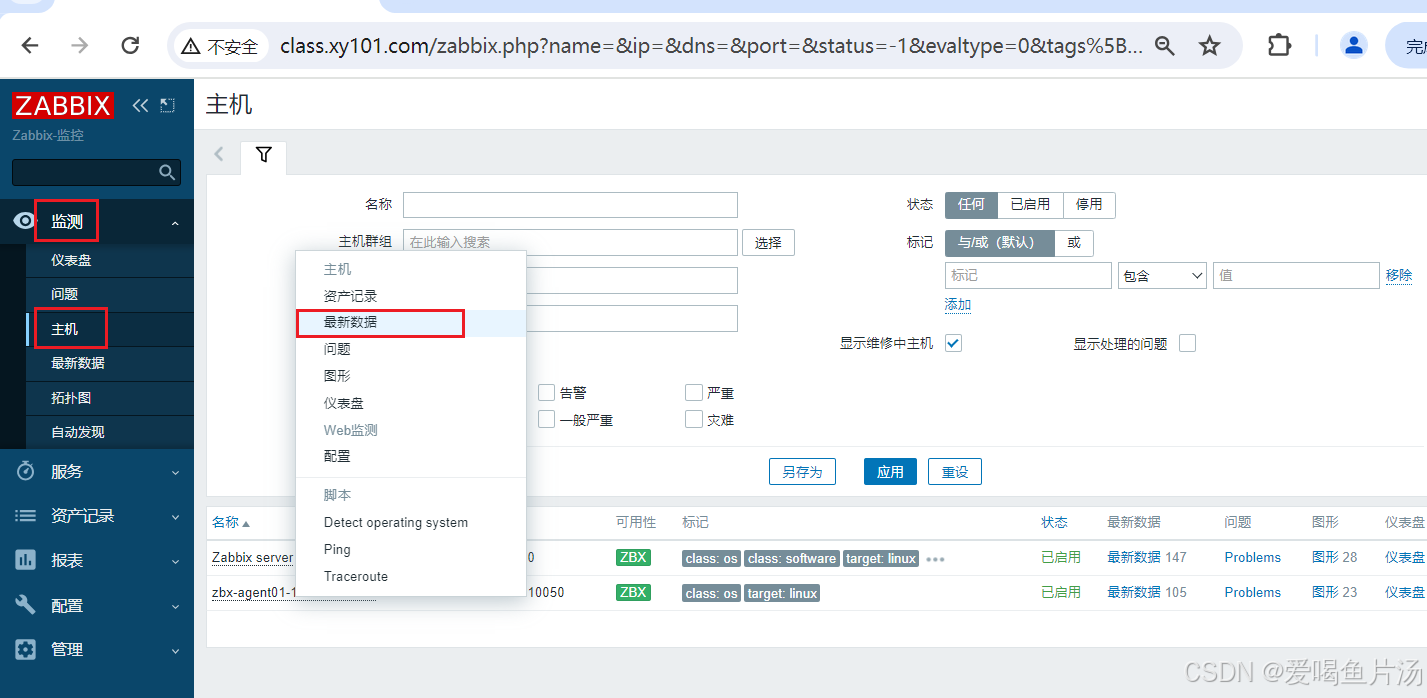
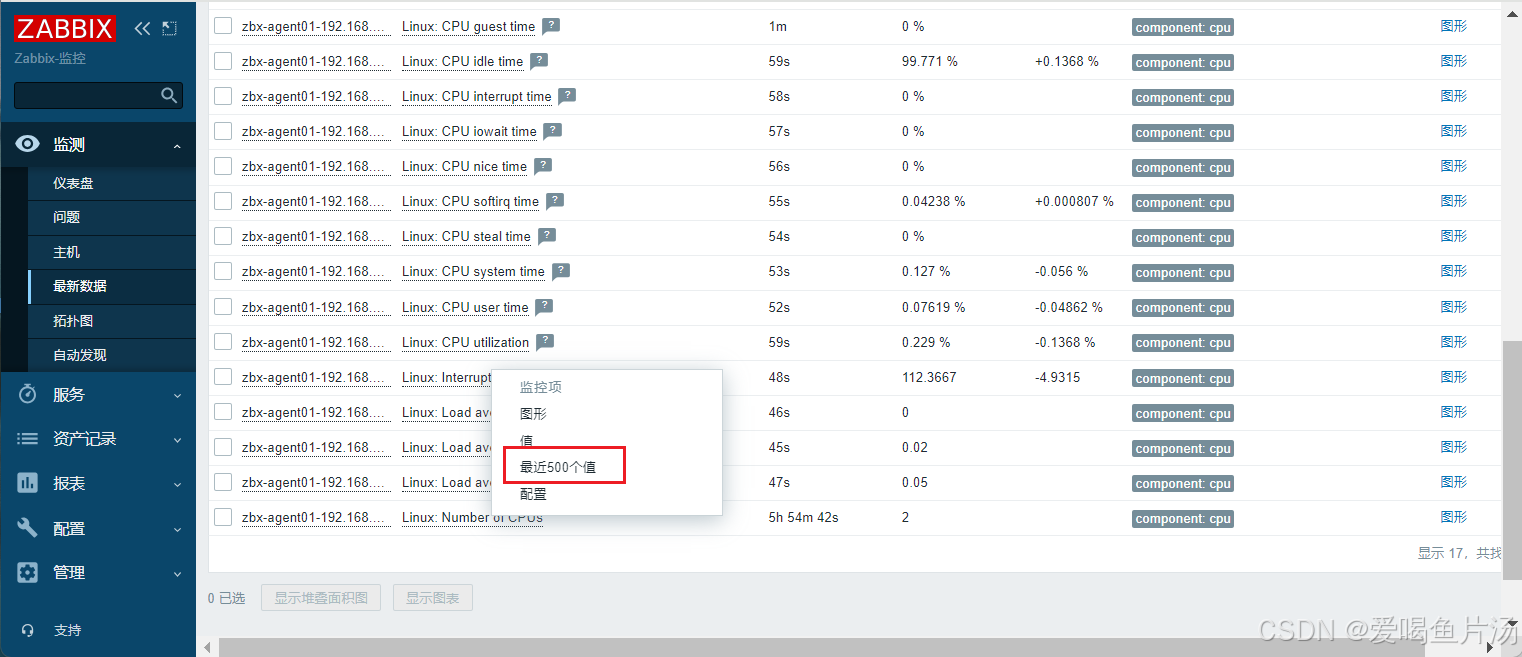
左侧【配置】点击【主机】点击agent01服务器后的监控项找到【Linux by Zabbix agent: Linux: Number of CPUs】点击测试,立即执行
首先明确命令,统计cpu数量的命令


逐一修改

如何用zabbix监控应用程序的相关指标?比如nginx并发量、连接数
确保nginx开启了状态统计模块--with-http_stub_status
nginx -V
修改配置文件
vim /etc/nginx/conf.d/default.conf
添加一个location
location /nginx_state {
    stub_status on;
    access_log off;
}
systemctl reload nginx

可使用此命令查看并发量信息
curl -s http://192.168.170.200/nginx_state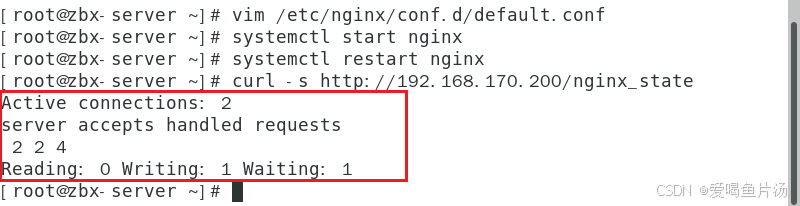
创建脚本
bash
cd /etc/zabbix/zabbix_agent2.d/
vim nginx_status.sh
=======================================================================
#!/bin/bash
IP=192.168.170.200
PORT=80
STUB_URI=nginx_state

active() {
    curl -s http://$IP:$PORT/$STUB_URI | awk 'NR==1 {print $3}'
}

accepts() {
    curl -s http://$IP:$PORT/$STUB_URI | awk 'NR==3 {print $1}'
}
handled() {
    curl -s http://$IP:$PORT/$STUB_URI | awk 'NR==3 {print $2}'
}

requests() {
    curl -s http://$IP:$PORT/$STUB_URI | awk 'NR==3 {print $3}'
}

Reading() {
    curl -s http://$IP:$PORT/$STUB_URI | awk 'NR==4 {print $2}'
}

Writing() {
    curl -s http://$IP:$PORT/$STUB_URI | awk 'NR==4 {print $4}'
}

Waiting() {
    curl -s http://$IP:$PORT/$STUB_URI | awk 'NR==4 {print $6}'
}

process() {
    pidof nginx | wc -w
}

case $1 in
active)
    active
    ;;
accepts)
    accepts
    ;;
handled)
    handled
    ;;
requests)
    requests
    ;;
Reading)
    Reading
    ;;
Writing)
    Writing
    ;;
Waiting)
    Waiting
    ;;
process)
    process
    ;;
*)
    echo "$Usage: $0 {active|accepts|handled|requests|Reading|Writing|Waiting|process}"
    exit 1
esac
exit 0
=======================================================================
chmod +x nginx_status.sh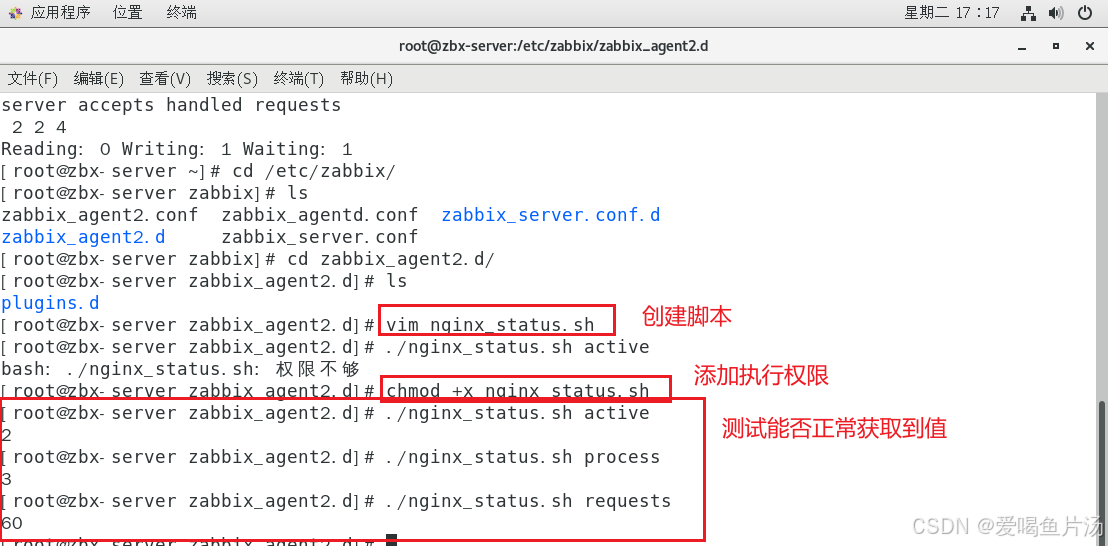
① 设置键值
bash
vim nginx_state.conf
UserParameter=nginx.status[*],/etc/zabbix/zabbix_agent2.d/nginx_status.sh $1
#键值中括号星号表示执行键后跟的参数会传给$1
systemctl restart zabbix-agent2.service
测试命令:
zabbix_get -s '127.0.0.1' -p 10050 -k 'nginx.status[active]'
zabbix_get -s '127.0.0.1' -p 10050 -k 'nginx.status[requests]'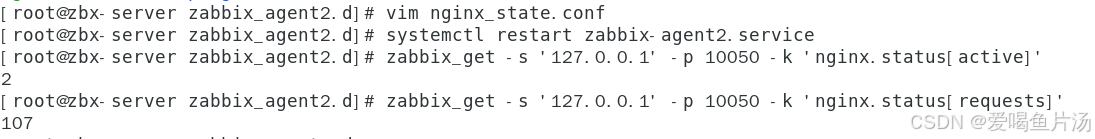
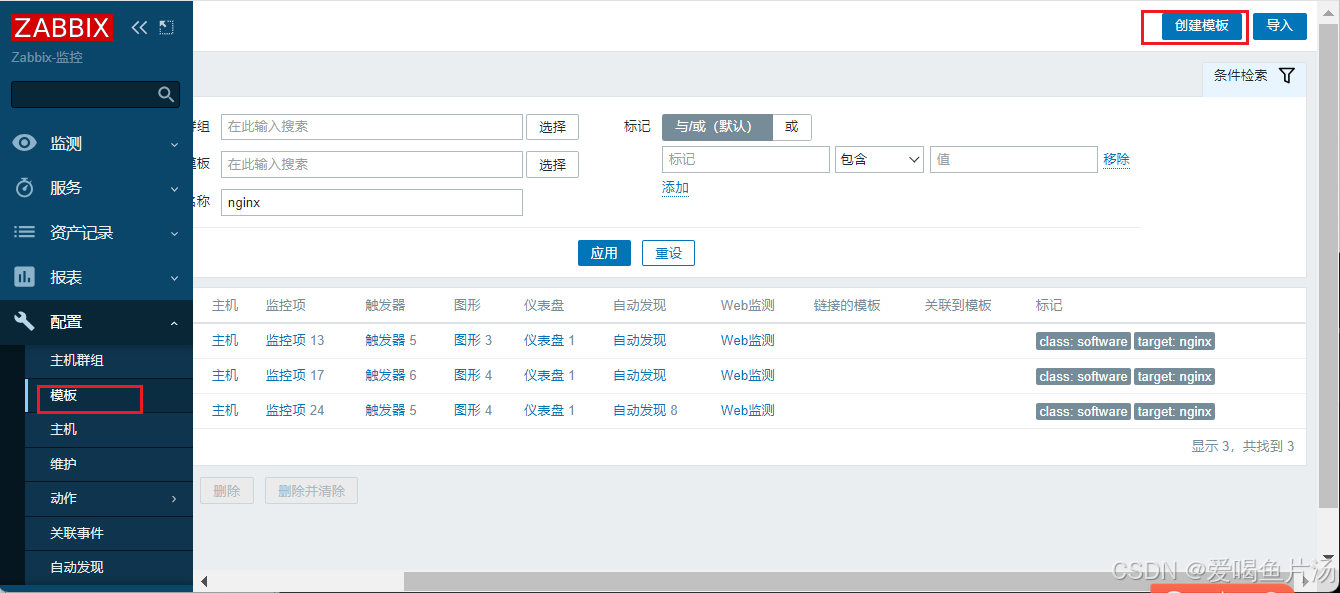
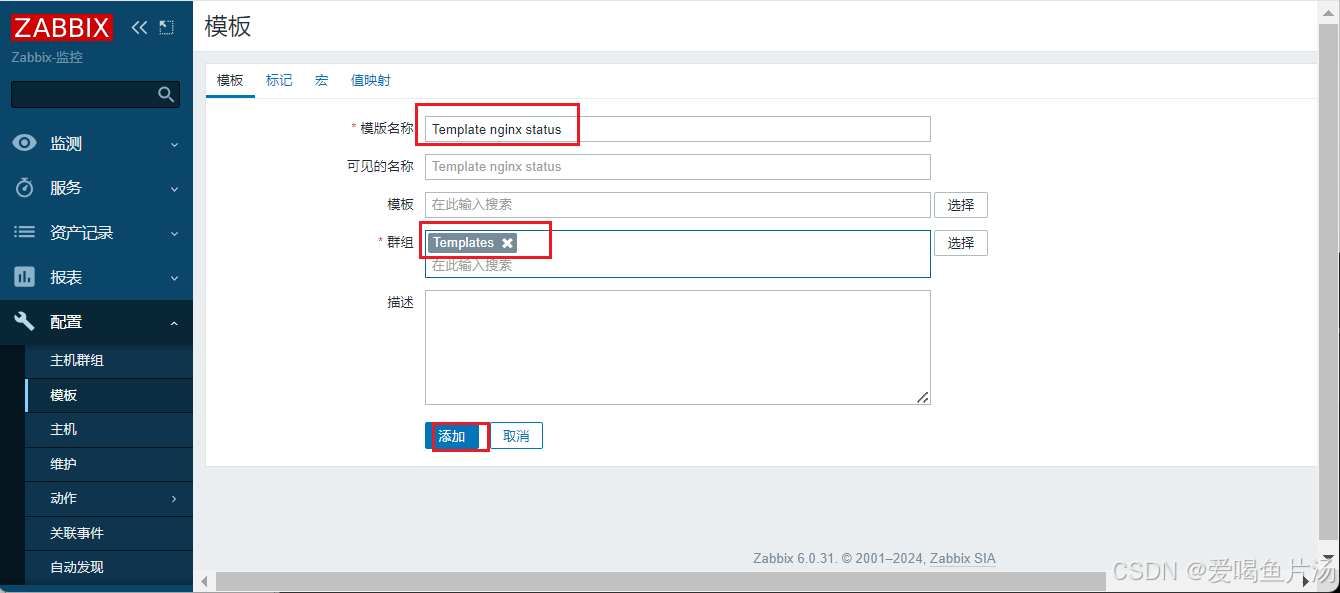
② 在zabbix web端完成自定义监控项
【配置】点击【模板】点击【创建模板】
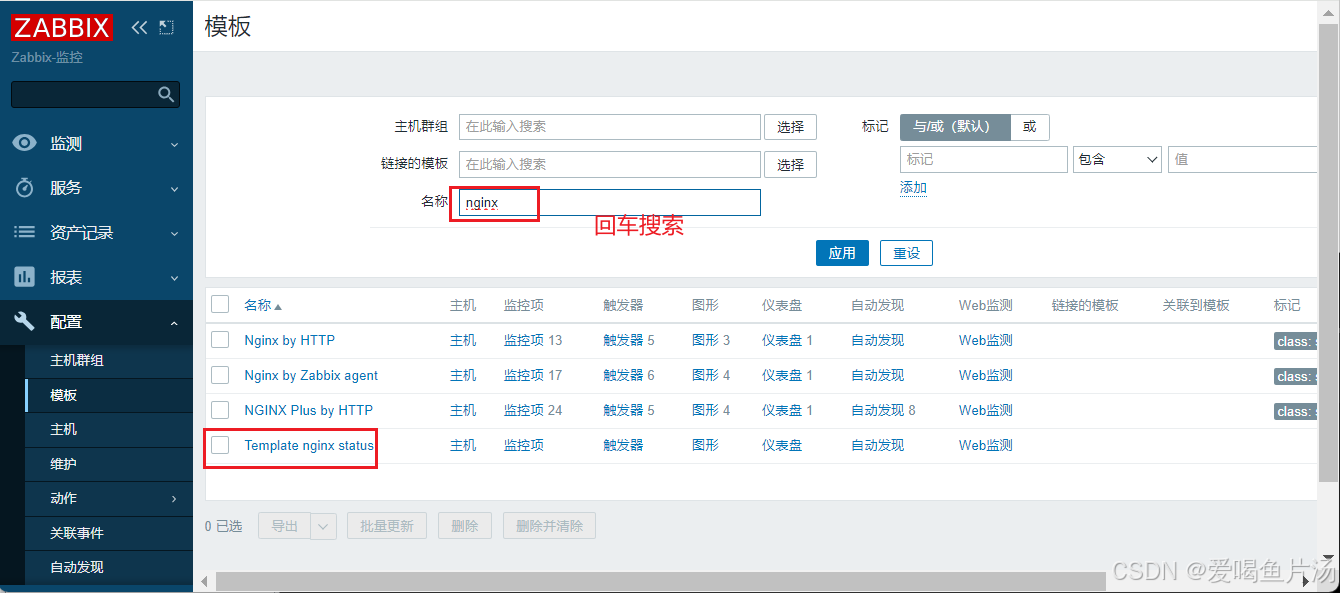
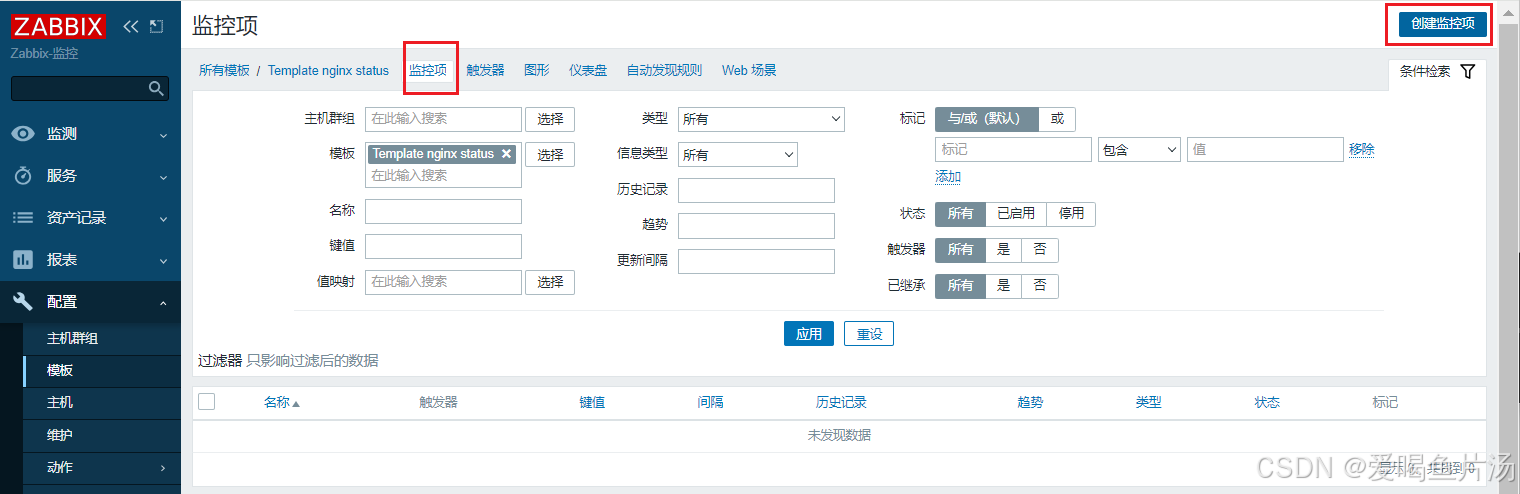
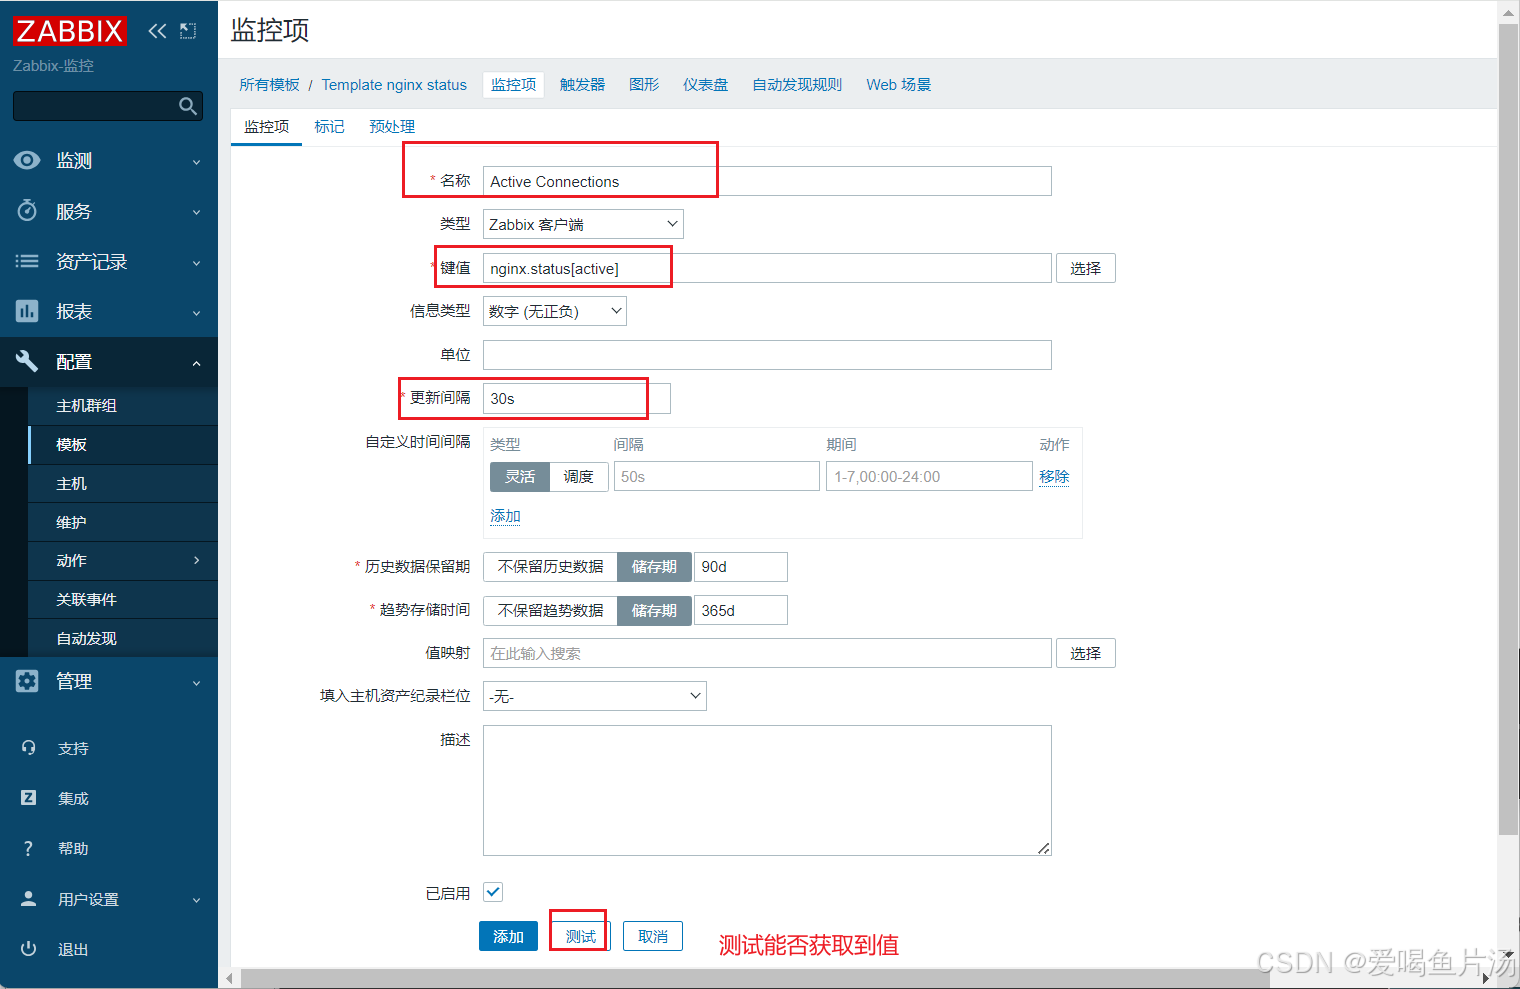
添加三个监控项:【名称】搜索【Template Nginx Status】创建的模板;点击上方【监控项】,点击创建【监控项】
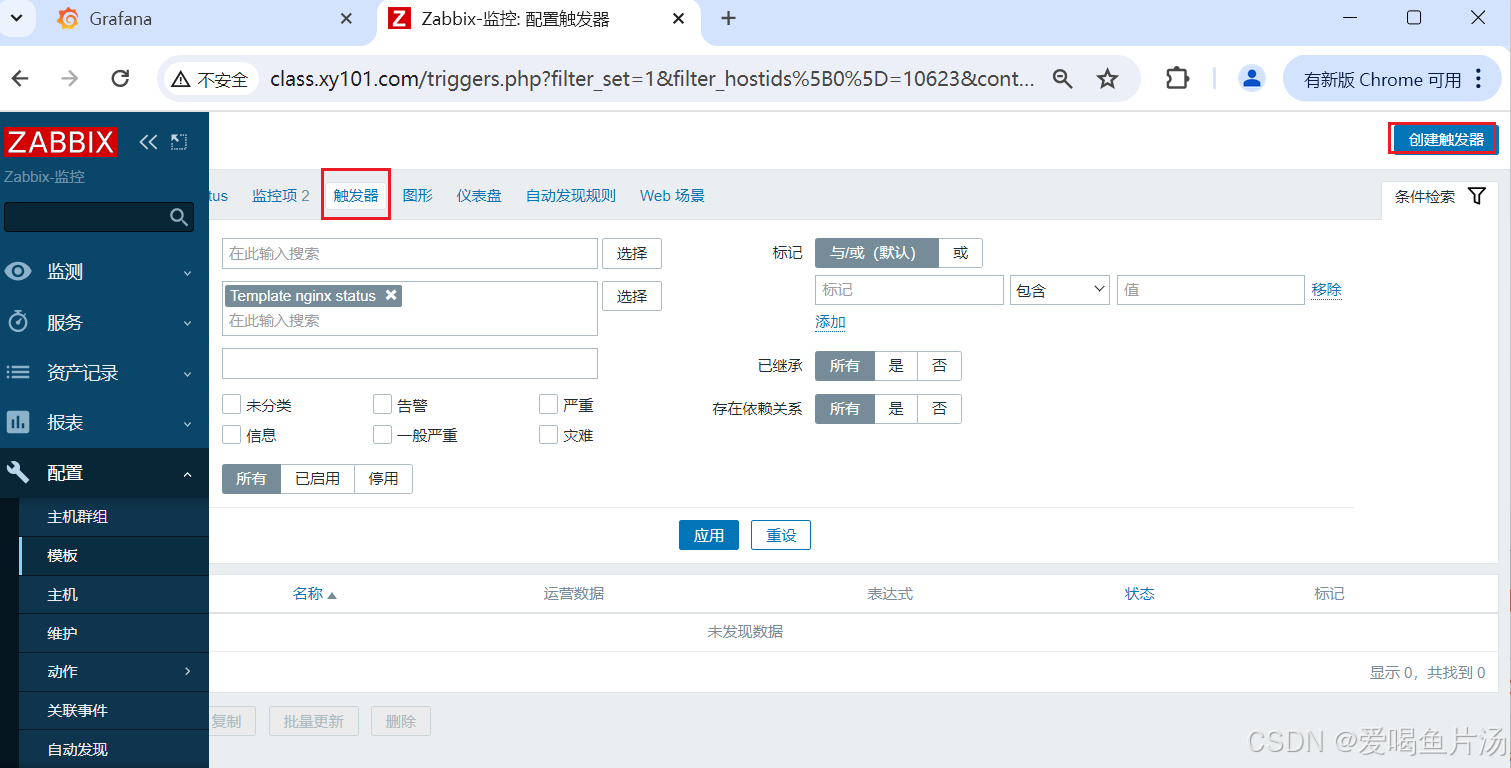
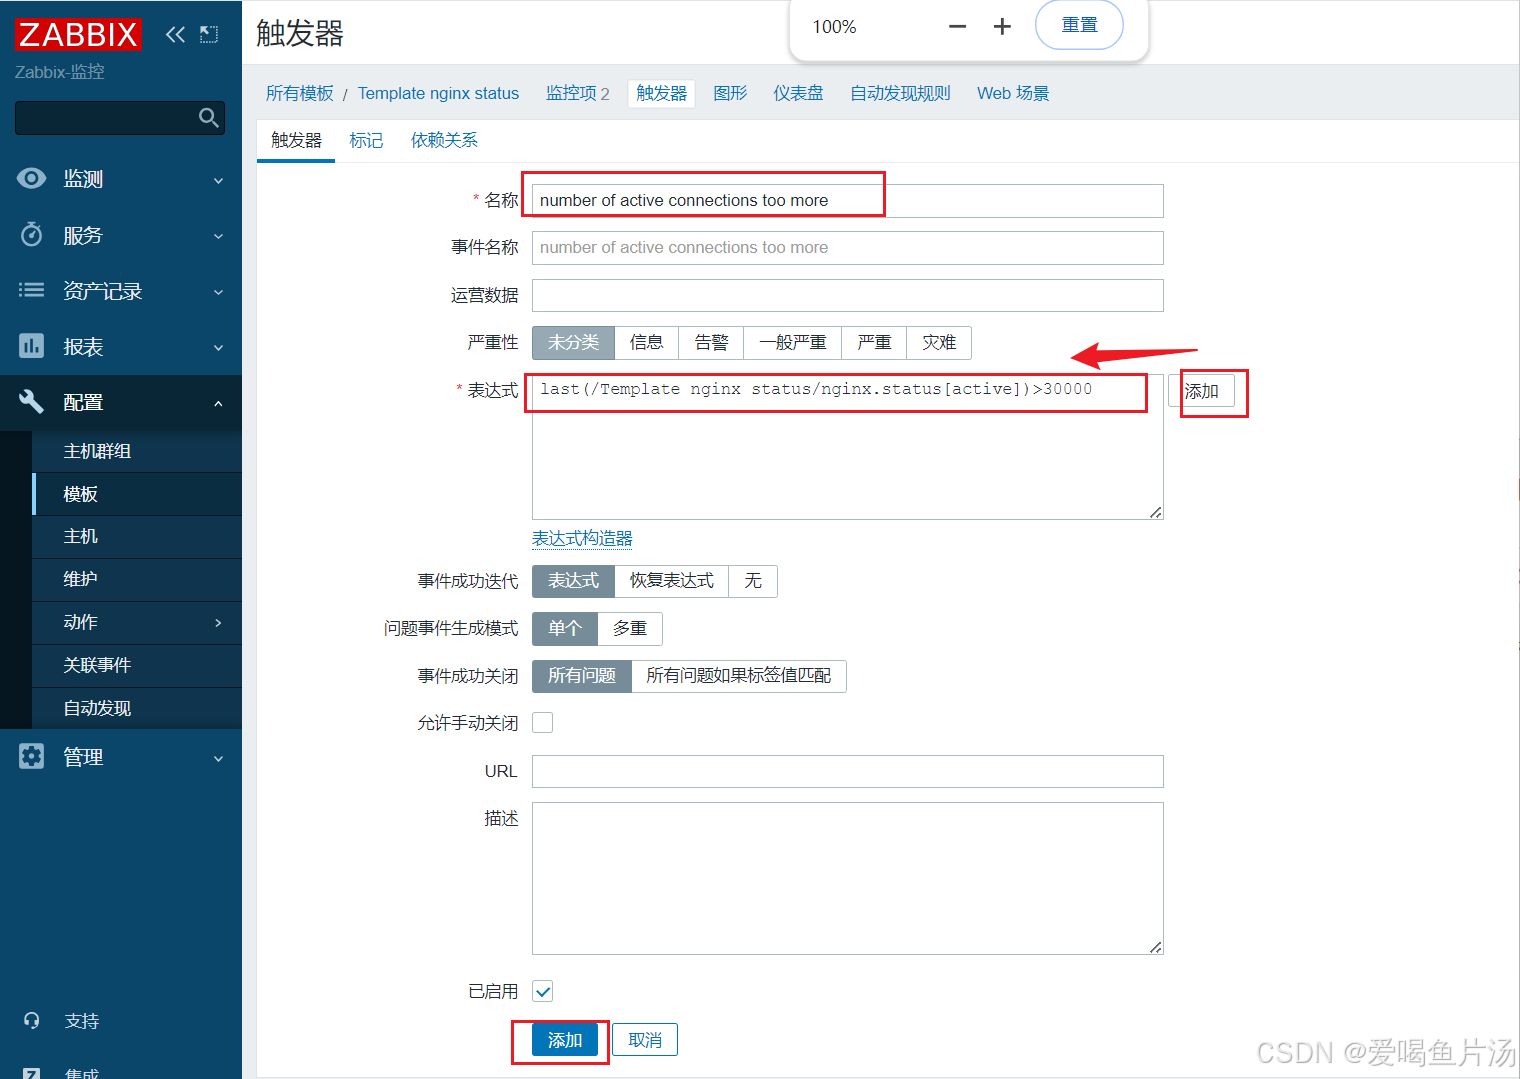
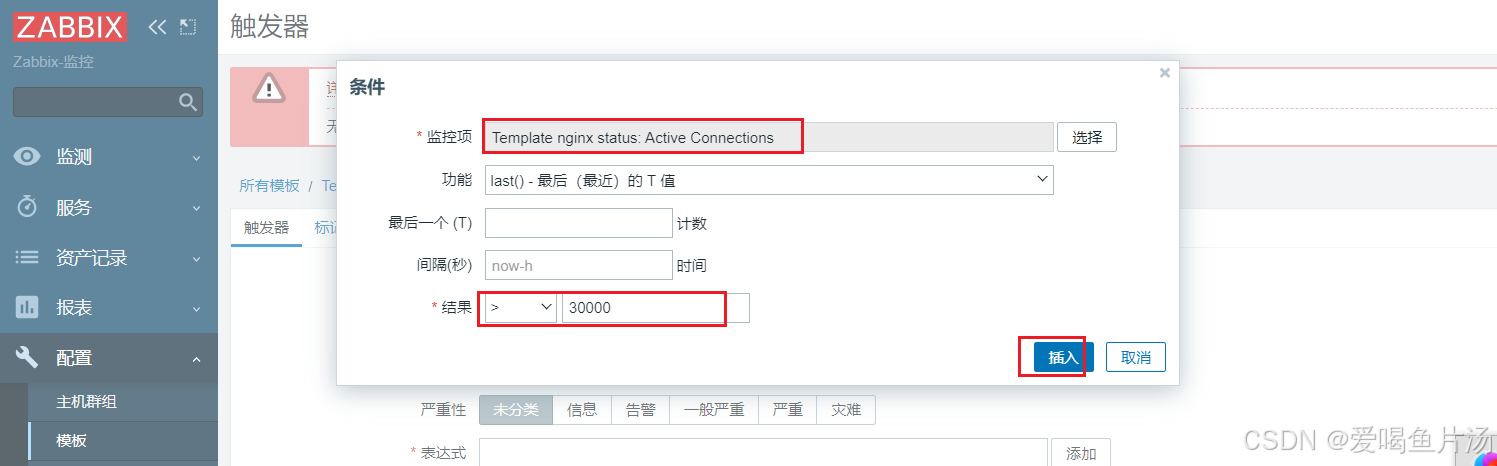
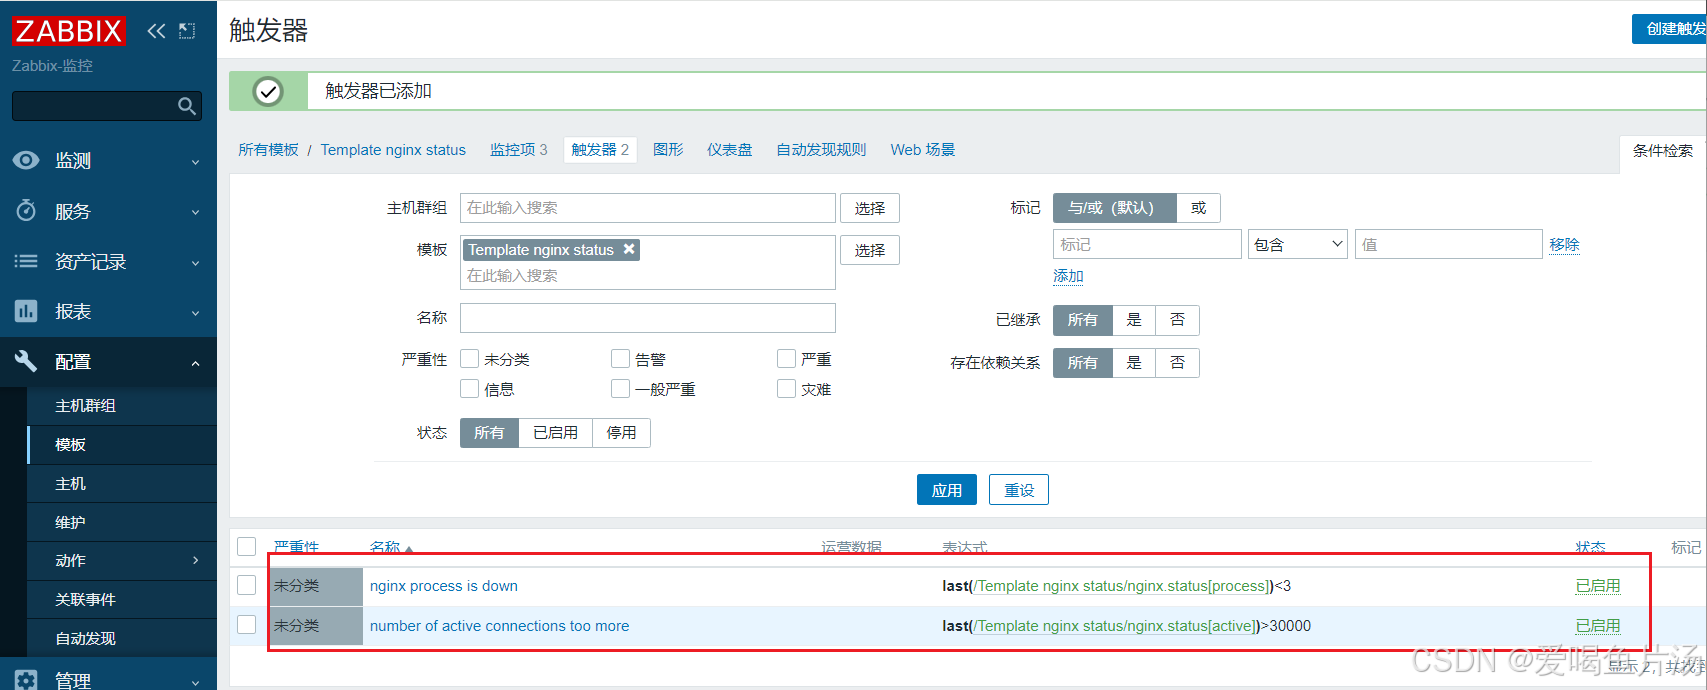
点击上方【触发器】点击【创建触发器】
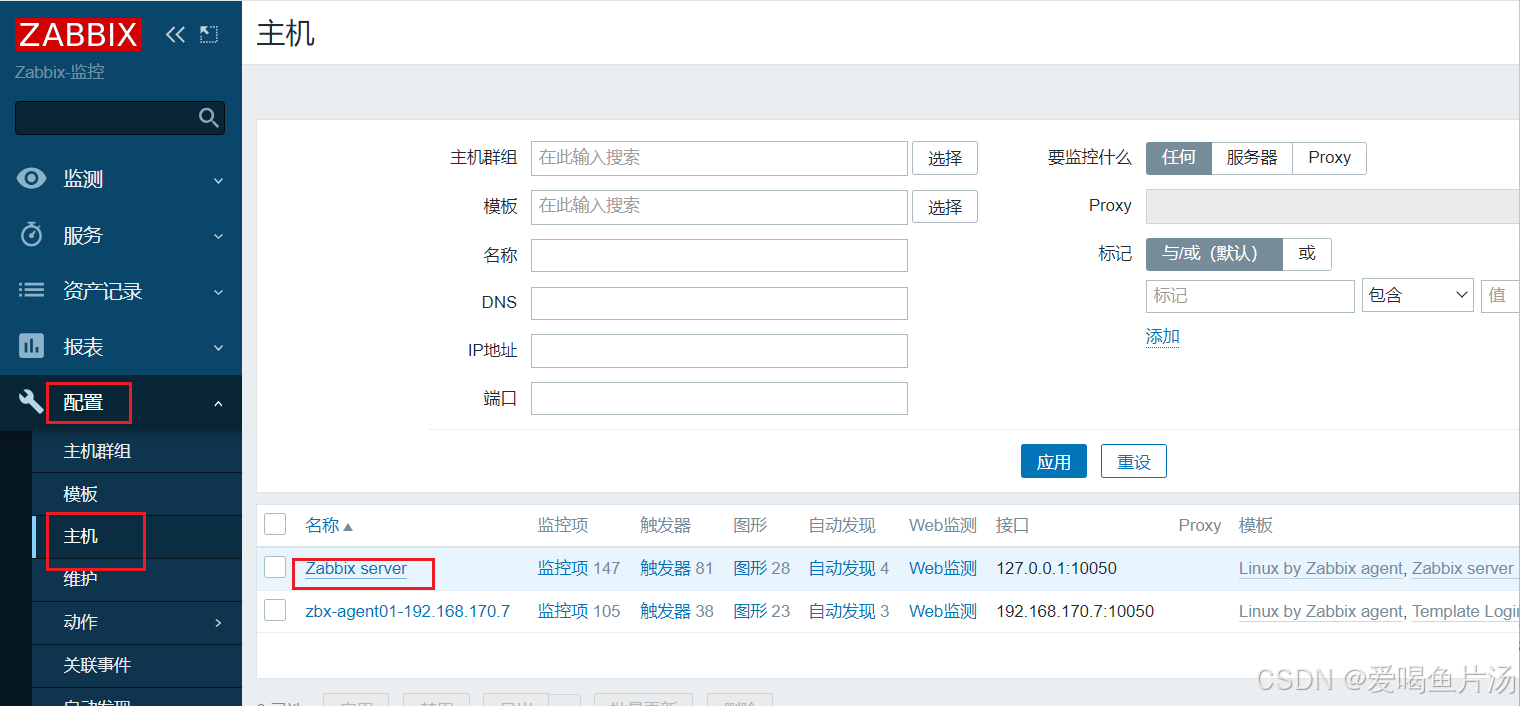
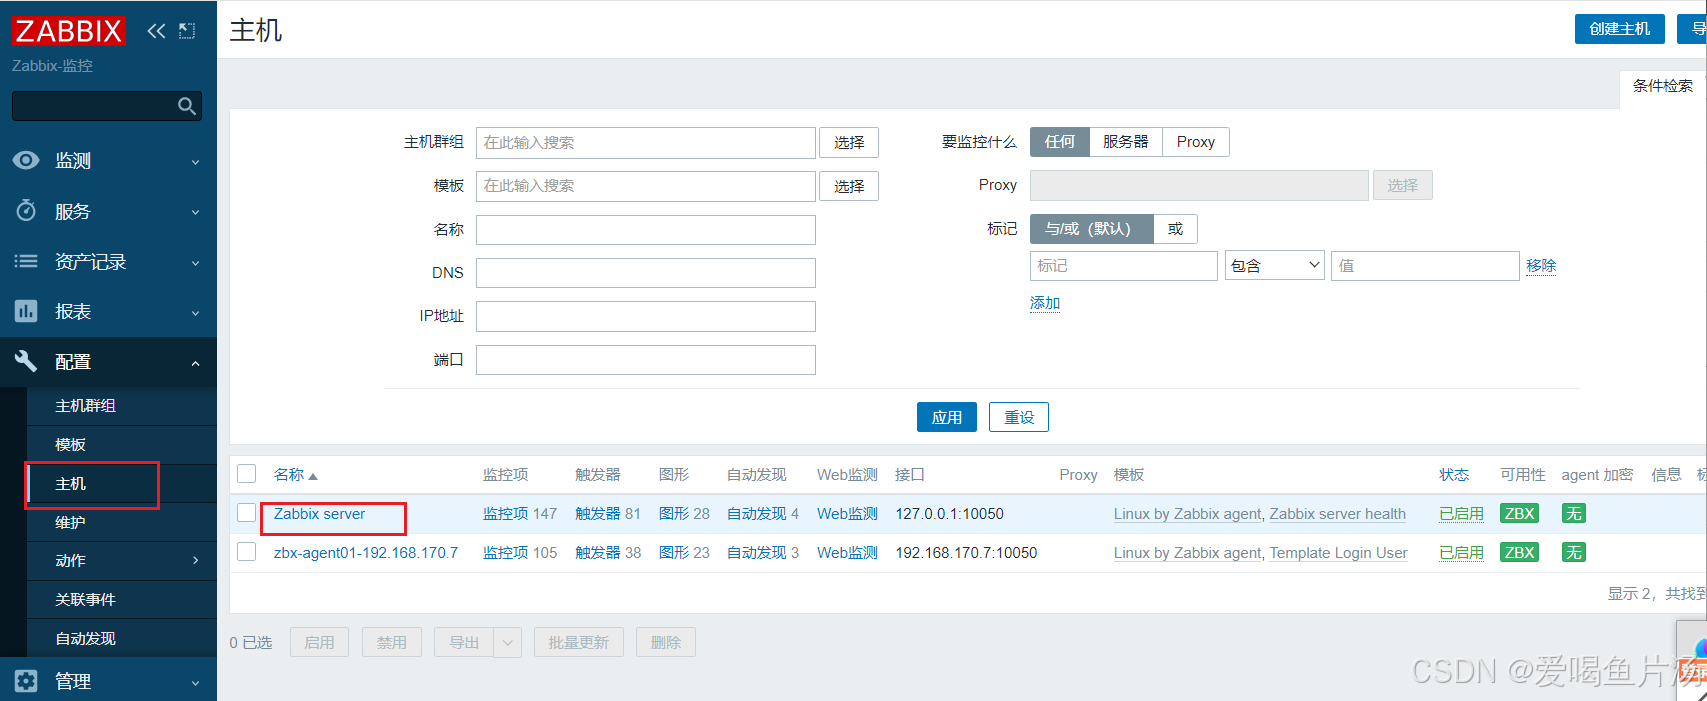
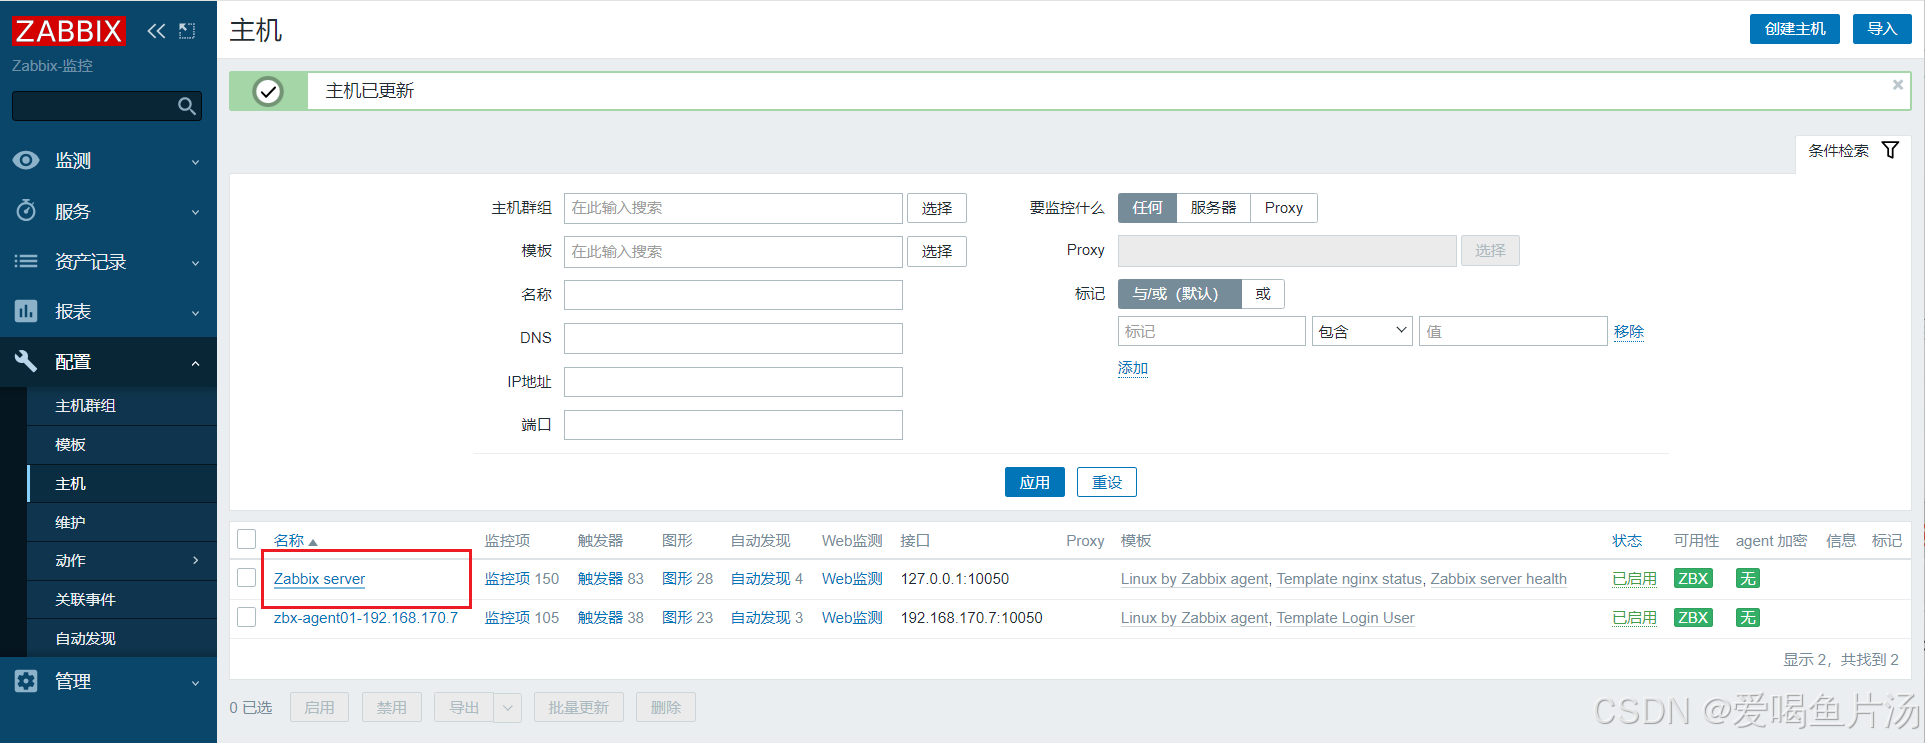
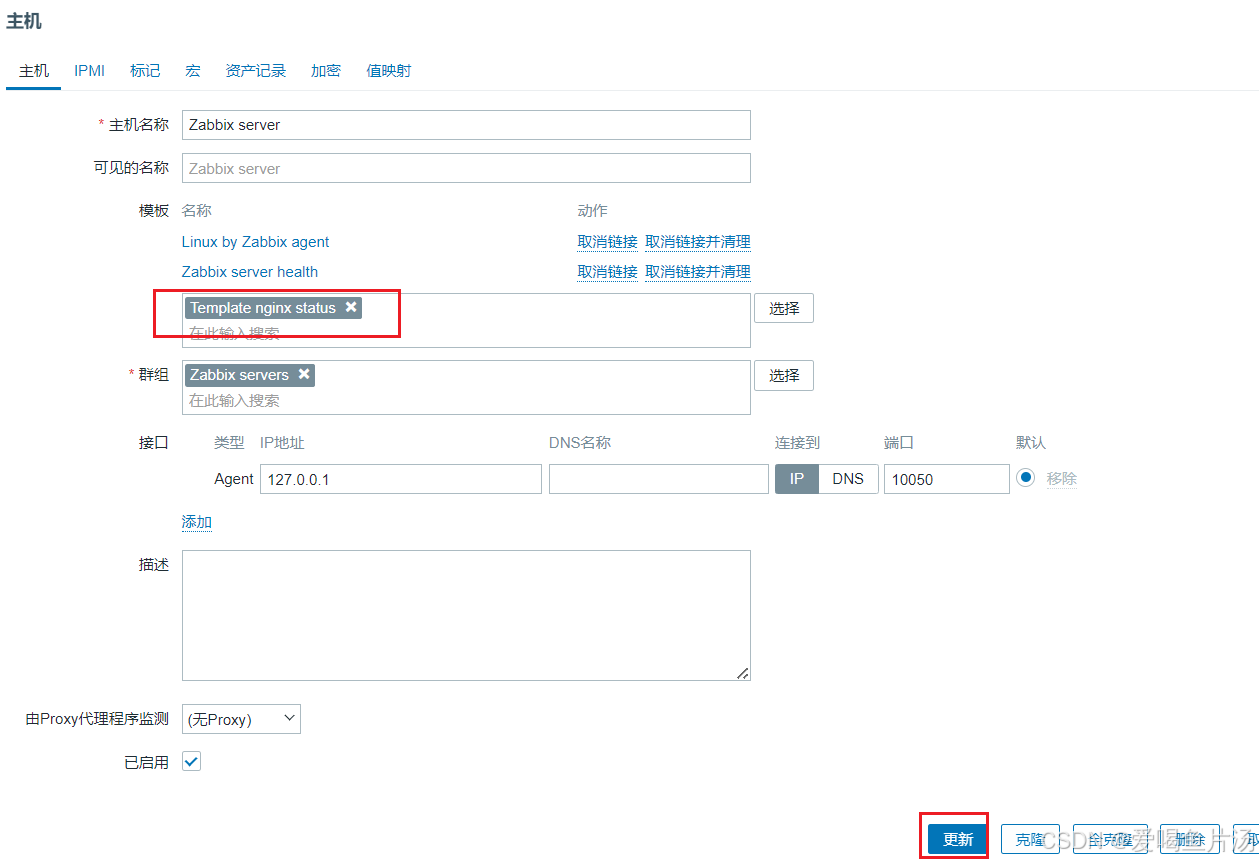
主机关联监控模板:左侧【配置】点击 【主机】点击【Zabbix server】
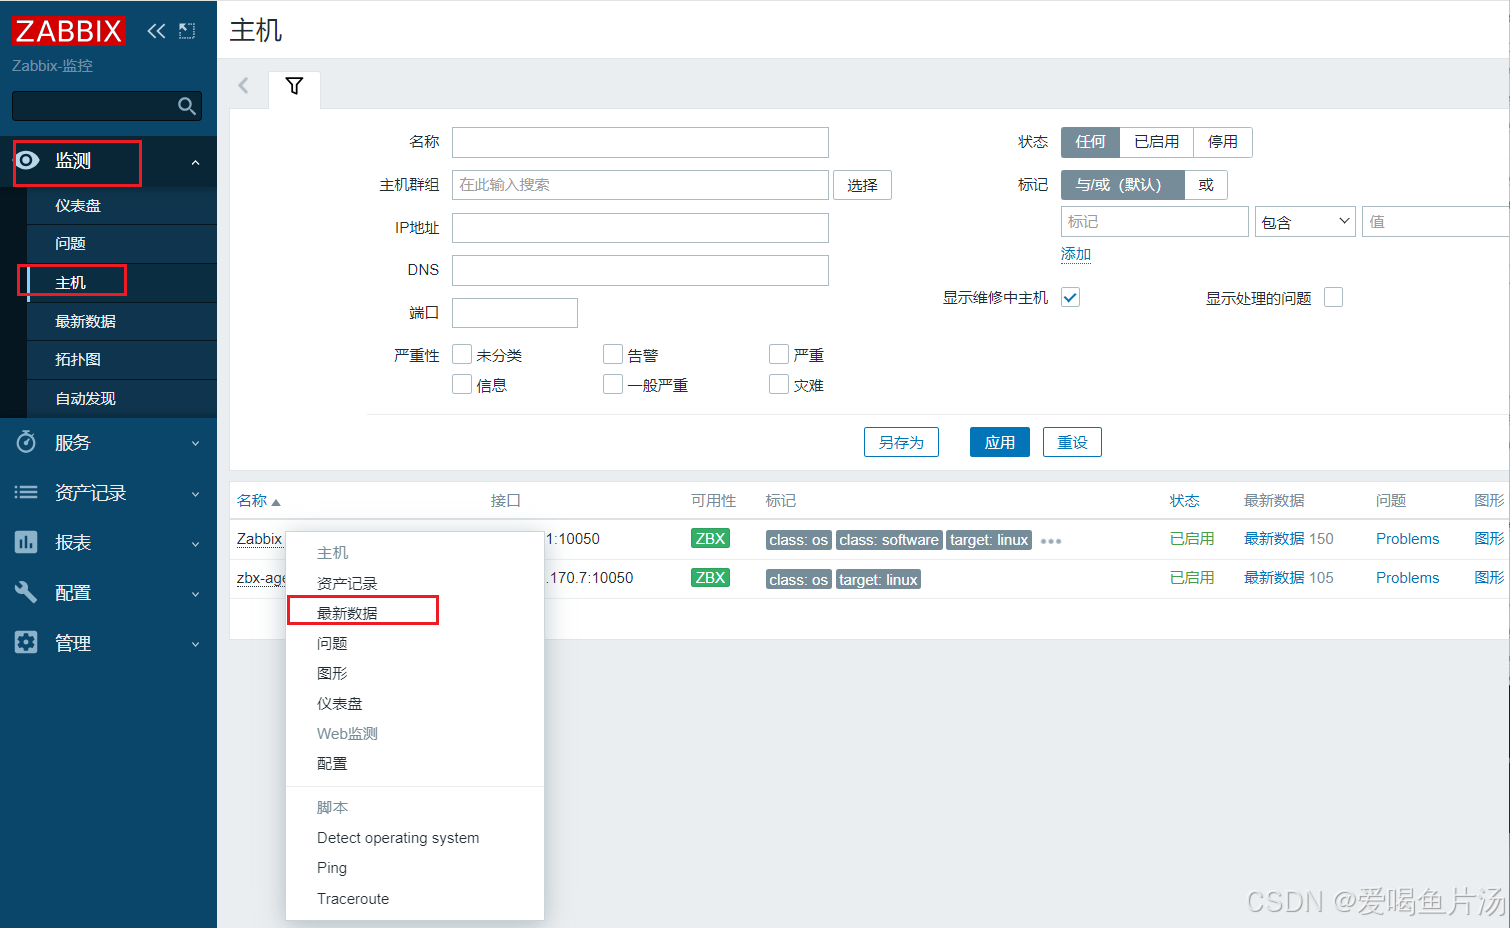
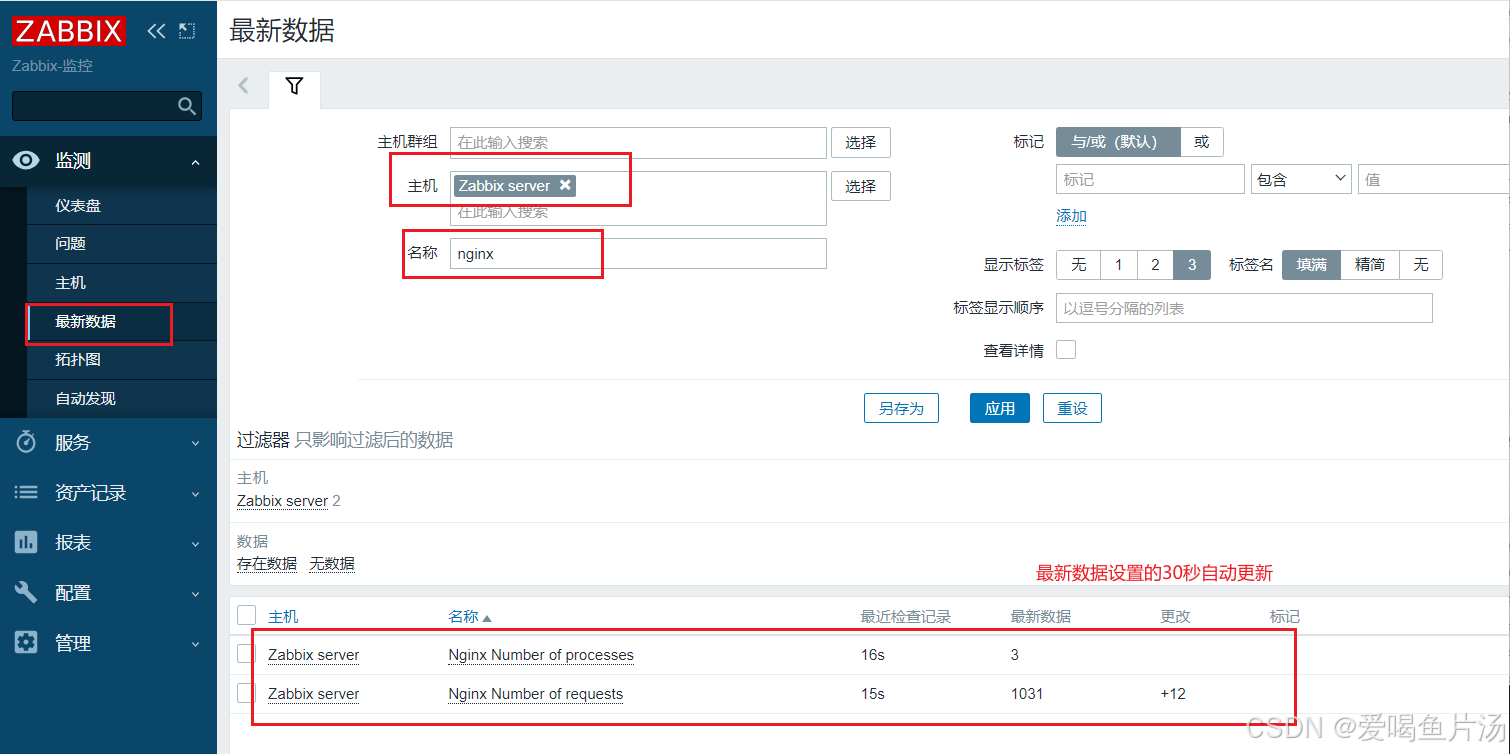
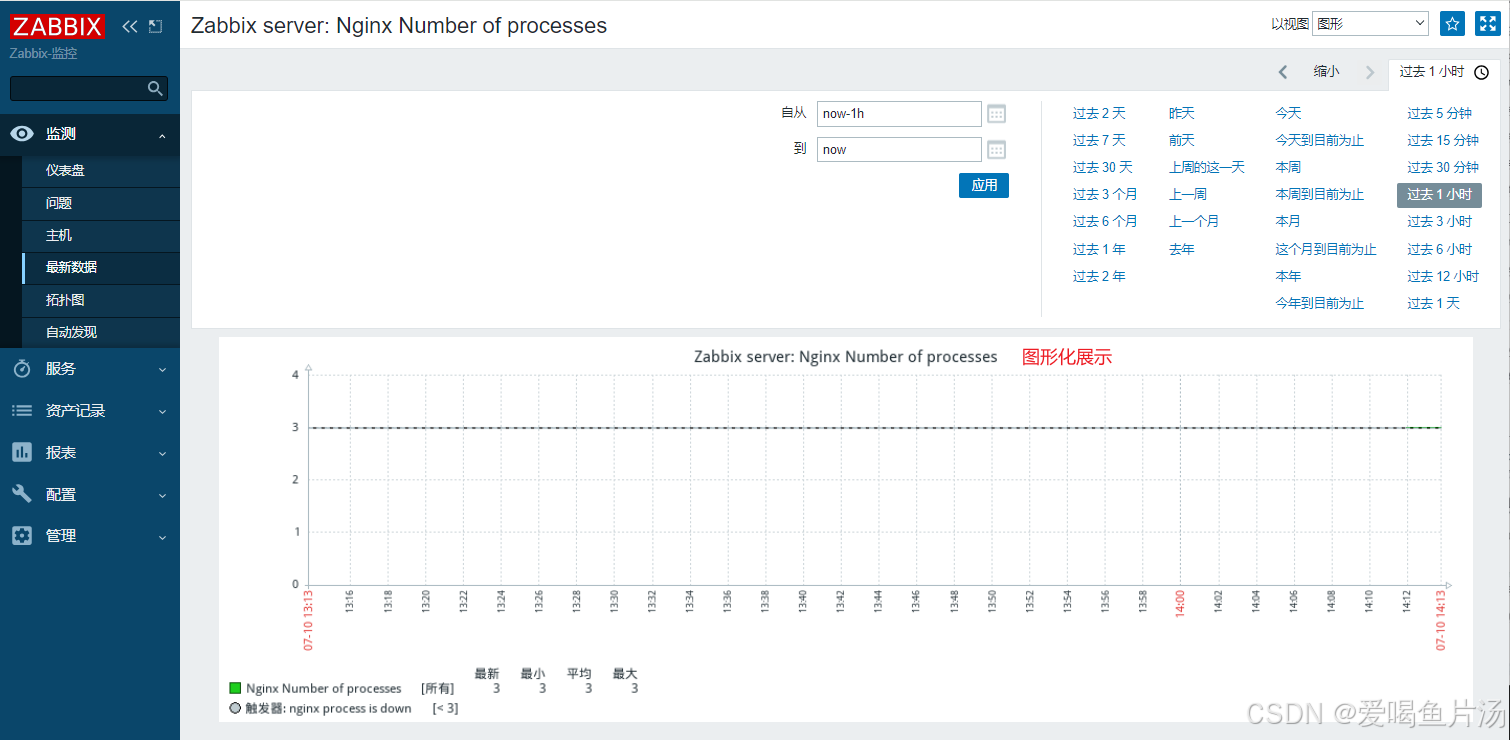
查看:左侧点击【监测】点击【主机】点击【Zabbix server】点击最新数据,找到添加的三个模板


主机关联监控模板:左侧【配置】点击 【主机】点击【Zabbix server】
把监控模板用起来
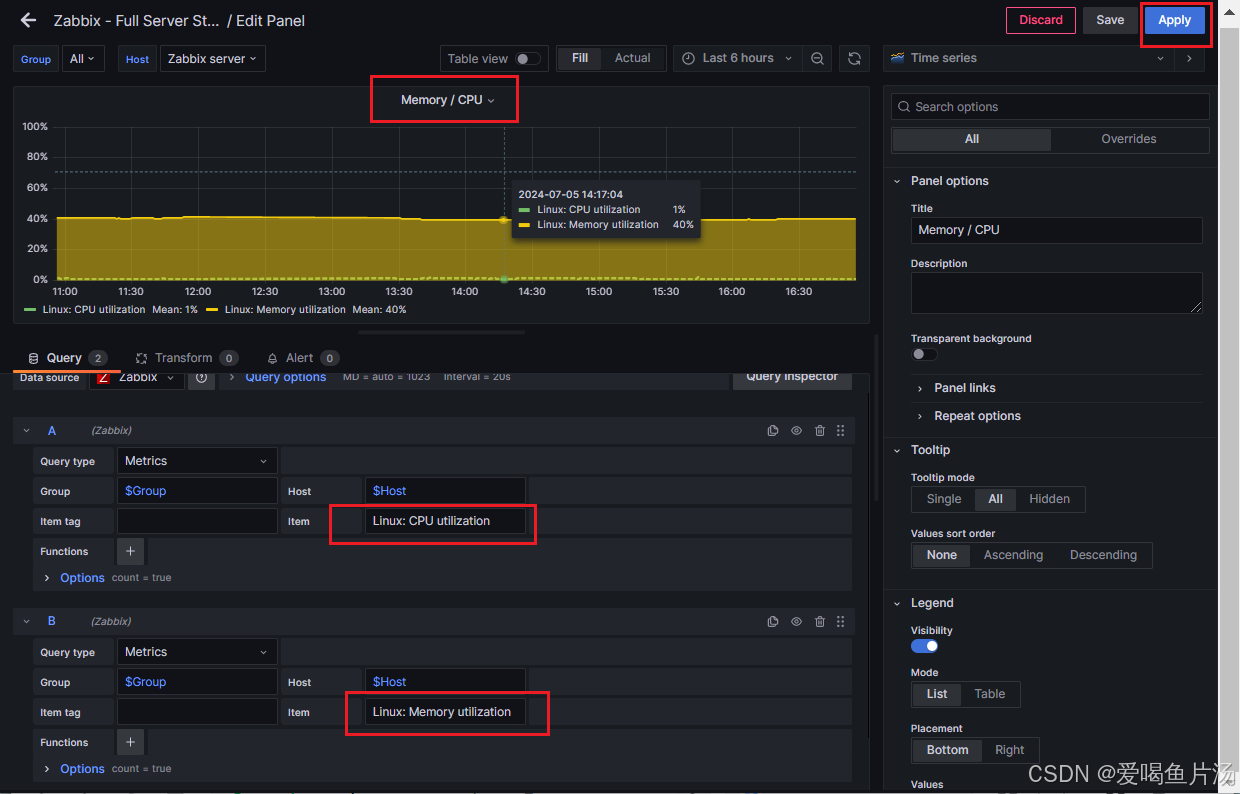
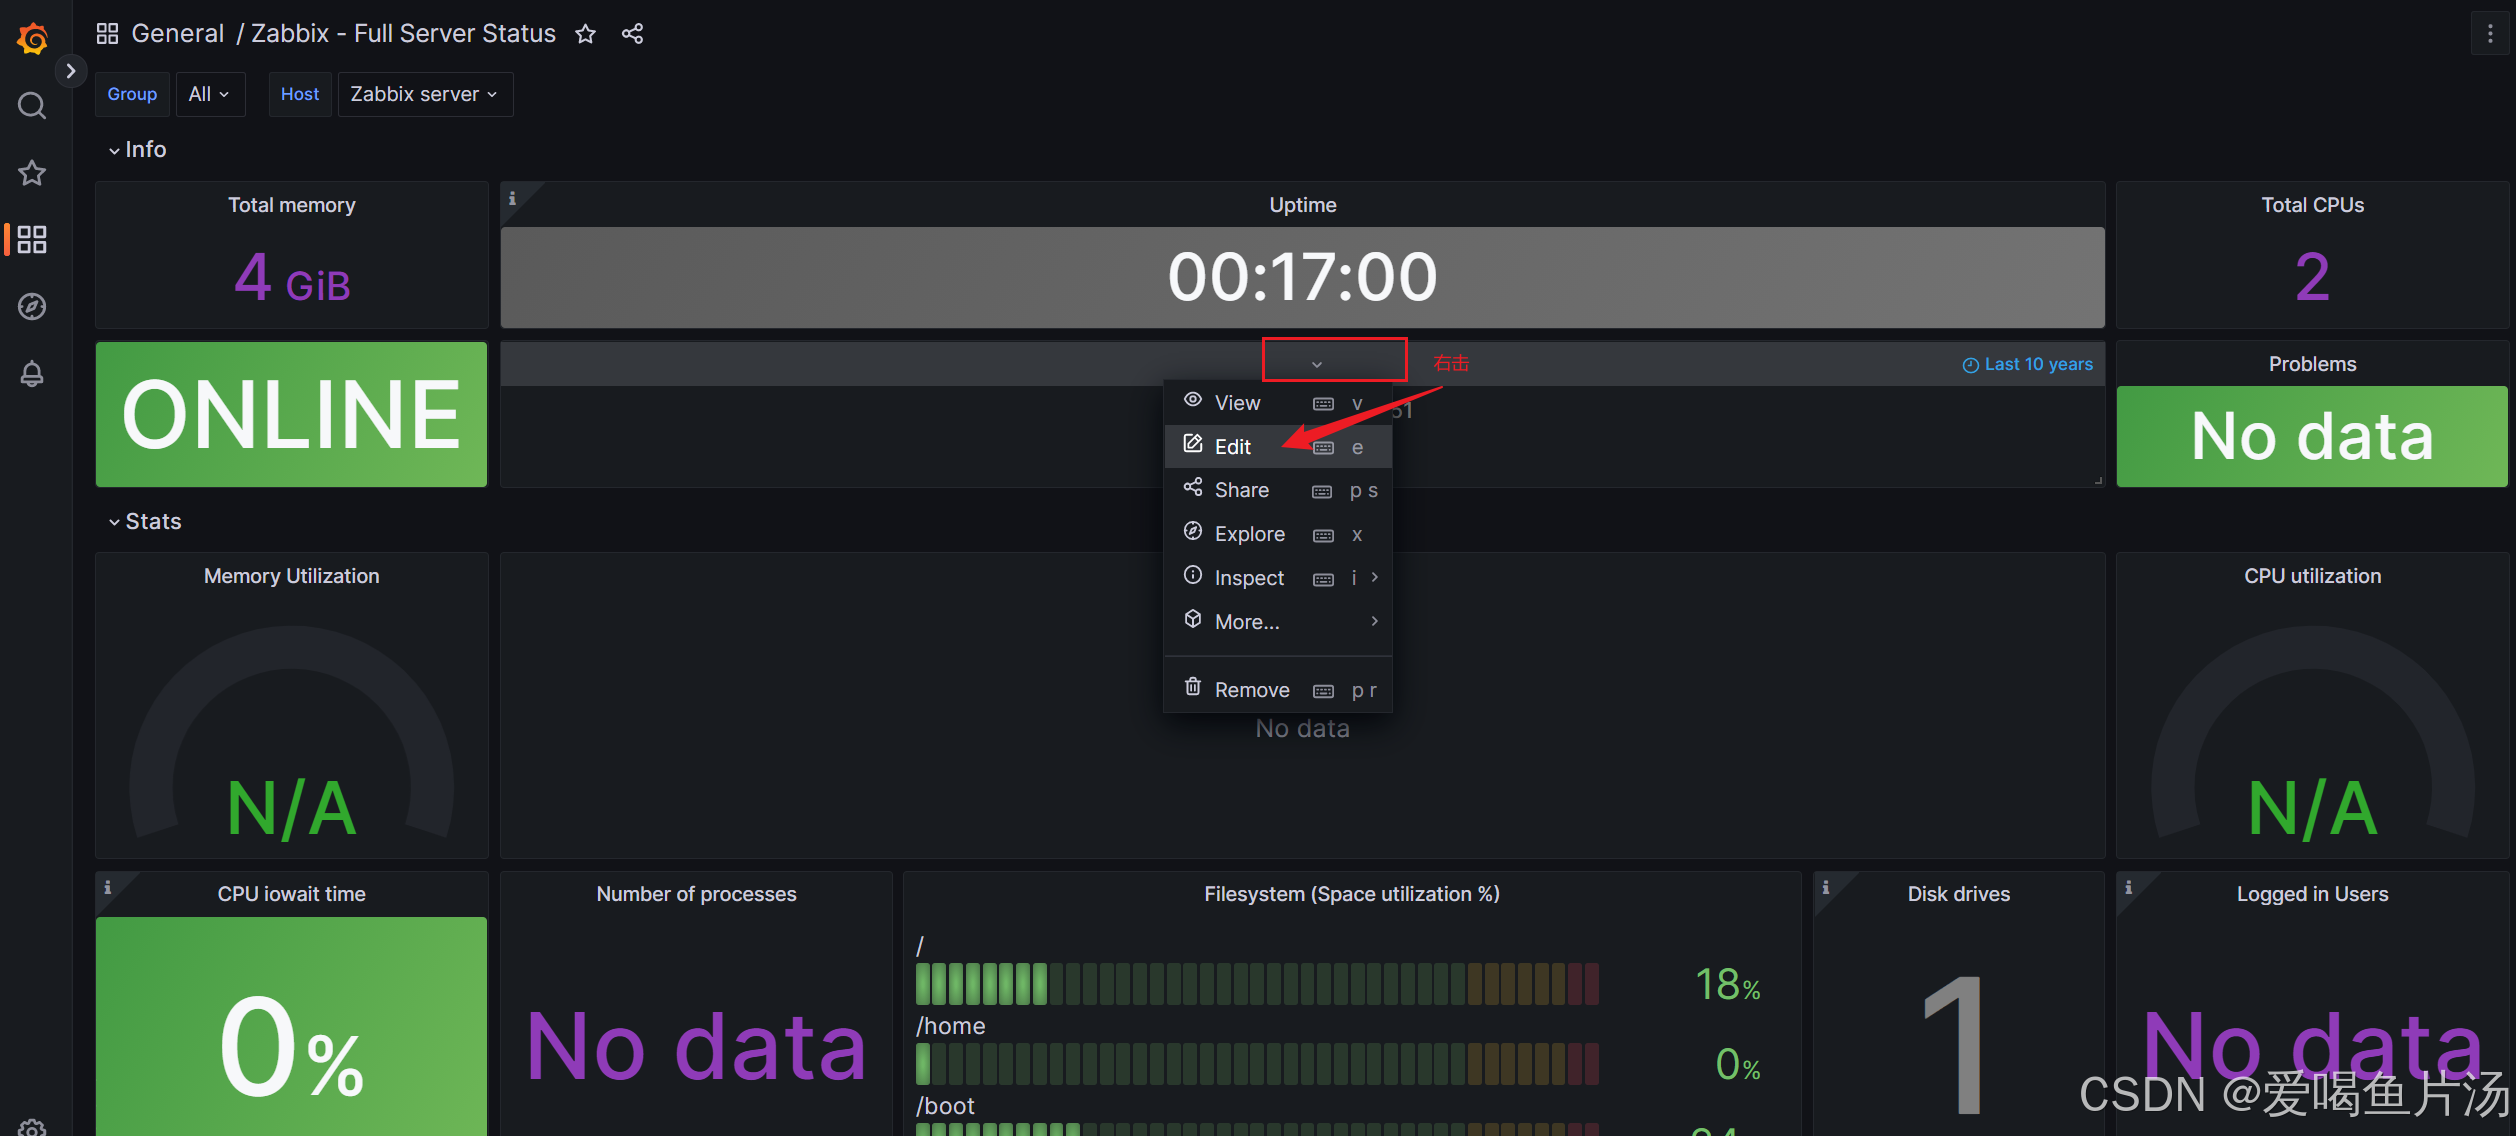
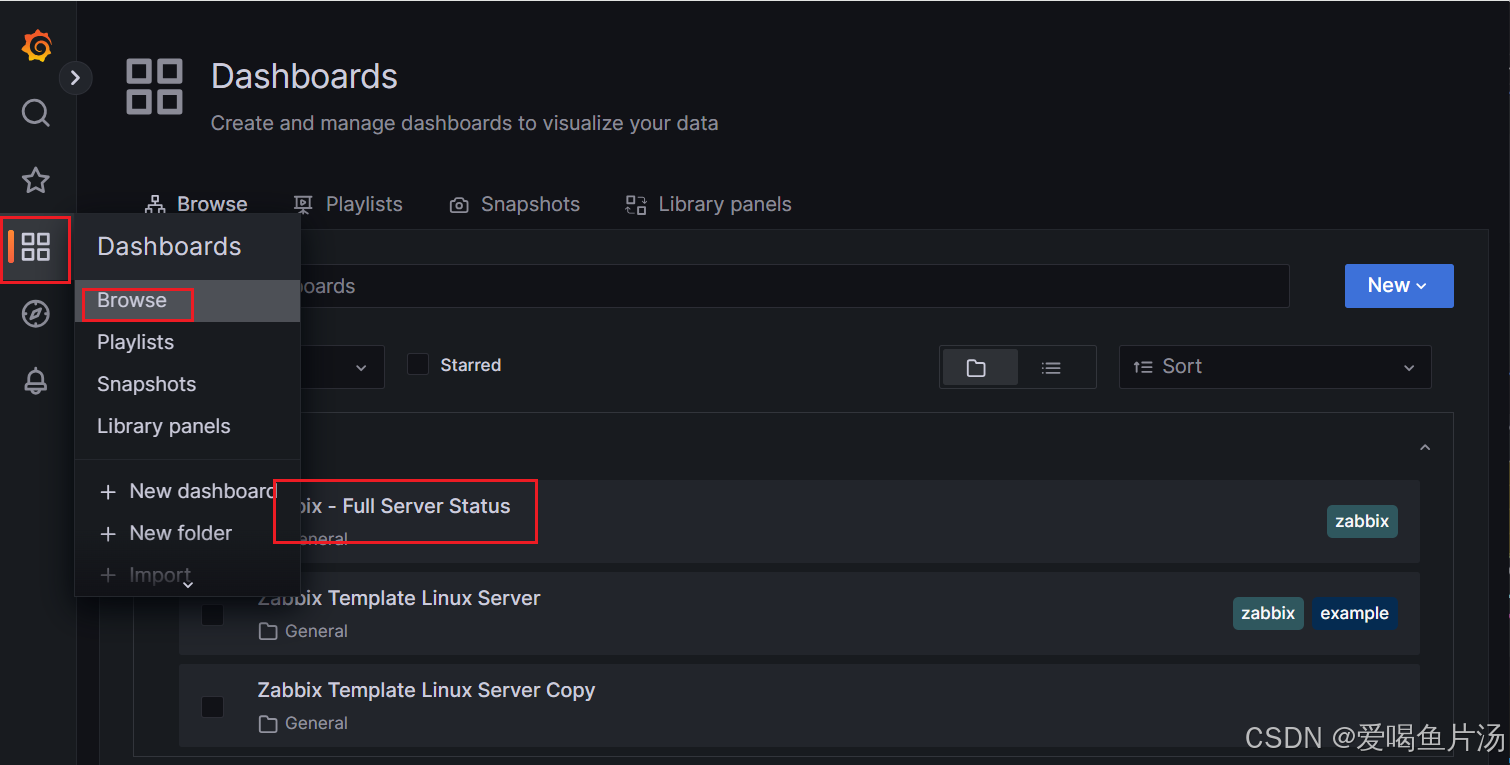
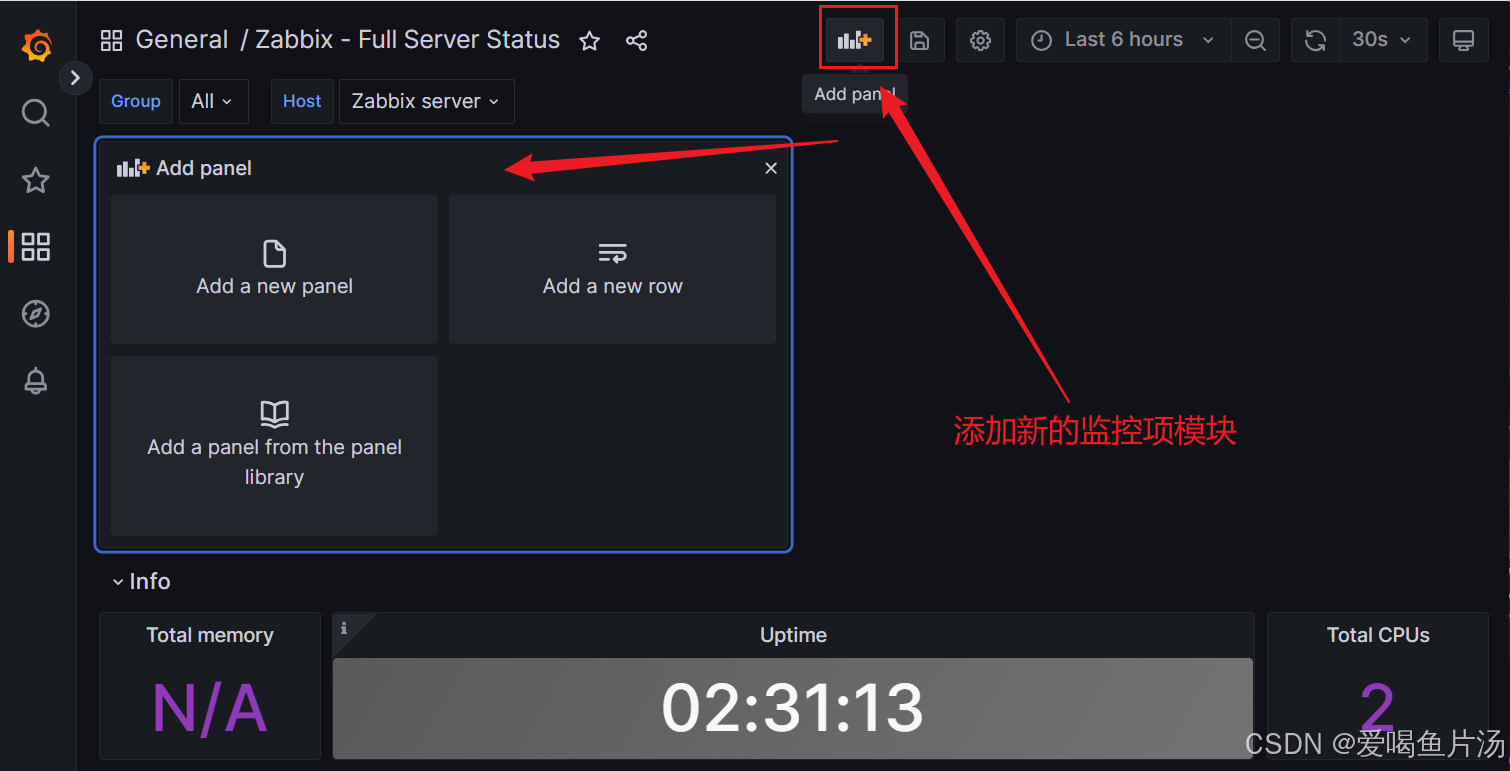
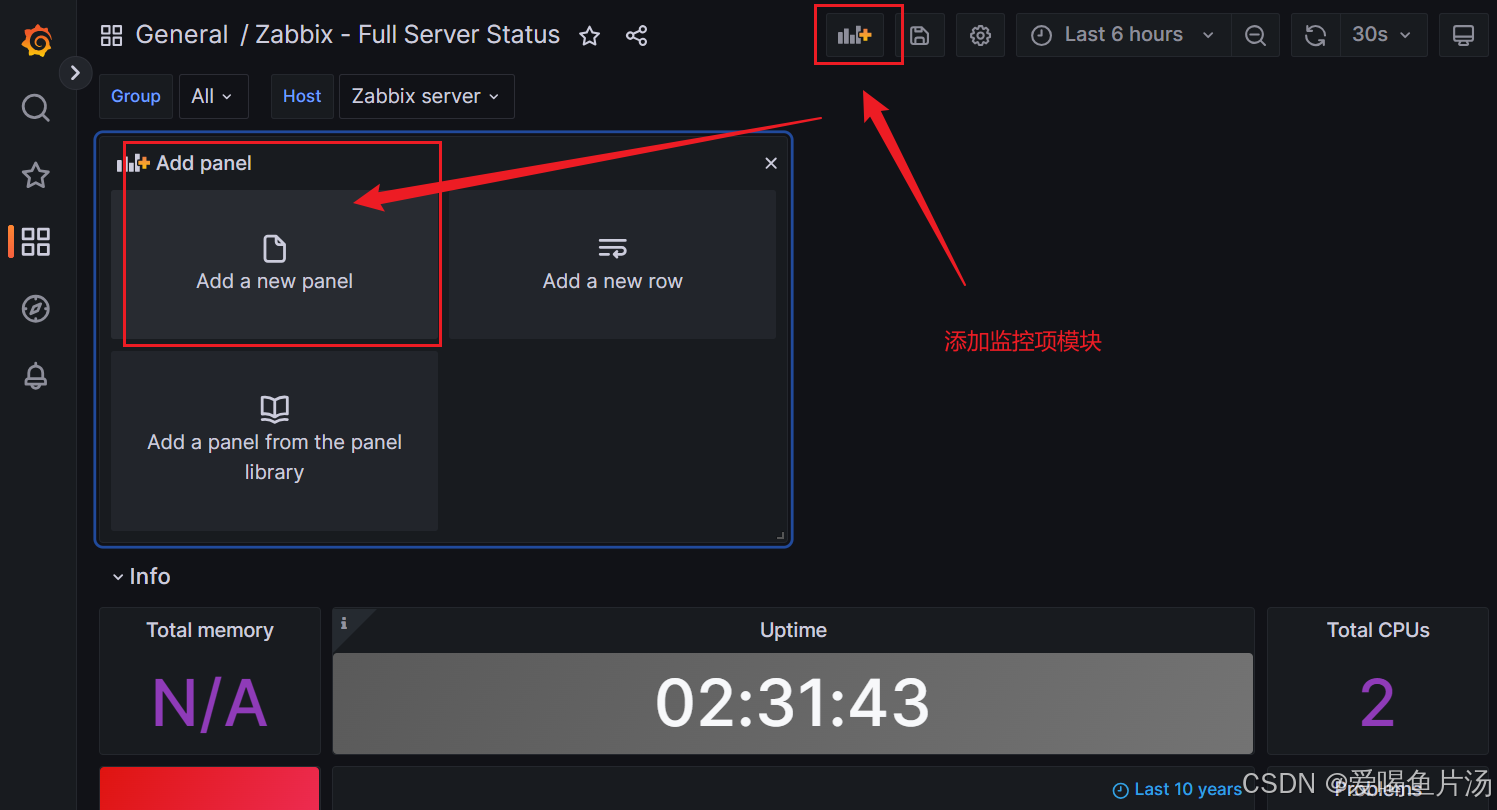
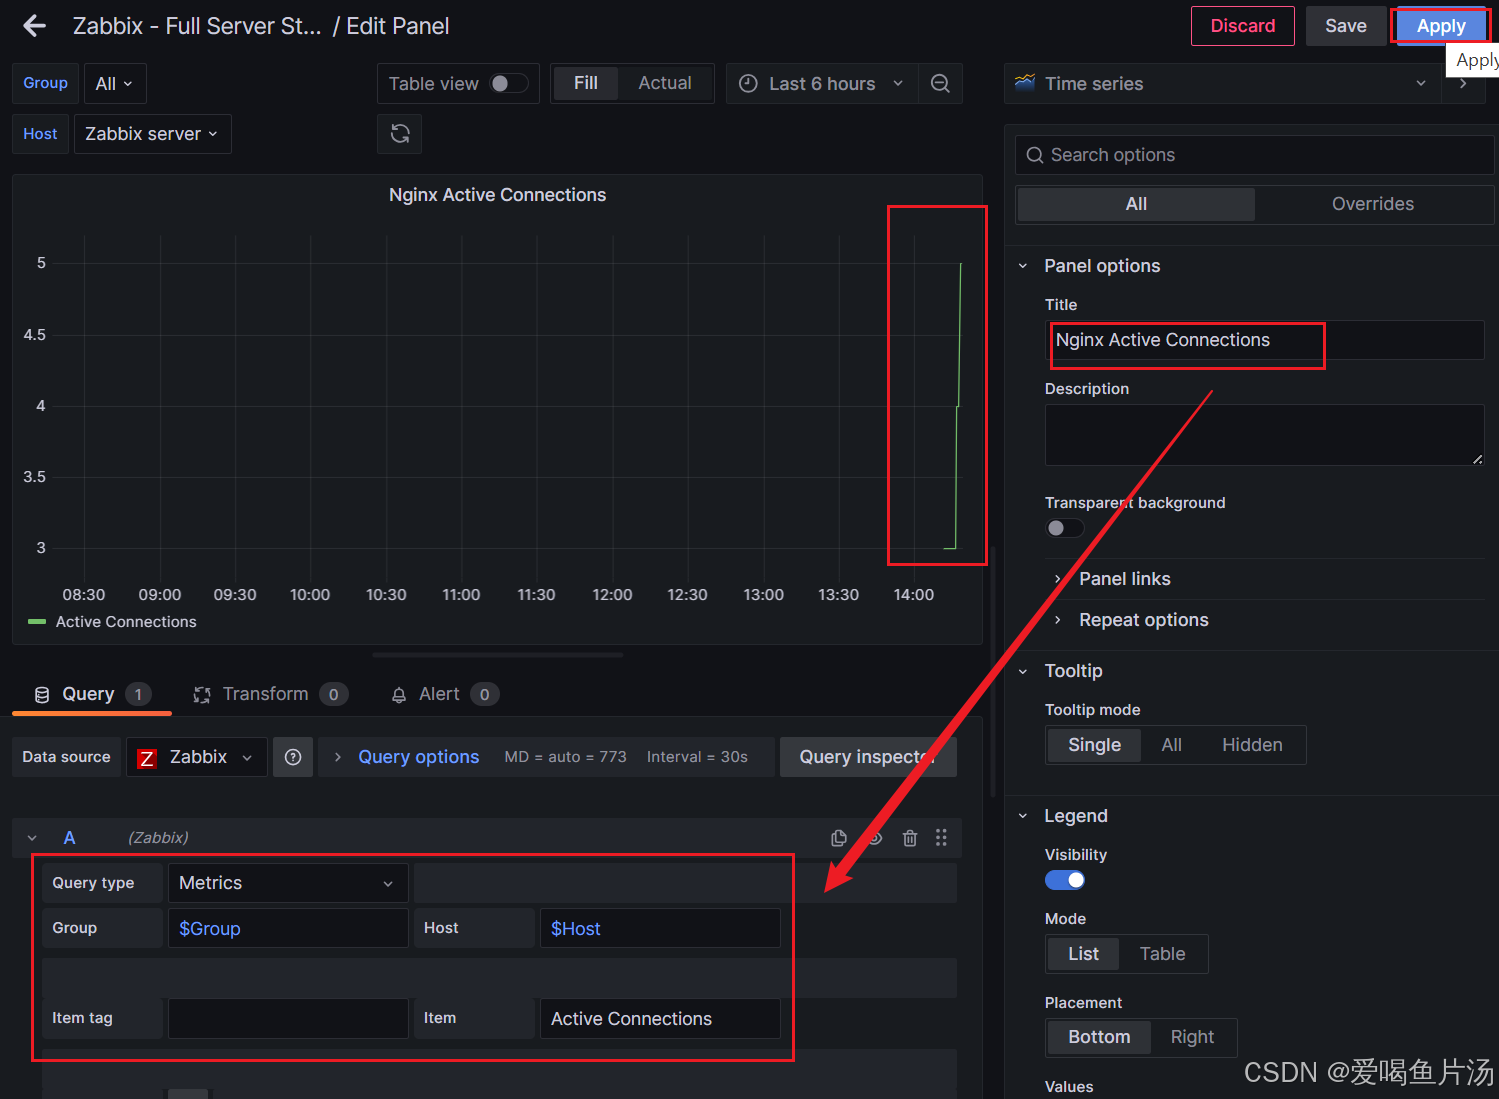
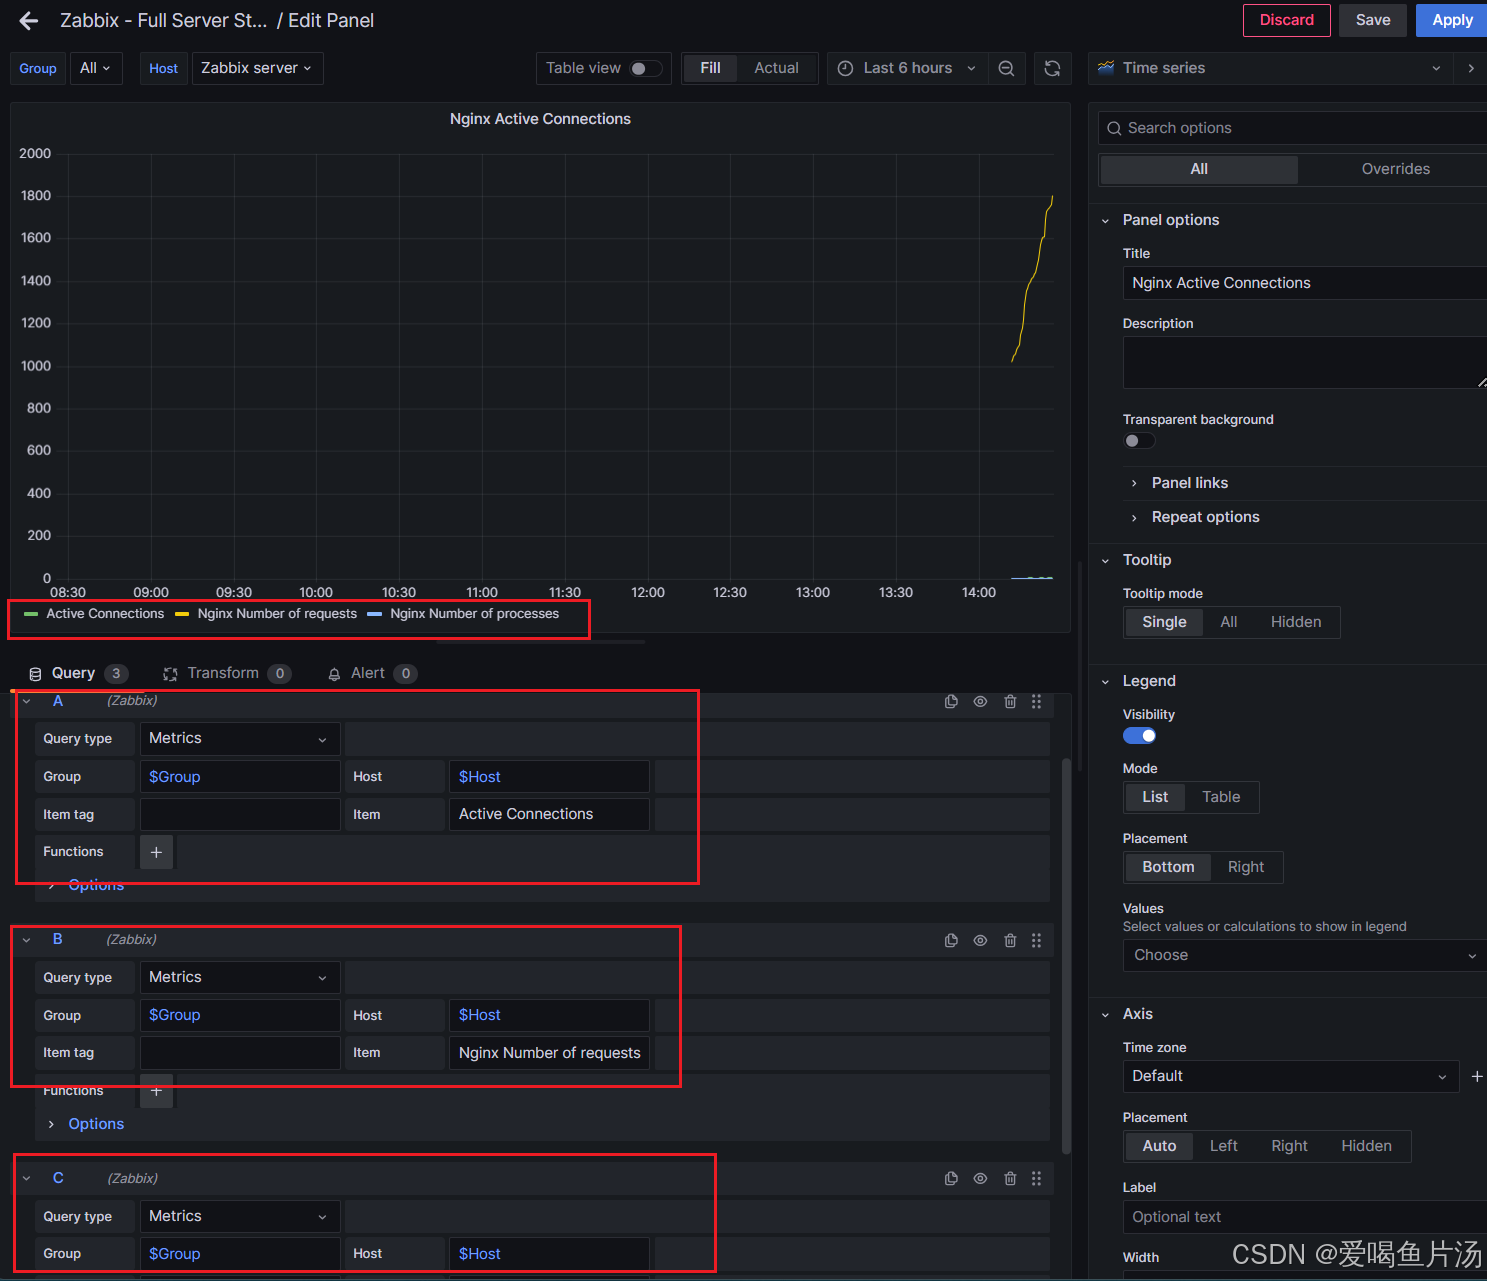
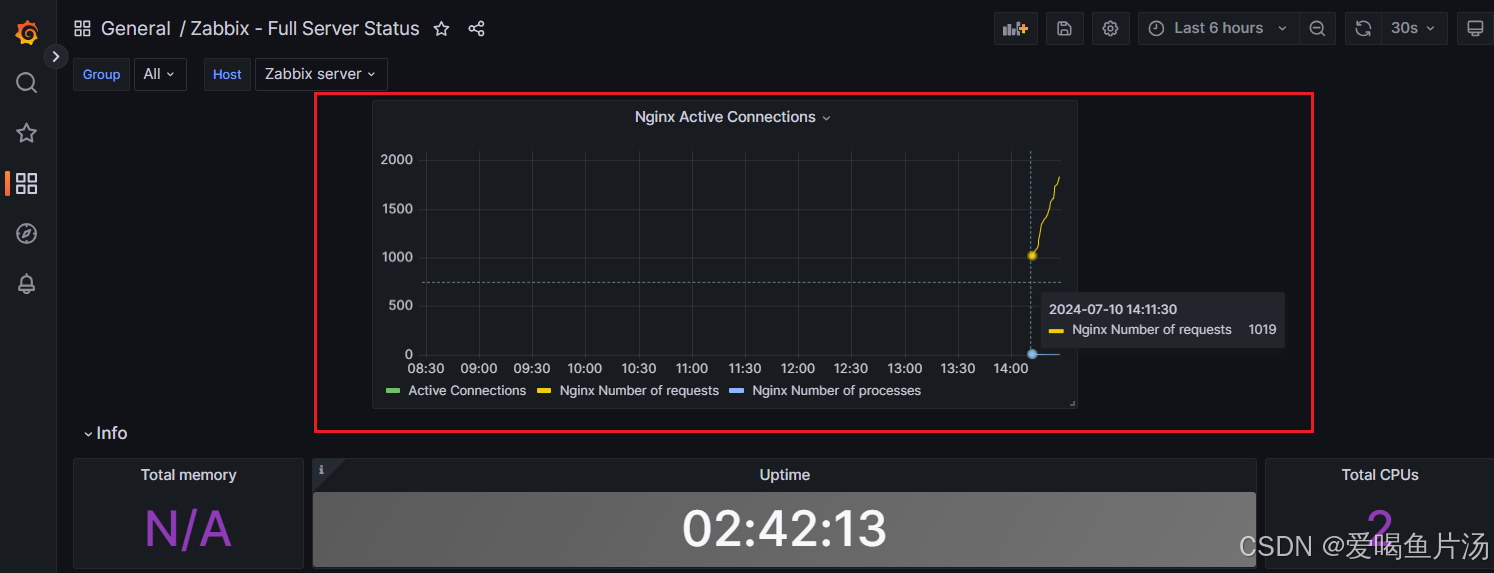
③ garafana里添加nginx上面的的三个监控项
6、如何自定义监控项?
① 明确获取指标数据的方法
② 目录中准备配置文件:UserParameter=...
③ 到zabbix中添加自定义监控模块、添加监控项,监控项中调用键值,保存
④ 找到监控主机关联监控模版,等待采集数据