前提先安装docker-compose参考:安装docker compose-CSDN博客
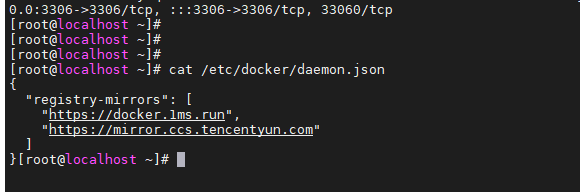
如果docker-compose 拉取不到镜像可以尝试修改 daemon.json,修改镜像仓库地址后
我的是:
javascript
vim /etc/docker/daemon.json

-------------------------------
{
  "registry-mirrors": [
    "https://docker.1ms.run",
    "https://mirror.ccs.tencentyun.com"
  ]
}

-------------------------------

# 记得!!!!重载系统守护进程配置
systemctl daemon-reload

# 重启 Docker 服务
systemctl restart docker
javascript
# 准备目录
mkdir -p /usr/local/prometheus/{config,data}
# 修改所有者为 65534:65534 (nobody:nogroup)
chown -R 65534:65534 /usr/local/prometheus/data
# 2. 修改所有者为 472:472 (这是 Grafana 官方镜像默认的用户ID)
chown -R 472:472 /usr/local/grafana/data
# 编写docker-compose.yml
cd /usr/local/prometheus
vim docker-compose.yml
--------------------------------------
services:
# ---------------- Prometheus 服务 ----------------
prometheus:
image: prom/prometheus:latest
container_name: prometheus
restart: unless-stopped
ports:
- "9090:9090"
volumes:
- /usr/local/prometheus/config/prometheus.yml:/etc/prometheus/prometheus.yml
- /usr/local/prometheus/data:/prometheus/data
command:
- '--config.file=/etc/prometheus/prometheus.yml'
- '--storage.tsdb.path=/prometheus/data'
- '--web.console.libraries=/etc/prometheus/console_libraries'
- '--web.console.templates=/etc/prometheus/consoles'
- '--storage.tsdb.retention.time=15d'
networks:
- monitor-net
# ---------------- Grafana 服务 ----------------
grafana:
image: grafana/grafana:latest
container_name: grafana
restart: unless-stopped
ports:
- "3000:3000"
environment:
- GF_SECURITY_ADMIN_USER=admin
- GF_SECURITY_ADMIN_PASSWORD=admin
- TZ=Asia/Shanghai
volumes:
- /usr/local/grafana/data:/var/lib/grafana
networks:
- monitor-net
depends_on:
- prometheus
# ---------------- 网络配置 ----------------
networks:
monitor-net:
driver: bridge
-----------------------------------------
# 编写prometheus.yml
vim prometheus.yml
----------------------------------------
global:
scrape_interval: 15s
scrape_configs:
- job_name: 'prometheus'
static_configs:
- targets: ['localhost:9090']
---------------------------------------------
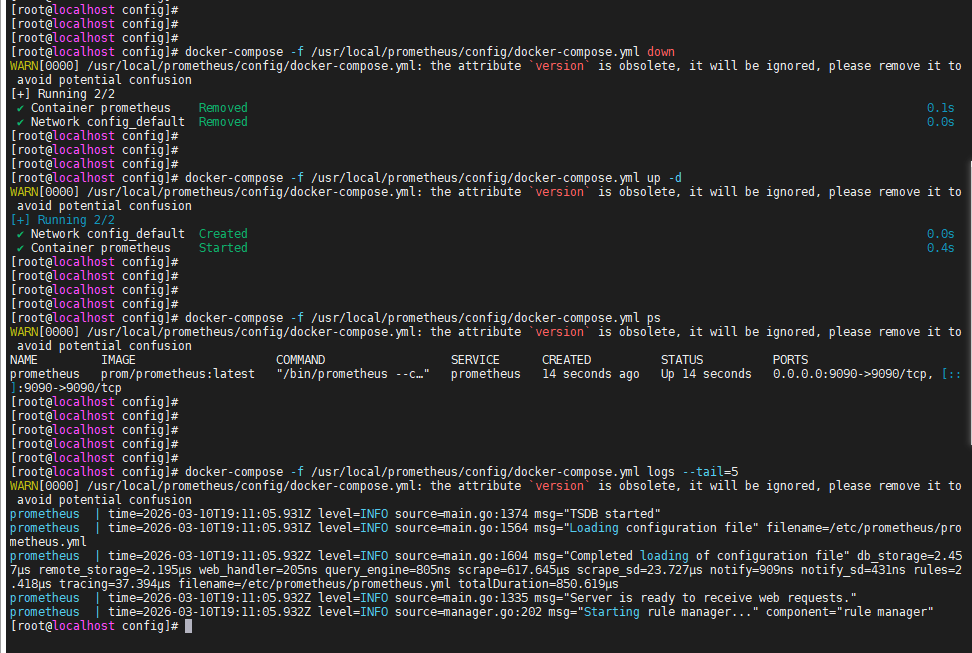
# 停止旧容器
docker-compose -f /usr/local/prometheus/config/docker-compose.yml down
# 启动新容器
docker-compose -f /usr/local/prometheus/config/docker-compose.yml up -d
# 查看状态(必须看到 Up 而不是 Restarting)
docker-compose -f /usr/local/prometheus/config/docker-compose.yml ps
# 查看日志确认无报错
docker-compose -f /usr/local/prometheus/config/docker-compose.yml logs --tail=10
正常启动没有报错信息
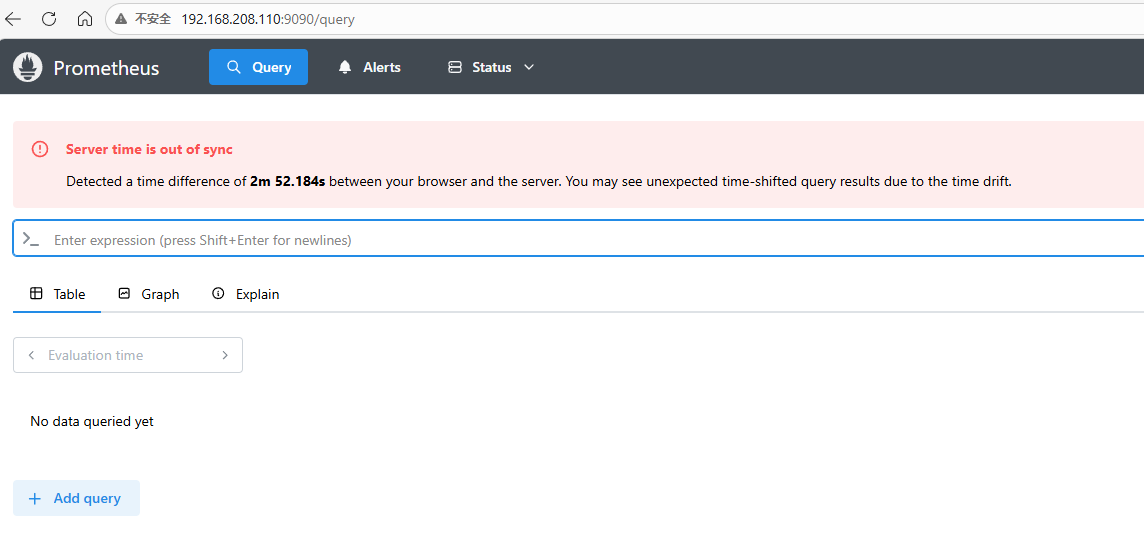
测试访问9090端口
补充:# 安装数据收集器
javascript
docker run -d --name node-exporter -p 9010:9100 --restart=always \
-h "Master1服务器" \
-v "/proc:/host/proc:ro" \
-v "/sys:/host/sys:ro" \
-v "/:/rootfs:ro" \
prom/node-exporter
添加要监控的服务
javascript
# 编写prometheus.yml

vim prometheus.yml
----------------------------------------

global:
  scrape_interval: 15s

scrape_configs:
  - job_name: 'prometheus'
    static_configs:
      - targets: ['localhost:9090']
        labels:
          serviceId: prometheus
          serviceName: 普罗米修斯

  - job_name: 'nodeExporter'
    static_configs:
      - targets: ['192.168.208.110:9010']
        labels:
          serviceId: Msater1
          serviceName: Master1服务器

alerting:
  alertmanagers:
    - static_configs:
	  - targets:
	    - 192.168.208.110:9093

rule_files:
  - 'rules/*.yml'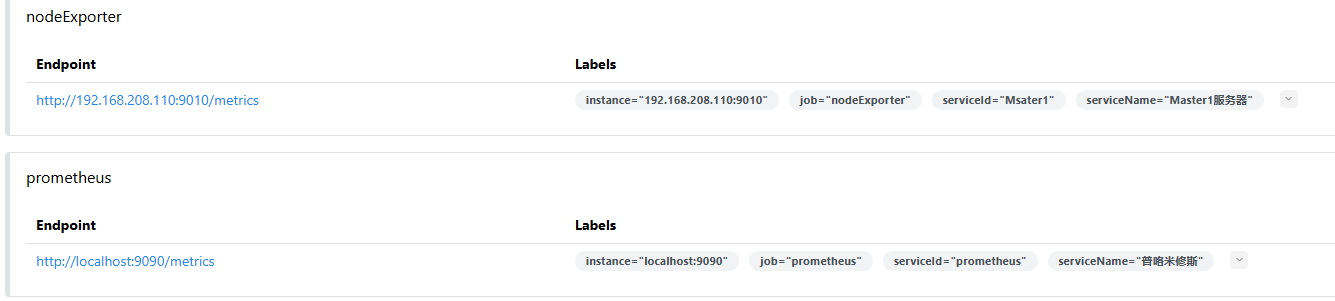
访问3000端口
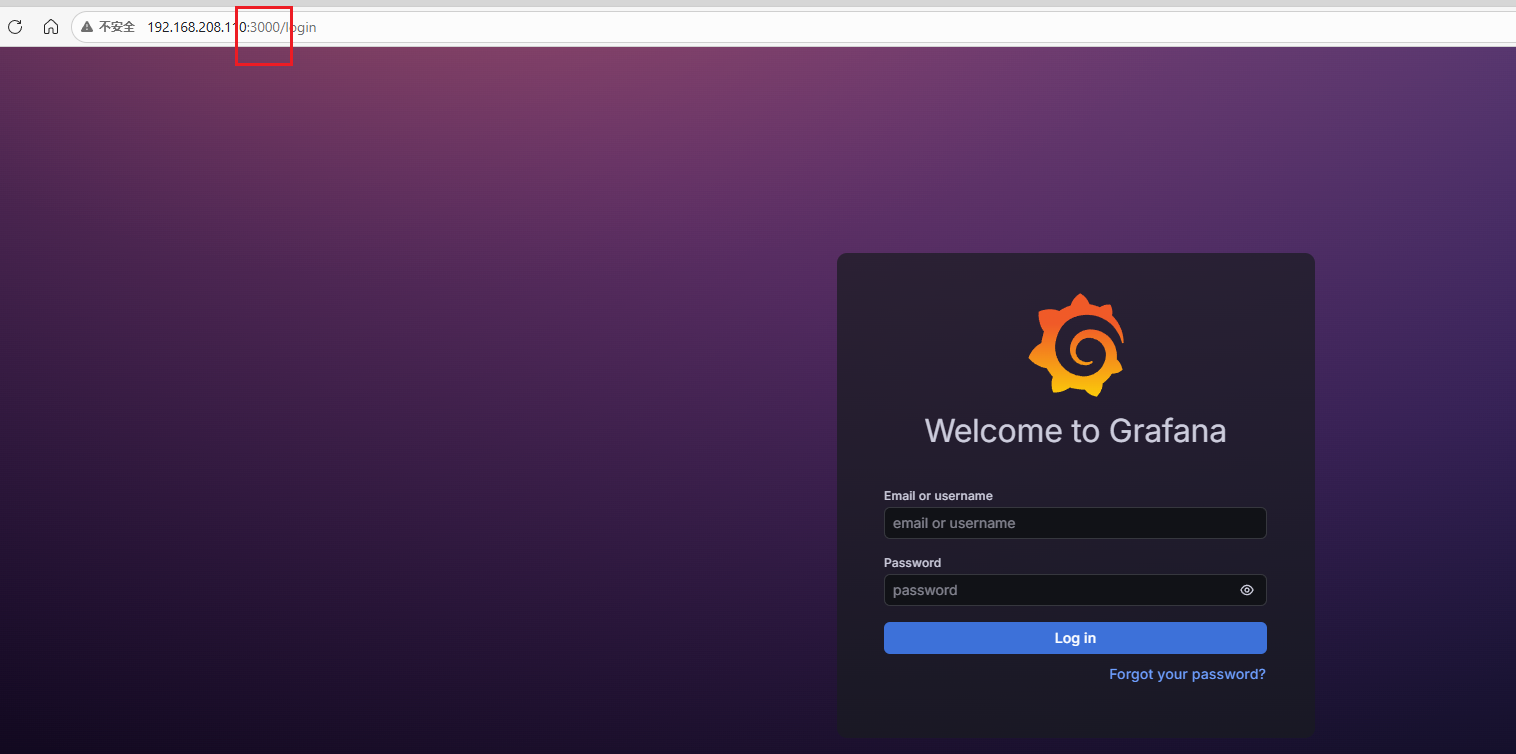
默认账号密码admin/admin
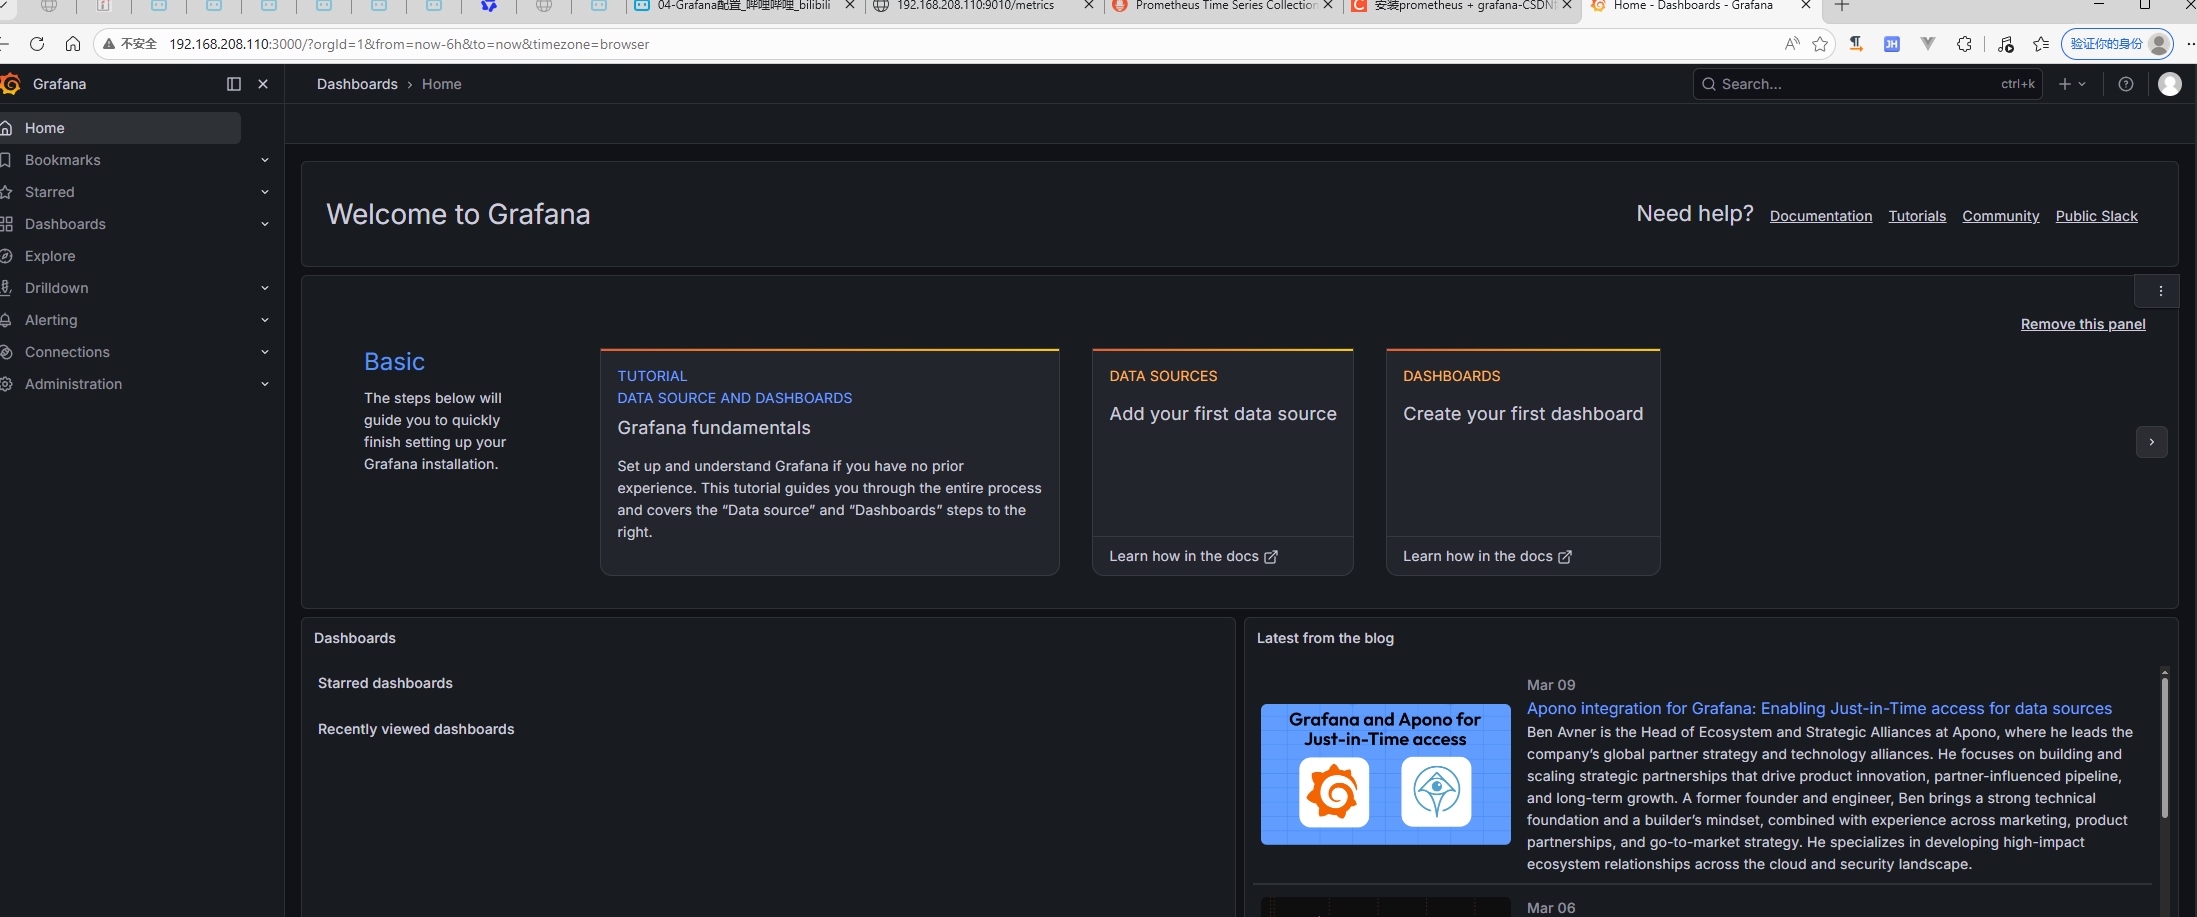
可选的监控面板