本节重点介绍 :
- grafana 上导入mysqld-dashboard
- global status 相关源码解读
- 重要指标讲解
- 连接数
- 内存
- TPS、QPS
将采集任务添加到prometheus中
yaml
  - job_name: mysqld_exporter
    honor_timestamps: true
    scrape_interval: 8s
    scrape_timeout: 8s
    metrics_path: /metrics
    scheme: http
    follow_redirects: true
    static_configs:
    - targets:
      - 192.168.3.200:9104
grafana 上导入mysqld-dashboard
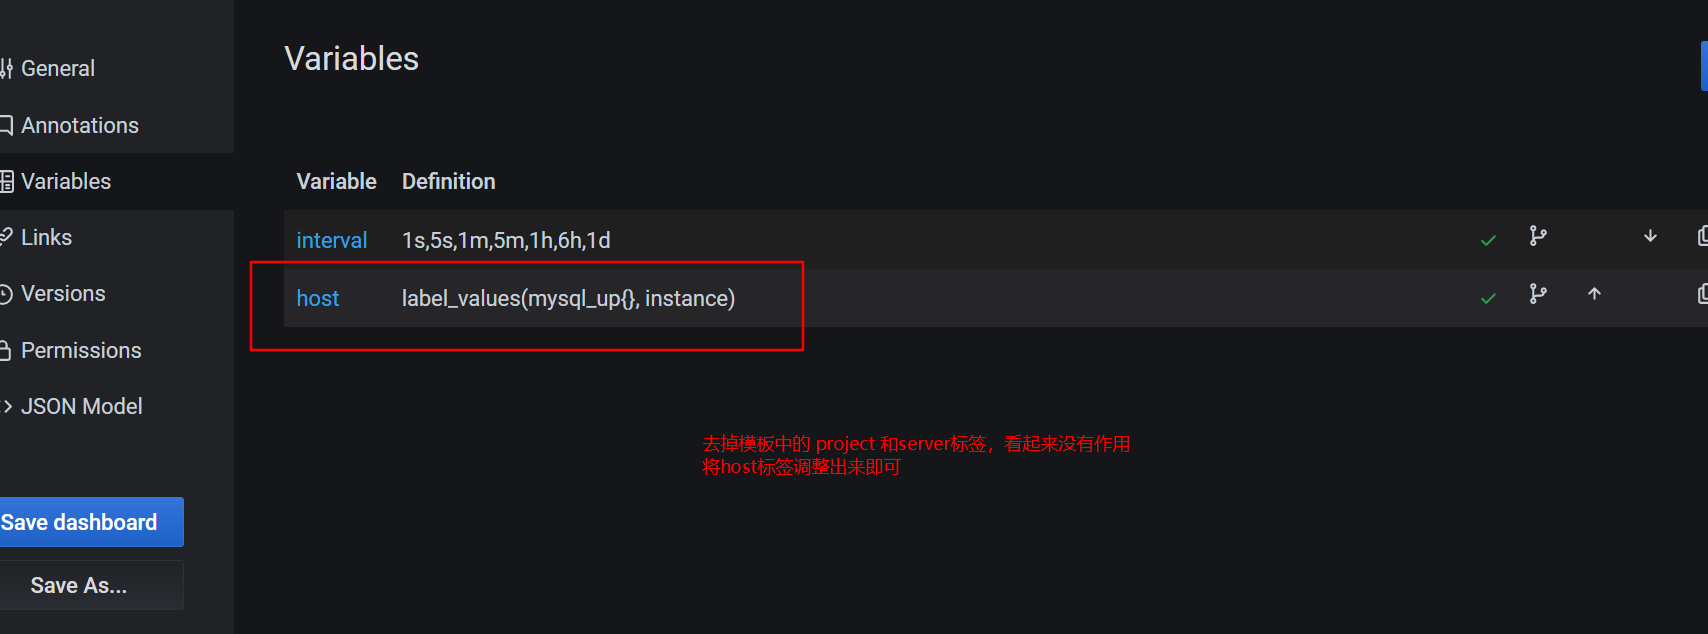
调整大盘变量
- 举例图片
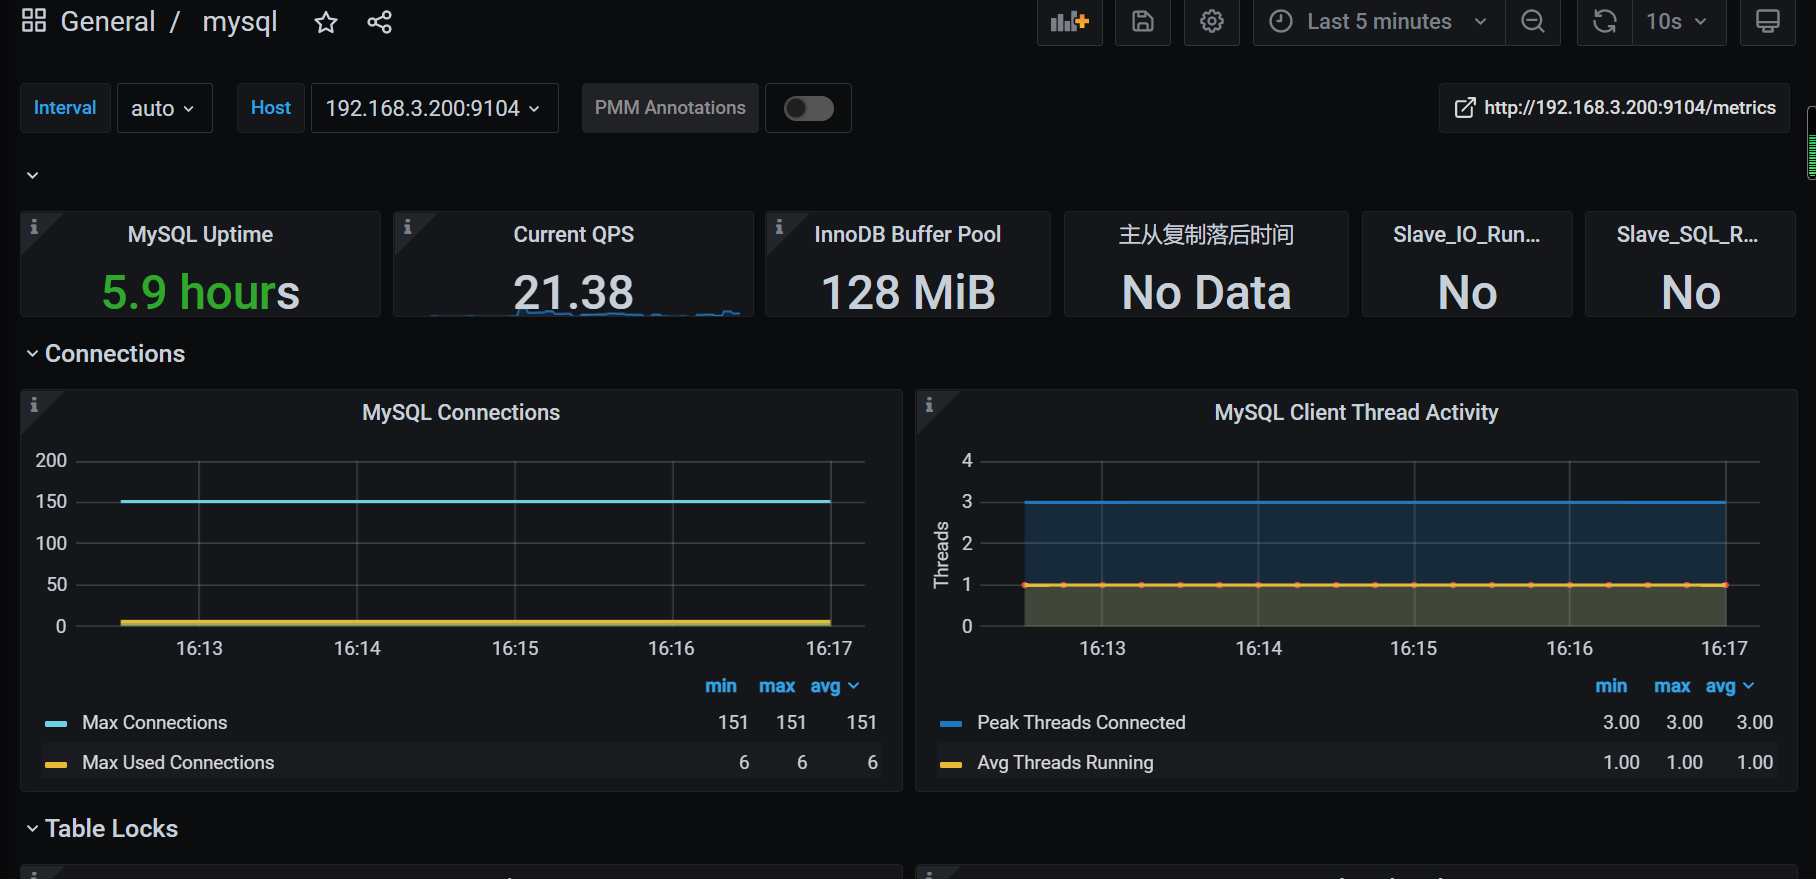
- 最终的效果图
指标讲解和相关源码讲解
global status 相关的
mysql_global_status_threads_connected 表示当前连接数
- 源码 位置 D:\go_path\src\github.com\ning1875\mysqld_exporter\collector\global_status.go
- 执行
SHOW GLOBAL STATUS命令,逐行遍历,如果key 不在 正则中,则用 mysql_global_status前缀+key,类型为prometheus.UntypedValue - scrape函数
go
func (ScrapeGlobalStatus) Scrape(ctx context.Context, db *sql.DB, ch chan<- prometheus.Metric, logger log.Logger) error {
	globalStatusRows, err := db.QueryContext(ctx, globalStatusQuery)

	for globalStatusRows.Next() {
		if err := globalStatusRows.Scan(&key, &val); err != nil {
			return err
		}
		if floatVal, ok := parseStatus(val); ok { // Unparsable values are silently skipped.
			key = validPrometheusName(key)
			match := globalStatusRE.FindStringSubmatch(key)
			if match == nil {
				ch <- prometheus.MustNewConstMetric(
					newDesc(globalStatus, key, "Generic metric from SHOW GLOBAL STATUS."),
					prometheus.UntypedValue,
					floatVal,
				)
				continue
}- globalStatusRE正则
go
mysql_global_variables_innodb_buffer_pool_sizevar globalStatusRE = regexp.MustCompile(`^(com|handler|connection_errors|innodb_buffer_pool_pages|innodb_rows|performance_schema)_(.*)$`)- 指标metrics结果
shell
# HELP mysql_global_status_threads_connected Generic metric from SHOW GLOBAL STATUS.
# TYPE mysql_global_status_threads_connected untyped
mysql_global_status_threads_connected 9
- 为什么进行这样
其它连接数
- mysql_global_status_max_used_connections 表示 服务器启动后已经同时使用的连接的最大数量
- mysql_global_variables_max_connections 表示 最大连接数
- mysql_global_status_questions 已执行的由客户端发出的语句
- mysql_global_status_aborted_connects 尝试已经失败的MySQL服务器的连接的次数
- mysql_global_status_aborted_clients 由于客户没有正确关闭连接已经死掉,已经放弃的连接数量
内存
- mysql_global_status_innodb_page_size innodb内存划分粒度
- mysql_global_status_buffer_pool_pages 用于缓存索引和数据的内存大小
- mysql_global_variables_innodb_log_buffer_size 用来设置缓存还未提交的事务的缓冲区的大小
TPS 服务器每秒处理的事务数
- 计算方法
shell
Com_commit = SHOW GLOBAL STATUS LIKE 'Com_commit';
Com_rollback = SHOW GLOBAL STATUS LIKE 'Com_rollback';
Uptime = SHOW GLOBAL STATUS LIKE 'Uptime';
TPS=(Com_commit + Com_rollback)/Uptime - promql
sum(rate(mysql_global_status_commands_total{command=~"(commit|rollback)"}[5m])) without (command)
QPS
- 计算方法
shell
Questions = SHOW GLOBAL STATUS LIKE 'Questions';
Uptime = SHOW GLOBAL STATUS LIKE 'Uptime';
QPS=Questions/Uptime - promql irate(mysql_global_status_queries5m)
本节重点总结 :
- grafana 上导入mysqld-dashboard
- 变量的处理,没有图,变量解析的不对
- global status 相关源码解读
- 重要指标讲解
- 连接数
- 内存
- TPS、QPS