🤵♂️ 个人主页:@艾派森的个人主页
✍🏻作者简介:Python学习者
🐋 希望大家多多支持,我们一起进步!😄
如果文章对你有帮助的话,
欢迎评论 💬点赞👍🏻 收藏 📂加关注+
写在前面
最近有粉丝问我"什么 AI 工具好",其实还是得看自己的使用场景,很难说有最好用,只有最合自己胃口的。对我来说,好用的 AI 工具满足几个标准:
- 使用方便。用的时候不要太麻烦,最好一键就能启用
- 功能丰富。这样可以覆盖绝大多数的使用场景
- 性能一流。决定上限
- 价格实惠。这很重要
以前我用 ChatGPT 最多,主要是当时没别的可选,就它最厉害,但现在大模型之间的性能差距越来越小,所以慢慢地其他工具就一块用了,比如 Claude、Kimi,AI 搜索的 Perplexity,综合起来看,我目前用得频率最高、也是最顺手的 AI 工具反而是一个浏览器插件**"灵办 AI"**。功能挺多,该有的都有,比如:
- AI 对话
- 翻译
- 阅读(网页+文档)
- 联网搜索
- AI 写作
- .....

感兴趣的小伙伴点击下方链接即可免费注册使用:(推荐使用电脑)
https://ilingban.com/browser_extension/?from=aps
目录
1.项目背景
在当今数字化快速发展的时代,数据已成为驱动决策和预测未来的重要力量。房地产市场作为国民经济的重要组成部分,其价格的波动不仅直接影响着居民的生活水平,也反映了国家宏观经济的运行状况。长沙市,作为湖南省的省会城市,近年来随着经济的快速发展和城市化进程的加速,租房市场也呈现出蓬勃发展的态势。
然而,租房价格的波动受到多种因素的影响,包括供求关系、地理位置、房屋类型、装修状况、交通便捷性、周边设施等。这些因素之间相互交织,形成了复杂的动态系统,使得租房价格的预测变得尤为困难。传统的预测方法,如基于经验或简单统计的预测,往往难以准确反映市场变化,且难以适应复杂多变的市场环境。
为了更准确地预测长沙市租房价格,本研究将采用基于Python爬虫和机器学习的方法。Python爬虫技术可以从互联网上大量抓取相关的租房数据,包括房源信息、价格、地理位置、房屋类型等,为后续的机器学习模型提供丰富的数据基础。而机器学习技术则可以通过对大量数据的分析和学习,自动发现数据中的规律和模式,从而实现对租房价格的准确预测。
具体来说,本研究将分为以下几个步骤:首先,利用Python爬虫技术从各大租房网站和平台上抓取相关的租房数据;其次,对抓取的数据进行清洗、预处理和特征工程,提取出与租房价格相关的关键特征;然后,选择合适的机器学习算法(如线性回归、决策树、随机森林、神经网络等),构建租房价格预测模型;最后,通过模型训练和验证,不断优化模型参数,提高预测精度。
本研究旨在通过Python爬虫和机器学习技术的结合,实现对长沙市租房价格的准确预测,为政府决策、房地产开发商、租赁企业和租户等提供有价值的参考信息。同时,本研究也将为机器学习在房地产价格预测领域的应用提供新的思路和方法,具有一定的理论意义和实践价值。
2.数据集介绍
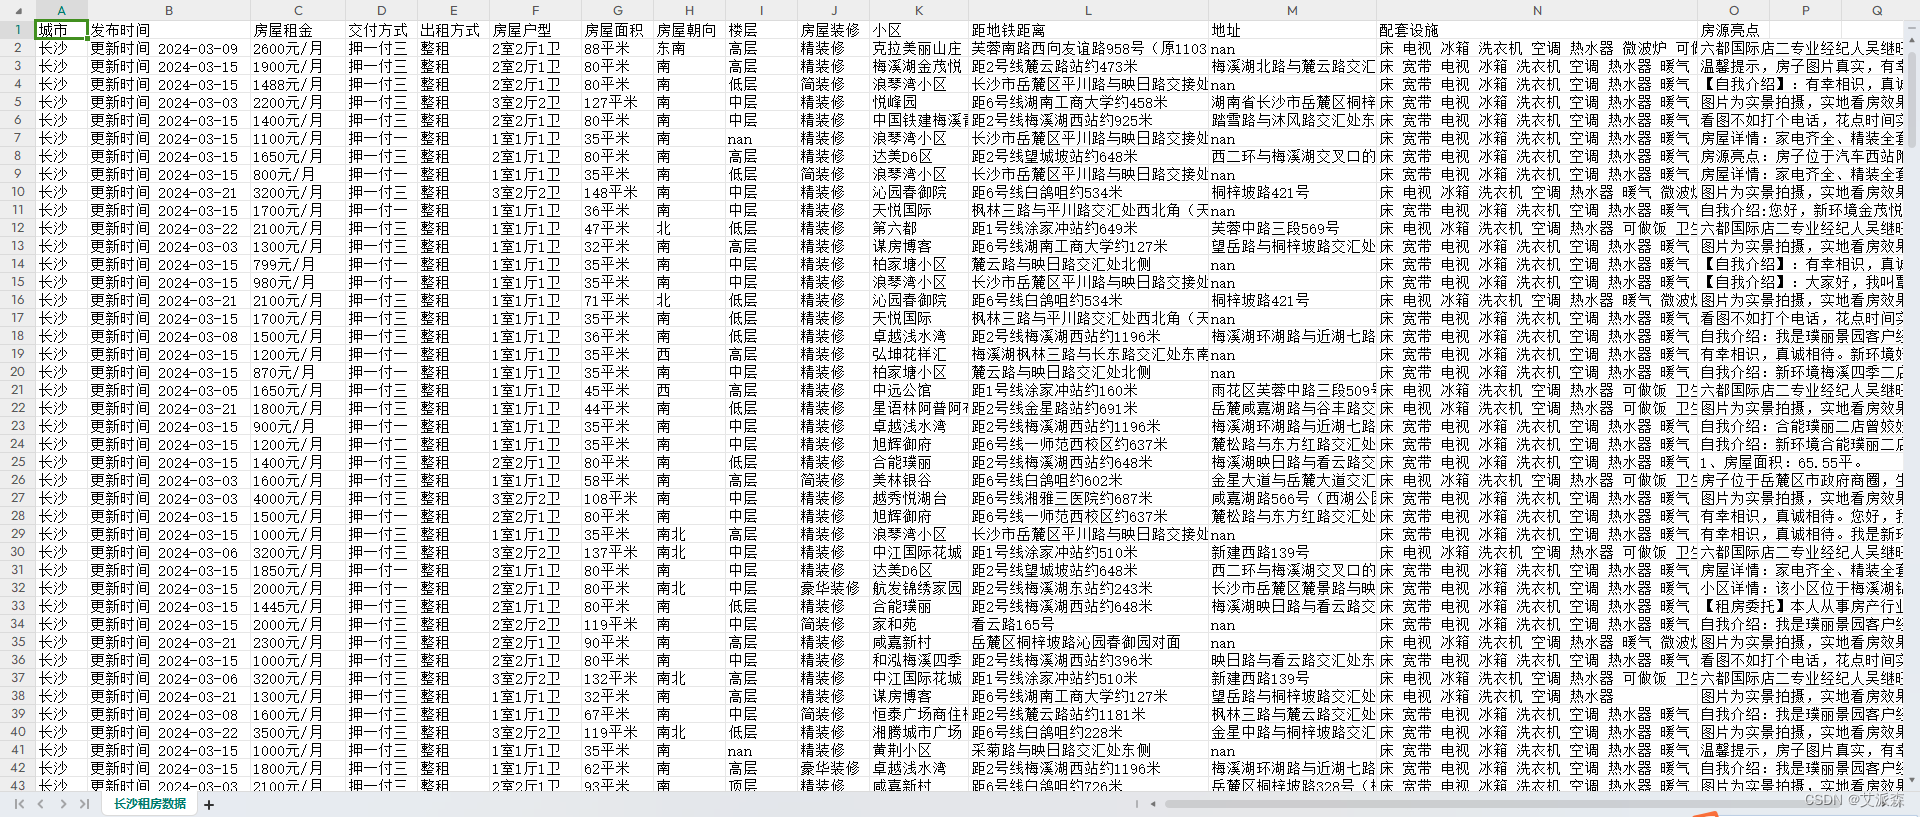
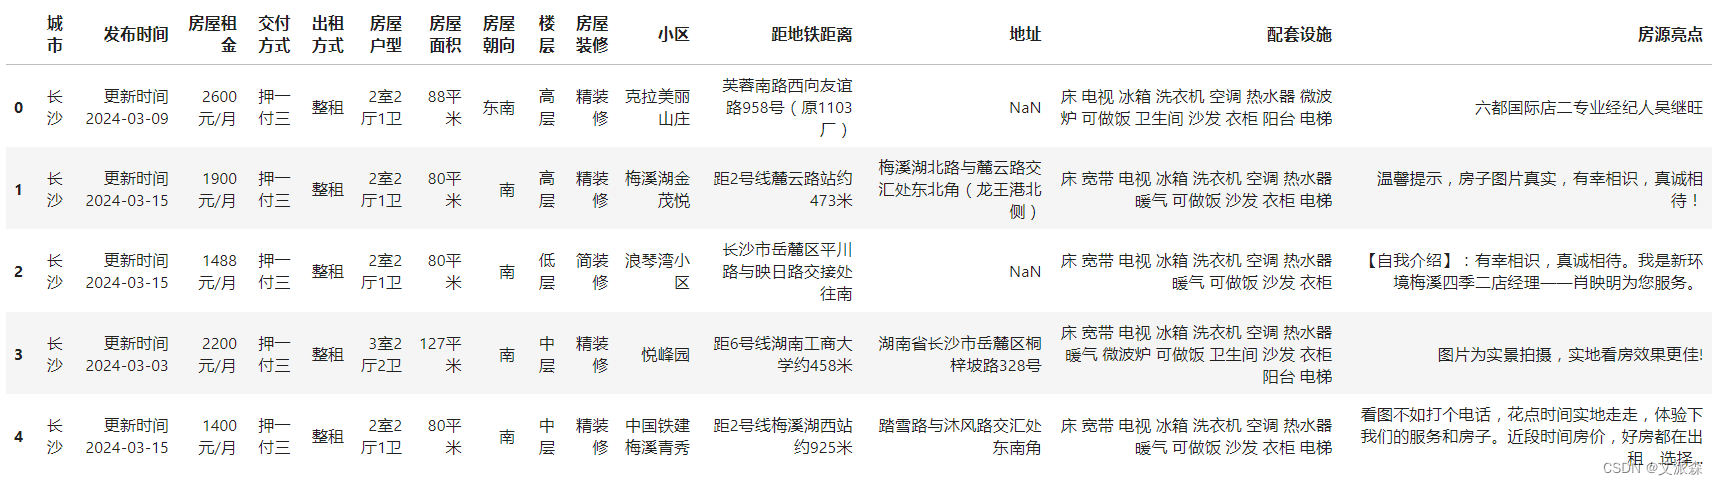
本实验数据集来源于房天下官网,通过使用python爬虫获取了长沙市的租房数据
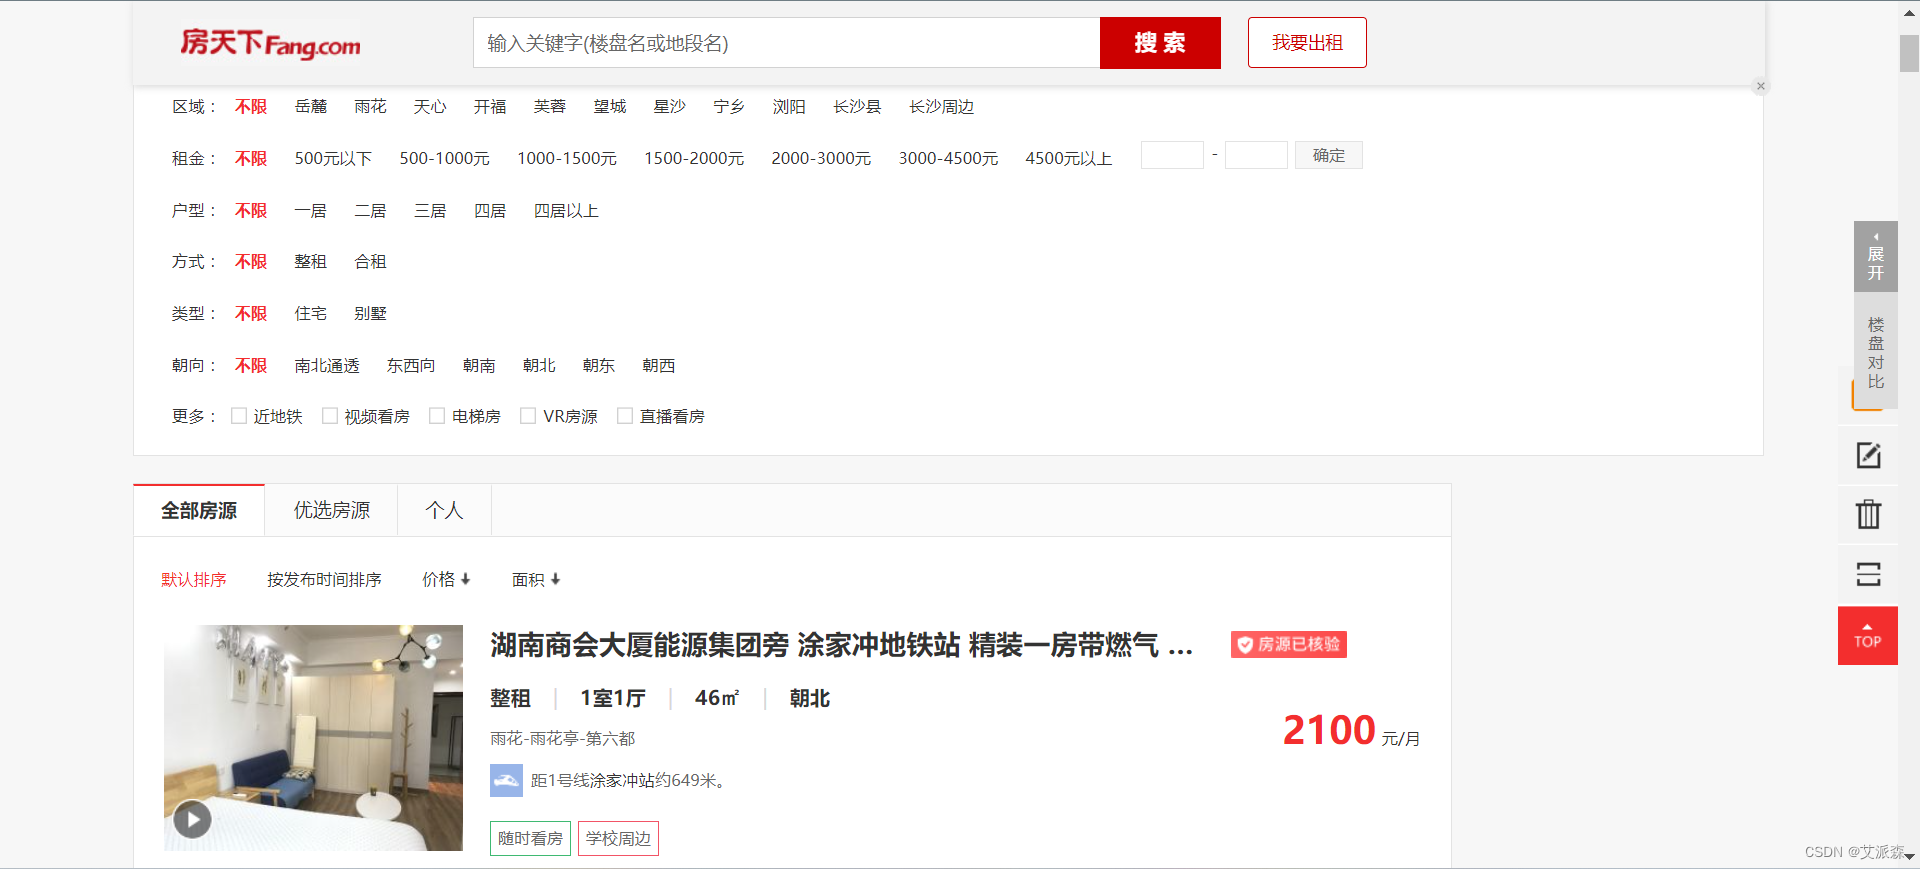
获取了房屋租金、交付方式、房屋户型、房屋面积、装修情况、校区、地址、配套设施、房源亮点等字段信息,具体如下图所示。
3.技术工具
Python版本:3.9
代码编辑器:jupyter notebook
4.实验过程
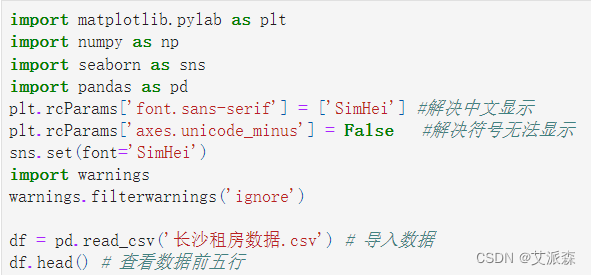
4.1导入数据
导入数据分析的第三方库并加载数据集
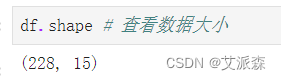
查看数据大小
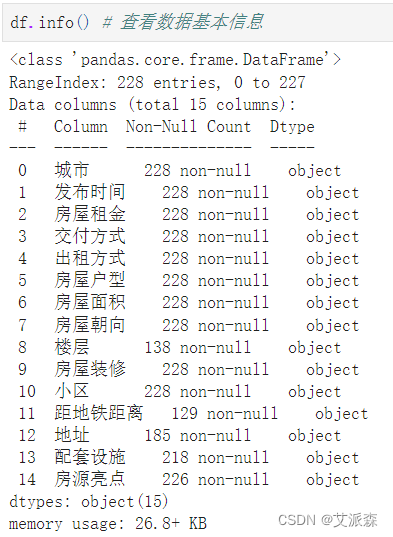
查看数据基本信息
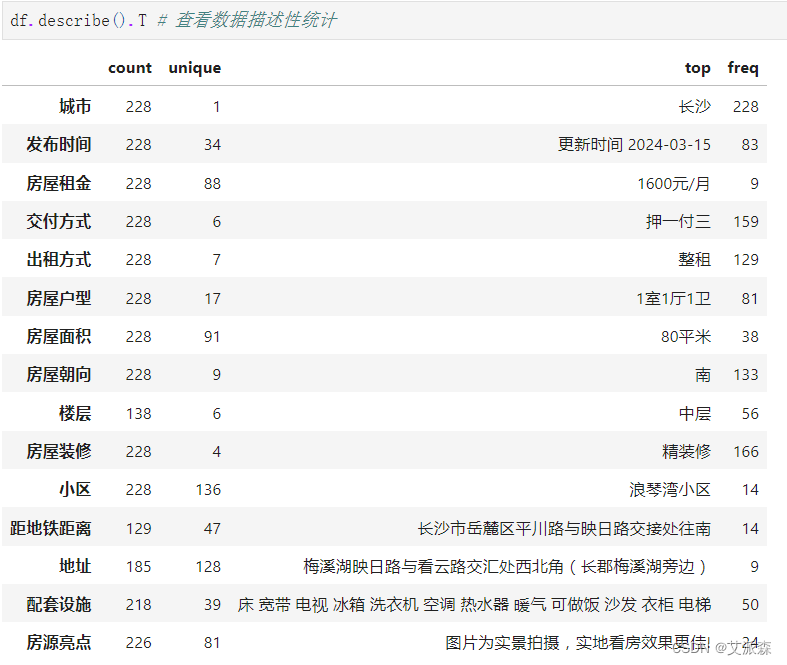
查看数据描述性统计
4.2数据预处理
统计缺失值情况
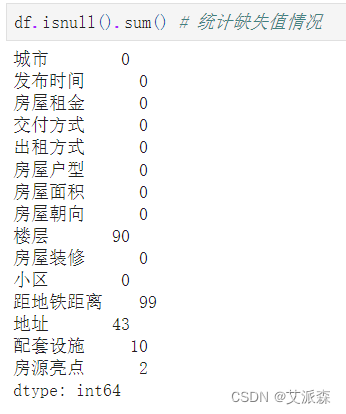
发现个别变量存在少量或大量缺失值
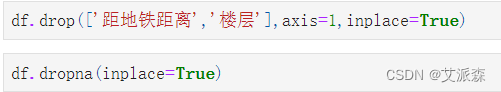
这里我们先直接删除"楼层"和"距地铁距离"这两个变量(因为这两个变量缺失值较多),最后统一删除缺失值
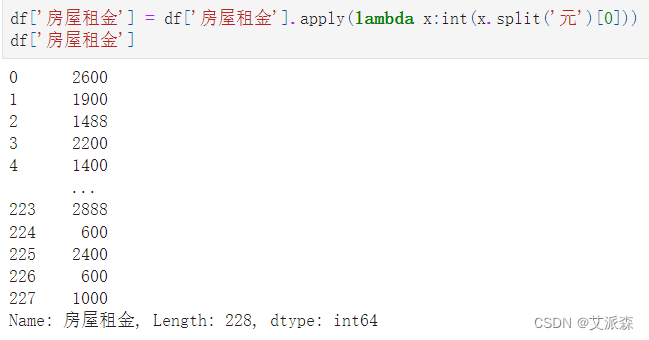
处理"房屋租金"变量,只提取出金额数值
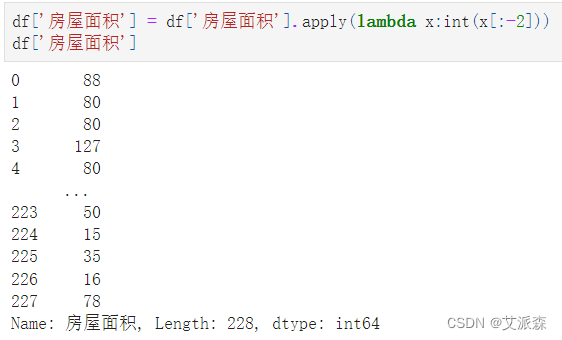
处理房屋面积,只提取出数值
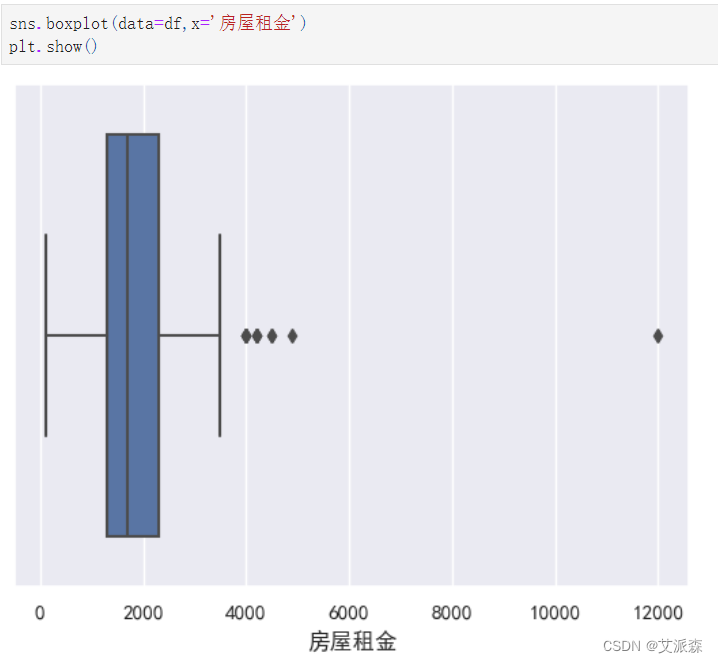
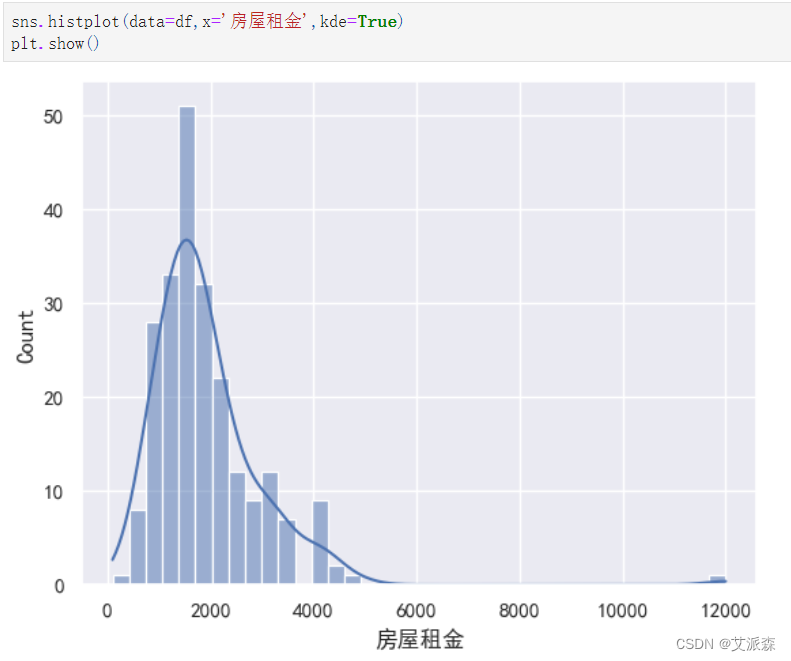
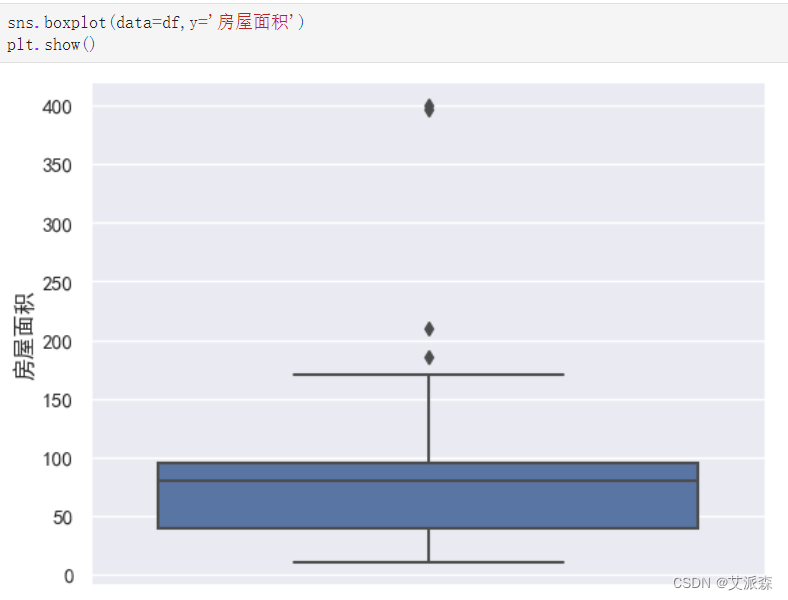
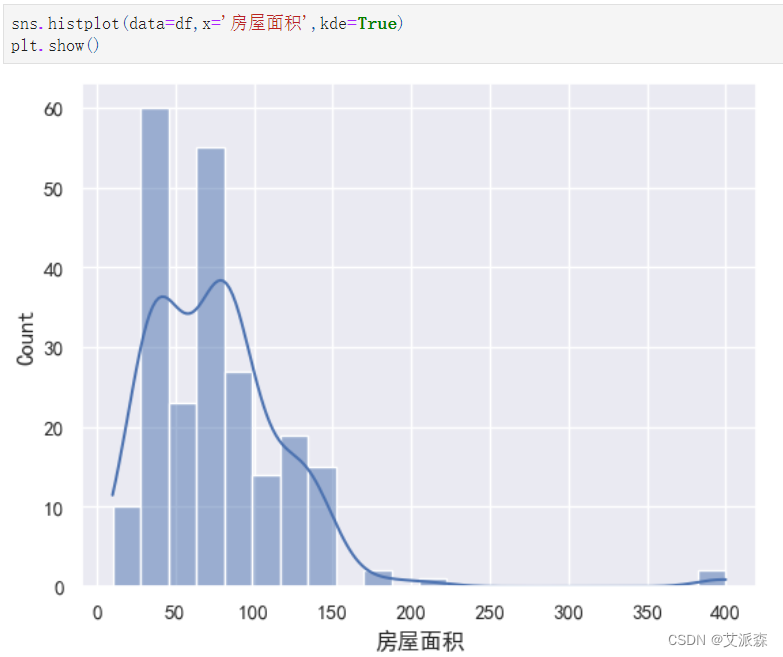
4.3数据可视化
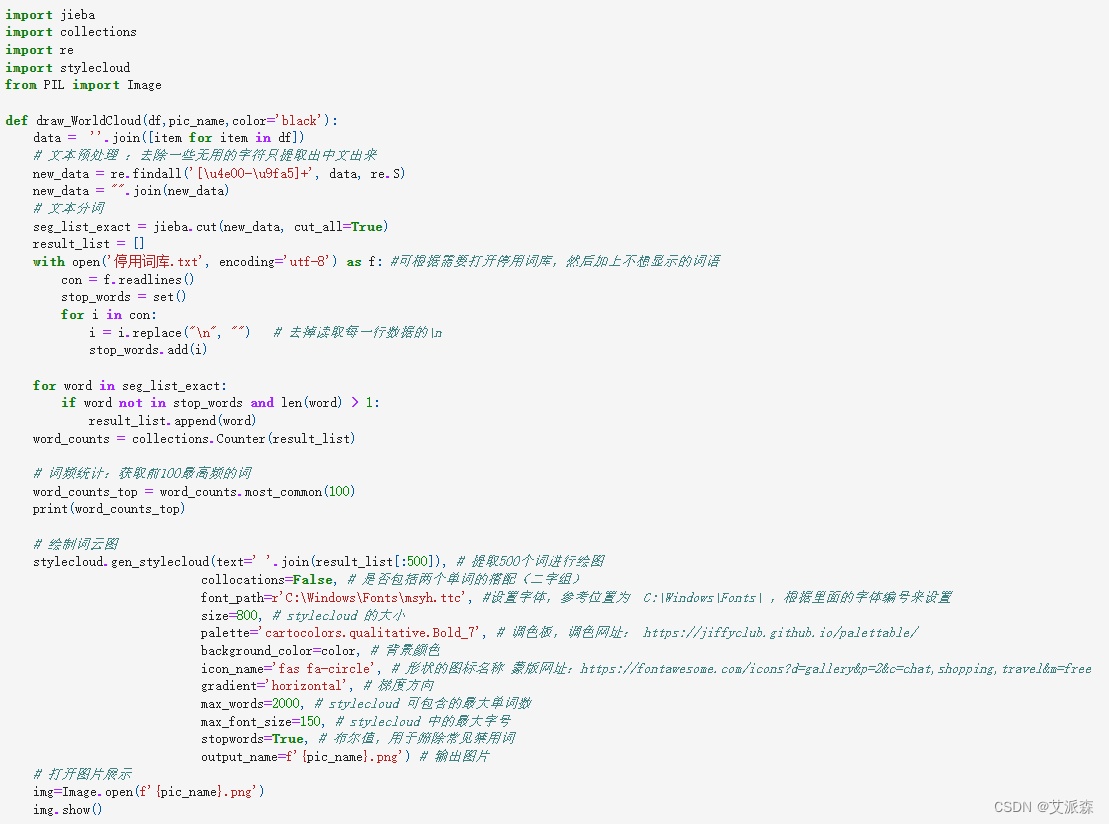
自定义一个画词云图的函数
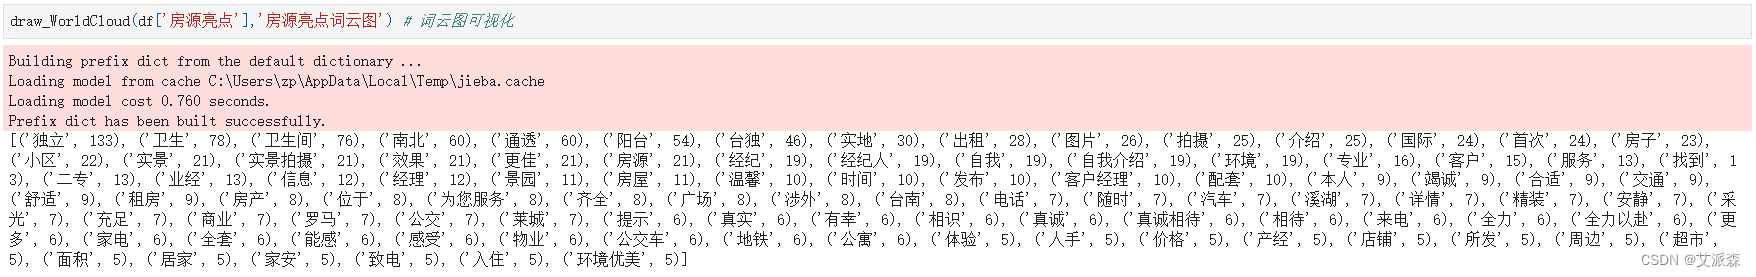
做出房源亮点词云图

做出配套设施词云图


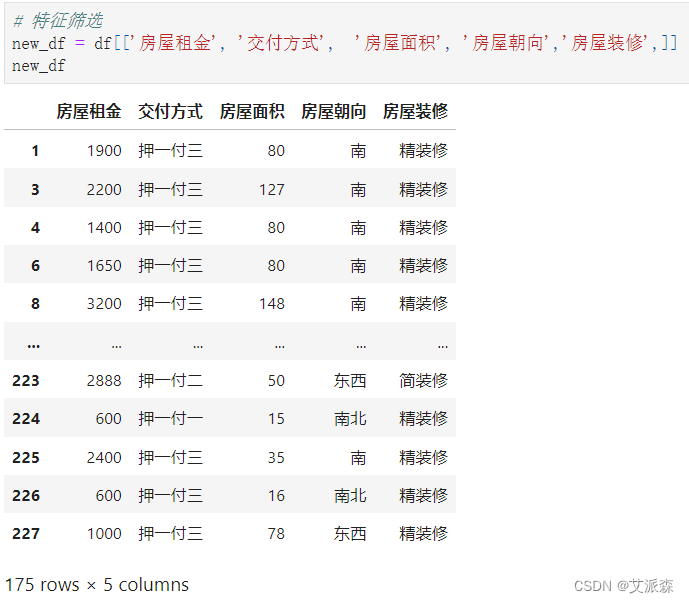
4.4特征工程
筛选特征
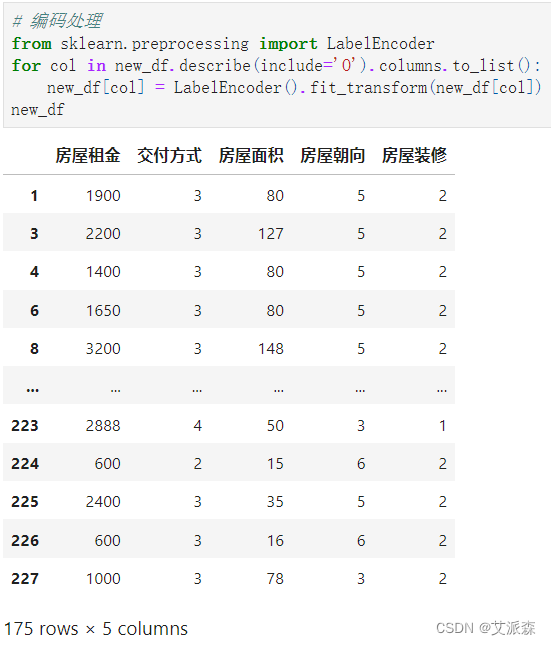
对非数值变量进行编码处理
准备建模所需数据,即特征变量X和目标变量y,接着拆分数据集为训练集和测试集,其中测试集比例为0.2

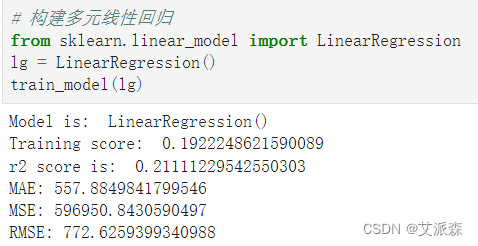
4.5构建模型
定义一个训练模型并输出模型的评估指标

构建多元回归模型
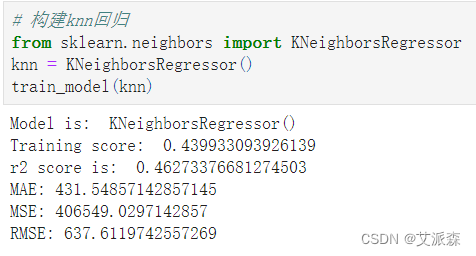
构建KNN模型

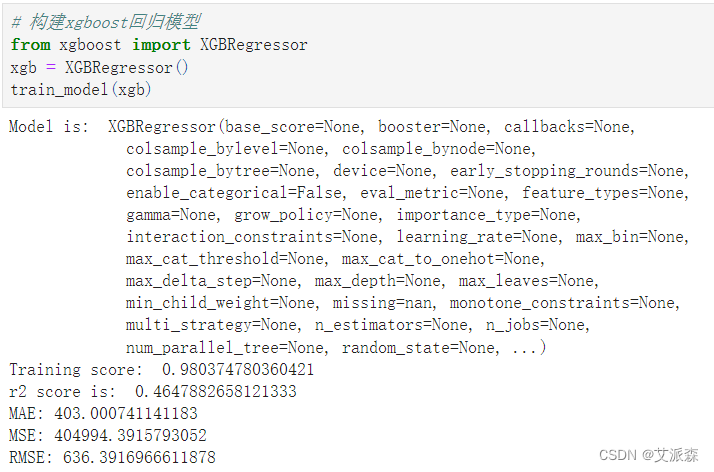
从上面构建的模型中,XGBoost模型的准确率最高,为0.98 ,故我们选择其作为最终模型。
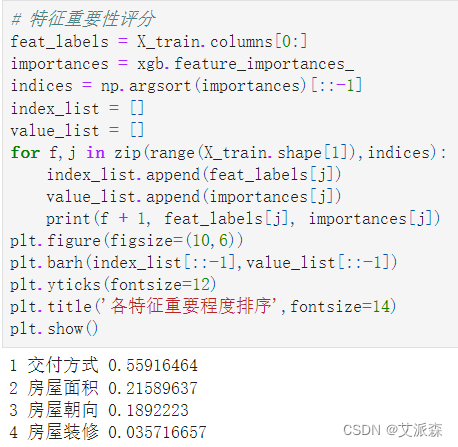
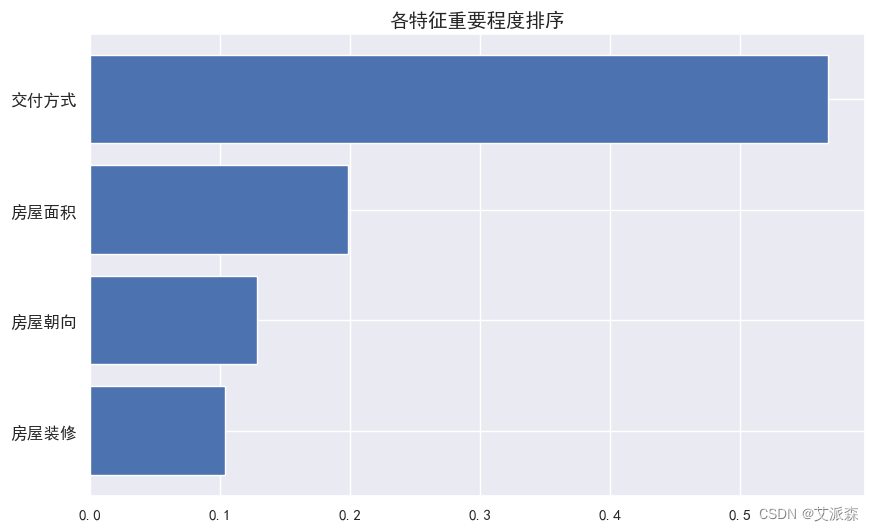
4.6特征重要性
获取模型特征重要性并排序打印输出,最后进行可视化展示
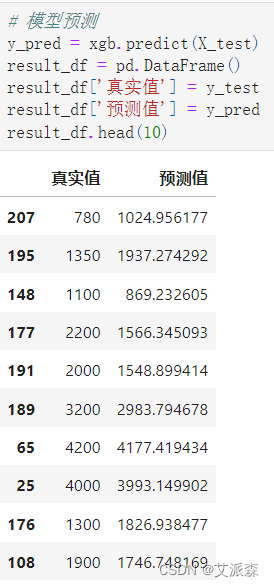
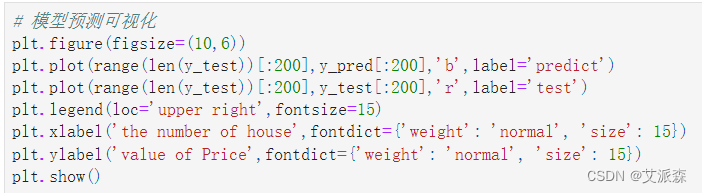
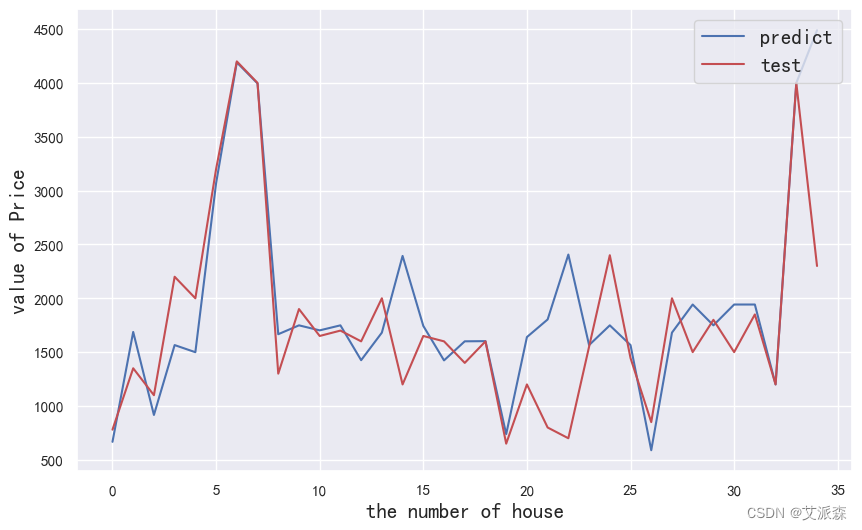
4.7模型预测
将预测结果可视化展示
源代码
python
import matplotlib.pylab as plt
import numpy as np
import seaborn as sns
import pandas as pd
plt.rcParams['font.sans-serif'] = ['SimHei'] #解决中文显示
plt.rcParams['axes.unicode_minus'] = False #解决符号无法显示
sns.set(font='SimHei')
import warnings
warnings.filterwarnings('ignore')
df = pd.read_csv('长沙租房数据.csv') # 导入数据
df.head() # 查看数据前五行
df.shape # 查看数据大小
df.info() # 查看数据基本信息
df.describe().T # 查看数据描述性统计
df.isnull().sum() # 统计缺失值情况
df.drop(['距地铁距离','楼层'],axis=1,inplace=True)
df.dropna(inplace=True)
df['房屋租金'] = df['房屋租金'].apply(lambda x:int(x.split('元')[0]))
df['房屋租金']
df['房屋面积'] = df['房屋面积'].apply(lambda x:int(x[:-2]))
df['房屋面积']
sns.boxplot(data=df,x='房屋租金')
plt.show()
sns.histplot(data=df,x='房屋租金',kde=True)
plt.show()
sns.boxplot(data=df,y='房屋面积')
plt.show()
sns.histplot(data=df,x='房屋面积',kde=True)
plt.show()
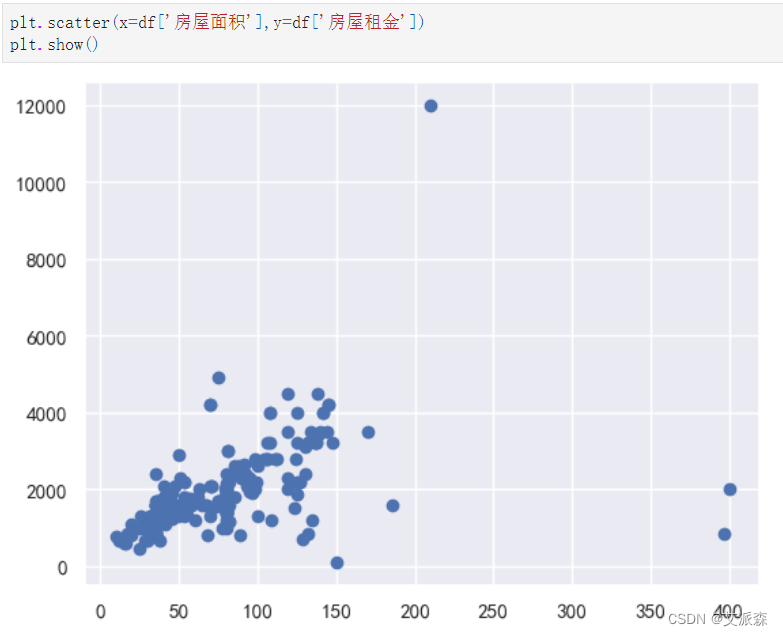
plt.scatter(x=df['房屋面积'],y=df['房屋租金'])
plt.show()
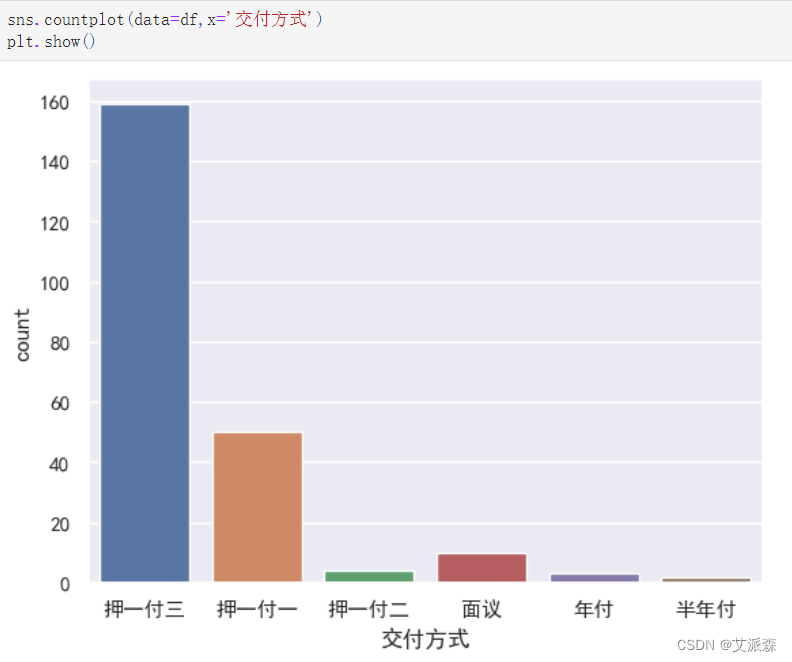
sns.countplot(data=df,x='交付方式')
plt.show()
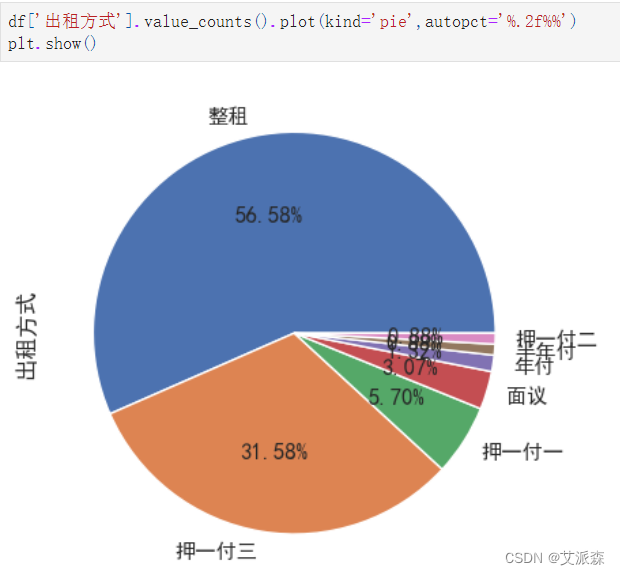
df['出租方式'].value_counts().plot(kind='pie',autopct='%.2f%%')
plt.show()
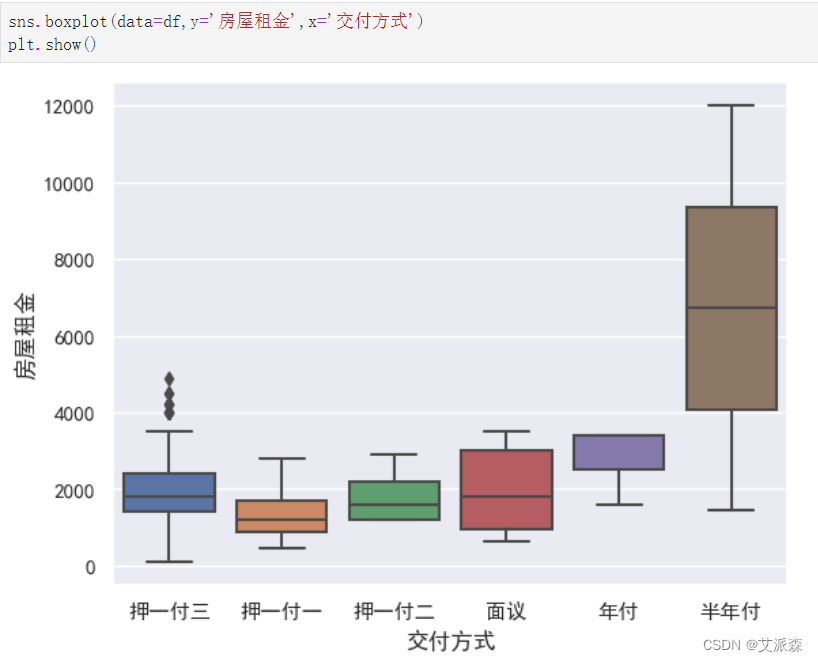
sns.boxplot(data=df,y='房屋租金',x='交付方式')
plt.show()
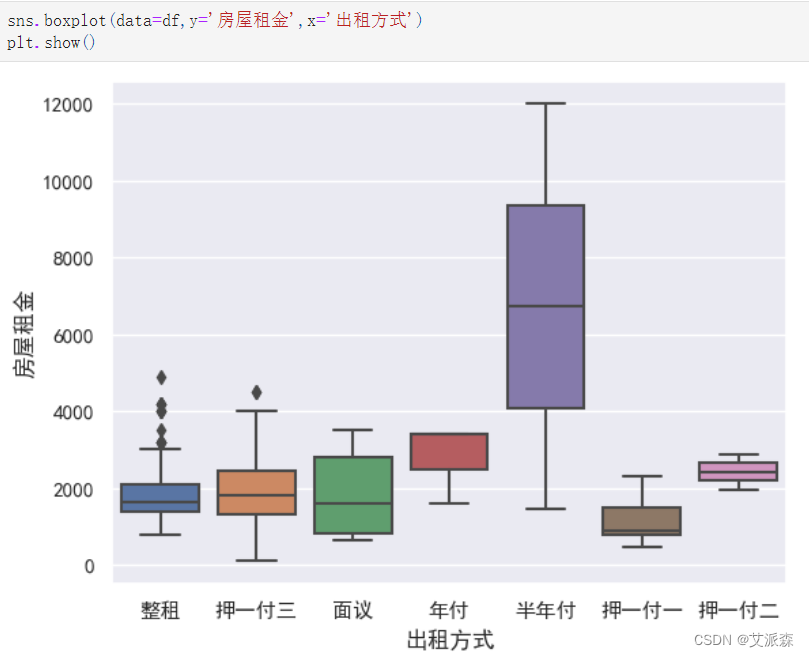
sns.boxplot(data=df,y='房屋租金',x='出租方式')
plt.show()
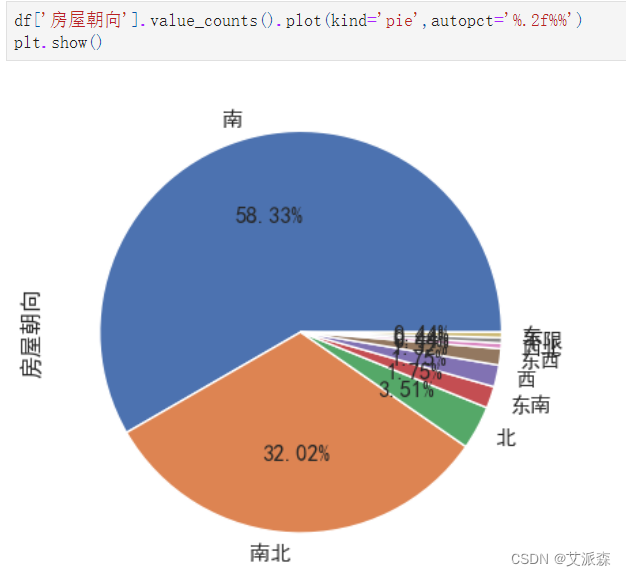
df['房屋朝向'].value_counts().plot(kind='pie',autopct='%.2f%%')
plt.show()
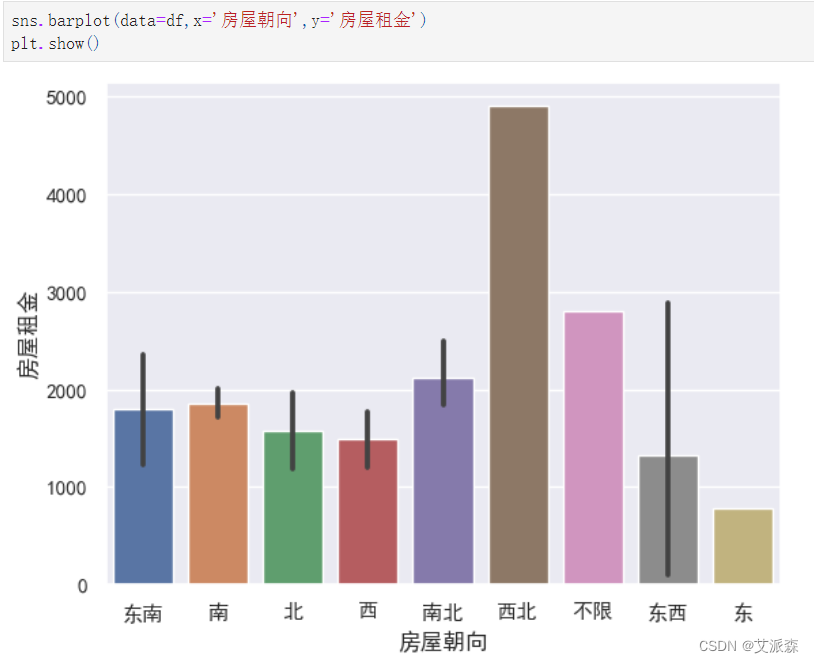
sns.barplot(data=df,x='房屋朝向',y='房屋租金')
plt.show()
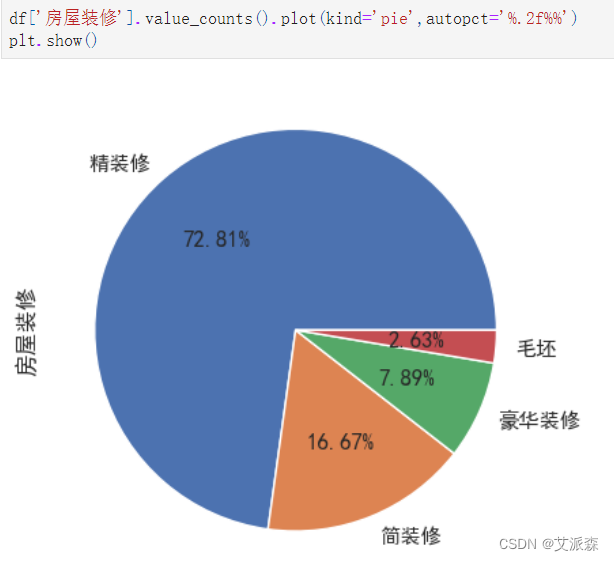
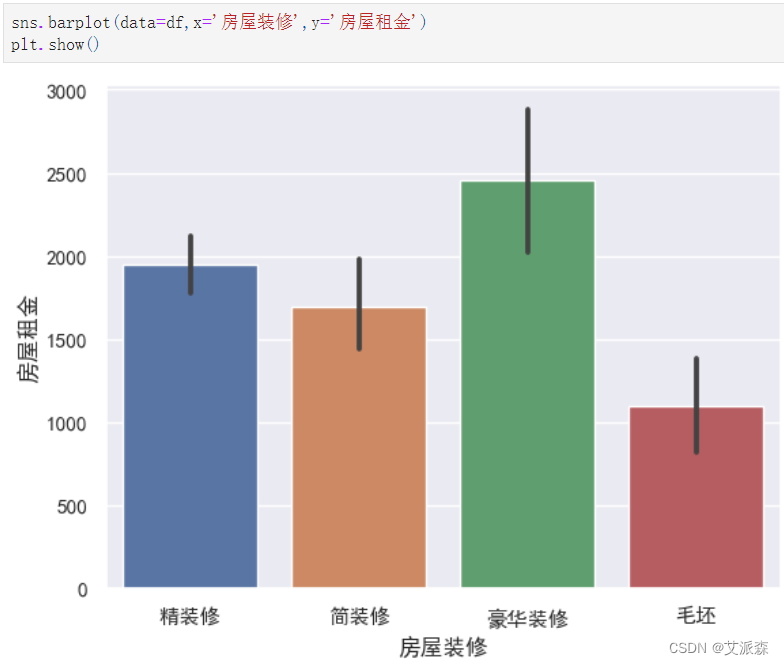
df['房屋装修'].value_counts().plot(kind='pie',autopct='%.2f%%')
plt.show()
sns.barplot(data=df,x='房屋装修',y='房屋租金')
plt.show()
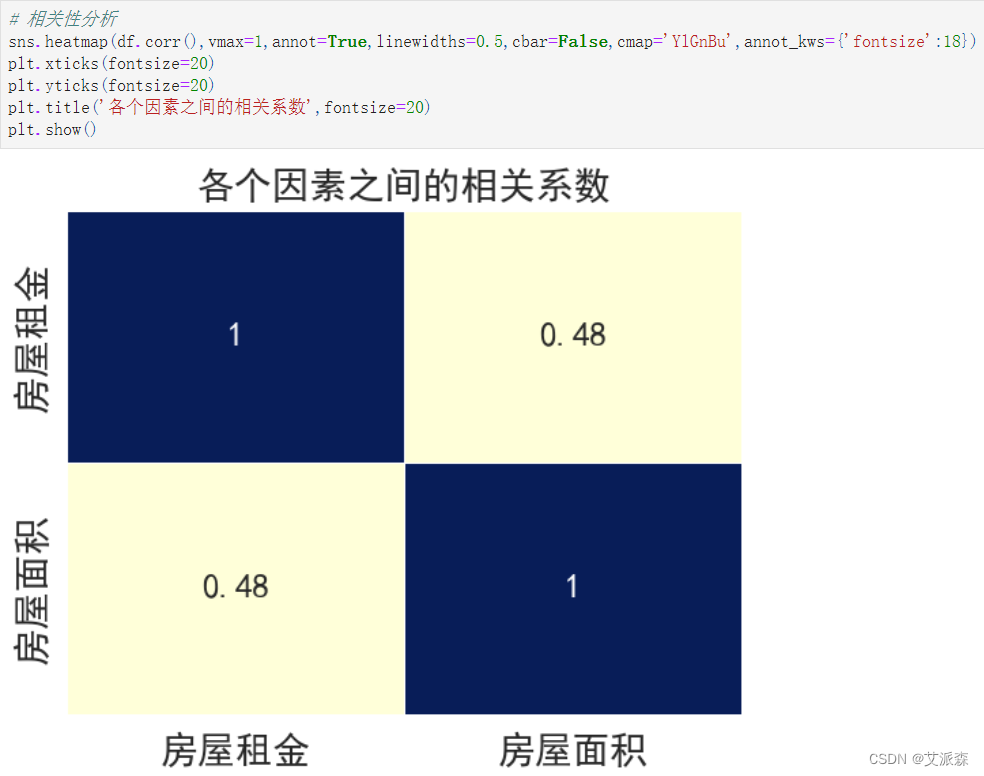
# 相关性分析
sns.heatmap(df.corr(),vmax=1,annot=True,linewidths=0.5,cbar=False,cmap='YlGnBu',annot_kws={'fontsize':18})
plt.xticks(fontsize=20)
plt.yticks(fontsize=20)
plt.title('各个因素之间的相关系数',fontsize=20)
plt.show()
import jieba
import collections
import re
import stylecloud
from PIL import Image
def draw_WorldCloud(df,pic_name,color='black'):
data = ''.join([item for item in df])
# 文本预处理 :去除一些无用的字符只提取出中文出来
new_data = re.findall('[\u4e00-\u9fa5]+', data, re.S)
new_data = "".join(new_data)
# 文本分词
seg_list_exact = jieba.cut(new_data, cut_all=True)
result_list = []
with open('停用词库.txt', encoding='utf-8') as f: #可根据需要打开停用词库,然后加上不想显示的词语
con = f.readlines()
stop_words = set()
for i in con:
i = i.replace("\n", "") # 去掉读取每一行数据的\n
stop_words.add(i)
for word in seg_list_exact:
if word not in stop_words and len(word) > 1:
result_list.append(word)
word_counts = collections.Counter(result_list)
# 词频统计:获取前100最高频的词
word_counts_top = word_counts.most_common(100)
print(word_counts_top)
# 绘制词云图
stylecloud.gen_stylecloud(text=' '.join(result_list[:500]), # 提取500个词进行绘图
collocations=False, # 是否包括两个单词的搭配(二字组)
font_path=r'C:\Windows\Fonts\msyh.ttc', #设置字体,参考位置为 C:\Windows\Fonts\ ,根据里面的字体编号来设置
size=800, # stylecloud 的大小
palette='cartocolors.qualitative.Bold_7', # 调色板,调色网址: https://jiffyclub.github.io/palettable/
background_color=color, # 背景颜色
icon_name='fas fa-circle', # 形状的图标名称 蒙版网址:https://fontawesome.com/icons?d=gallery&p=2&c=chat,shopping,travel&m=free
gradient='horizontal', # 梯度方向
max_words=2000, # stylecloud 可包含的最大单词数
max_font_size=150, # stylecloud 中的最大字号
stopwords=True, # 布尔值,用于筛除常见禁用词
output_name=f'{pic_name}.png') # 输出图片
# 打开图片展示
img=Image.open(f'{pic_name}.png')
img.show()
draw_WorldCloud(df['房源亮点'],'房源亮点词云图') # 词云图可视化
draw_WorldCloud(df['配套设施'],'配套设施词云图') # 词云图可视化
# 编码处理
df['交付方式'].replace({'押一付三':0,'押一付一':1,'面议':2,'押一付二':3,'年付':4,'半年付':5},inplace=True)
df['房屋朝向'].replace({'东':0,'南':1,'西':2,'北':3,'南北':4,'东南':5,'东西':6,'西北':7,'不限':8},inplace=True)
df['房屋装修'].replace({'毛坯':0,'简装修':1,'精装修':2,'豪华装修':3},inplace=True)
# 特征筛选
new_df = df[['房屋租金', '交付方式', '房屋面积', '房屋朝向','房屋装修',]]
new_df
from sklearn.model_selection import train_test_split
# 准备数据
X = new_df.drop('房屋租金',axis=1)
y = new_df['房屋租金']
# 划分数据集
X_train,X_test,y_train,y_test = train_test_split(X,y,test_size=0.2,random_state=42)
print('训练集大小:',X_train.shape[0])
print('测试集大小:',X_test.shape[0])
from sklearn.metrics import r2_score,mean_absolute_error,mean_squared_error
# 定义一个训练模型并输出模型的评估指标
def train_model(ml_model):
print("Model is: ", ml_model)
model = ml_model.fit(X_train, y_train)
print("Training score: ", model.score(X_train,y_train))
predictions = model.predict(X_test)
r2score = r2_score(y_test, predictions)
print("r2 score is: ", r2score)
print('MAE:', mean_absolute_error(y_test,predictions))
print('MSE:', mean_squared_error(y_test,predictions))
print('RMSE:', np.sqrt(mean_squared_error(y_test,predictions)))
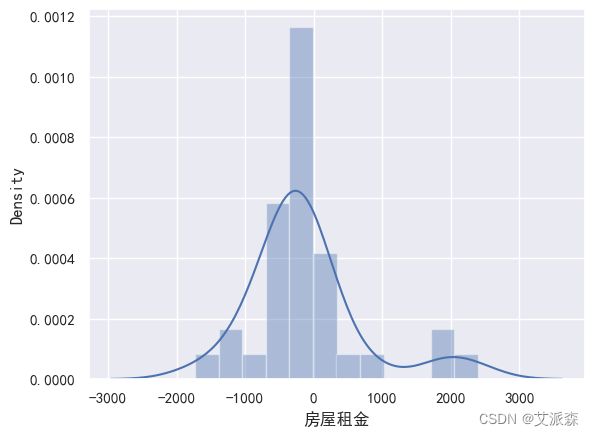
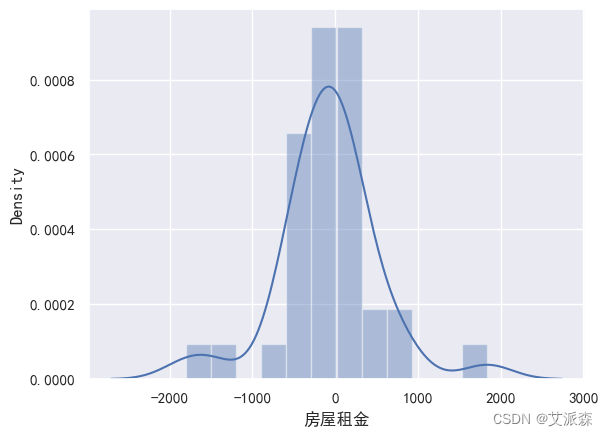
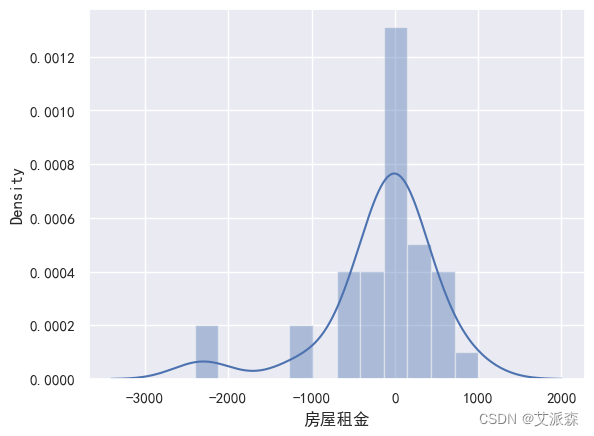
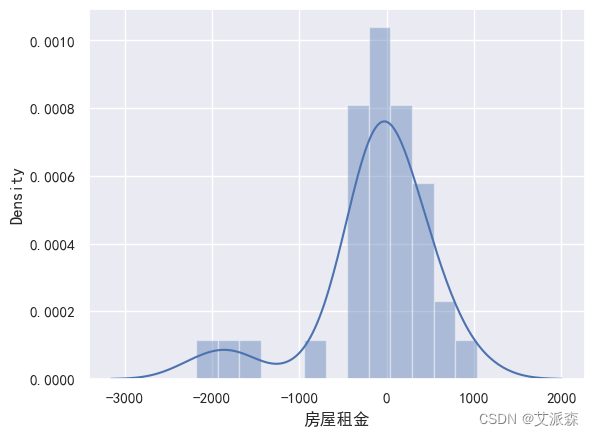
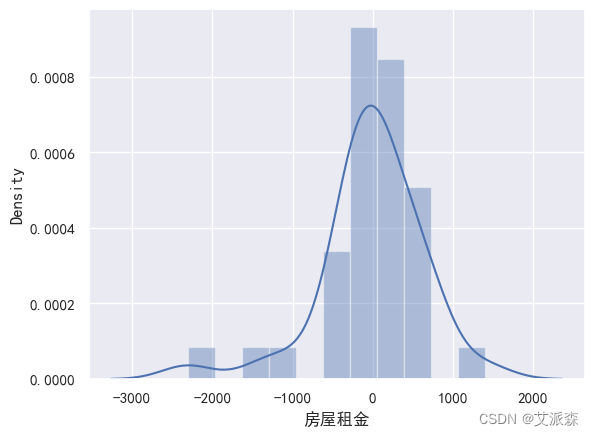
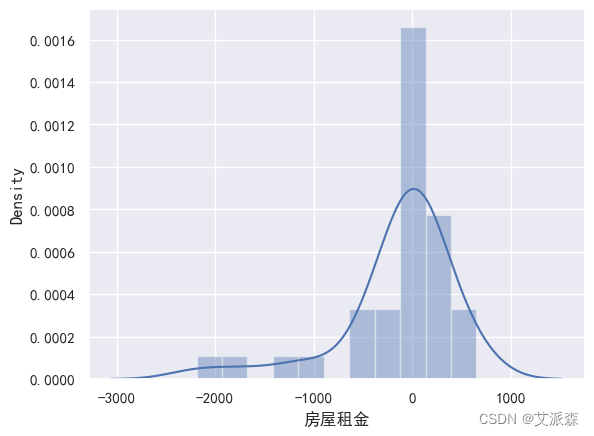
# 真实值和预测值的差值
sns.distplot(y_test - predictions)
# 构建多元线性回归
from sklearn.linear_model import LinearRegression
lg = LinearRegression()
train_model(lg)
# 构建knn回归
from sklearn.neighbors import KNeighborsRegressor
knn = KNeighborsRegressor()
train_model(knn)
# 构建决策树回归
from sklearn.tree import DecisionTreeRegressor
tree = DecisionTreeRegressor()
train_model(tree)
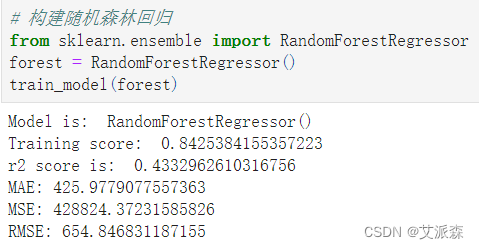
# 构建随机森林回归
from sklearn.ensemble import RandomForestRegressor
forest = RandomForestRegressor()
train_model(forest)
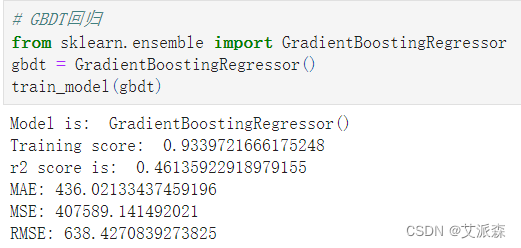
# GBDT回归
from sklearn.ensemble import GradientBoostingRegressor
gbdt = GradientBoostingRegressor()
train_model(gbdt)
# 构建xgboost回归模型
from xgboost import XGBRegressor
xgb = XGBRegressor()
train_model(xgb)
# 特征重要性评分
feat_labels = X_train.columns[0:]
importances = xgb.feature_importances_
indices = np.argsort(importances)[::-1]
index_list = []
value_list = []
for f,j in zip(range(X_train.shape[1]),indices):
index_list.append(feat_labels[j])
value_list.append(importances[j])
print(f + 1, feat_labels[j], importances[j])
plt.figure(figsize=(10,6))
plt.barh(index_list[::-1],value_list[::-1])
plt.yticks(fontsize=12)
plt.title('各特征重要程度排序',fontsize=14)
plt.show()
# 模型预测
y_pred = xgb.predict(X_test)
result_df = pd.DataFrame()
result_df['真实值'] = y_test
result_df['预测值'] = y_pred
result_df.head(10)
# 模型预测可视化
plt.figure(figsize=(10,6))
plt.plot(range(len(y_test))[:200],y_pred[:200],'b',label='predict')
plt.plot(range(len(y_test))[:200],y_test[:200],'r',label='test')
plt.legend(loc='upper right',fontsize=15)
plt.xlabel('the number of house',fontdict={'weight': 'normal', 'size': 15})
plt.ylabel('value of Price',fontdict={'weight': 'normal', 'size': 15})
plt.show()
import joblib
joblib.dump(xgb,'model.pkl')
new_df
x_data = pd.DataFrame(data=[['面议',141,'南','简装修']],columns=['交付方式','房屋面积','房屋朝向','房屋装修'])
x_data
# 编码处理
x_data['交付方式'].replace({'押一付三':0,'押一付一':1,'面议':2,'押一付二':3,'年付':4,'半年付':5},inplace=True)
x_data['房屋朝向'].replace({'东':0,'南':1,'西':2,'北':3,'南北':4,'东南':5,'东西':6,'西北':7,'不限':8},inplace=True)
x_data['房屋装修'].replace({'毛坯':0,'简装修':1,'精装修':2,'豪华装修':3},inplace=True)
x_data
model = joblib.load('model.pkl')
result = model.predict(x_data)[0]
result资料获取,更多粉丝福利,关注下方公众号获取