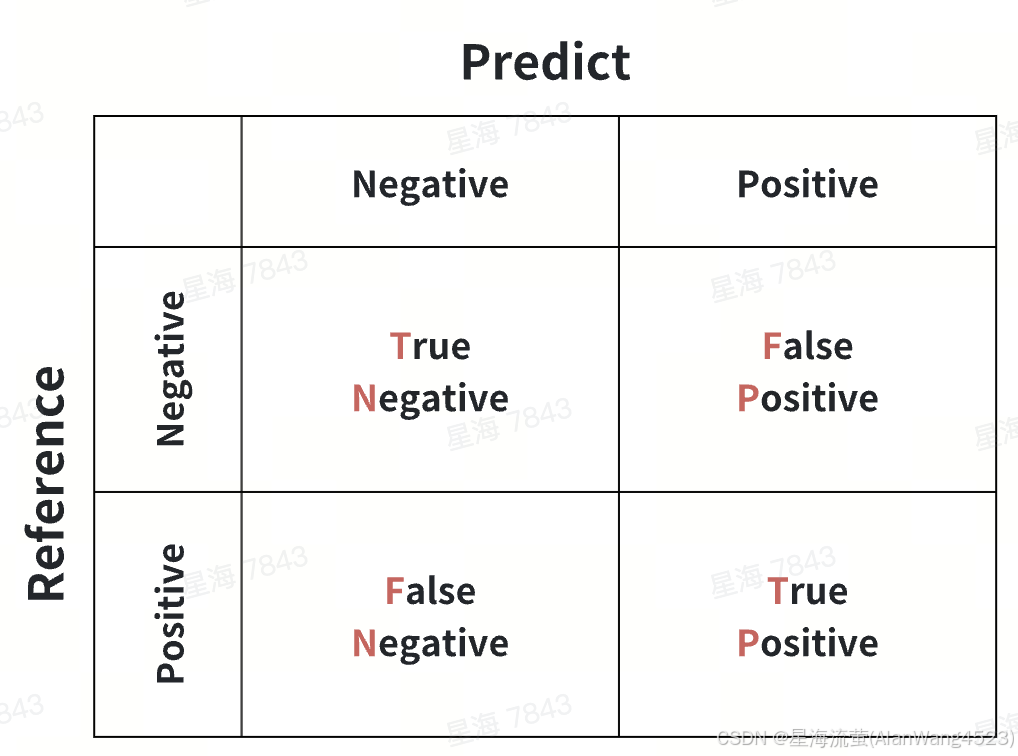
一、混淆矩阵

- True Negative (TN): 真负类,样本的真实类别是负类,并且模型将其识别为负类,cm[0][0]。
- False Positive (FP): 假正类,样本的真实类别是负类,但是模型将其识别为正类,cm[0][1]。
- False Negative (FN):假负类,样本的真实类别是正类,但是模型将其识别为负类,cm[1][0]。
- True Positive (TP): 真正类,样本的真实类别是正类,并且模型将其识别为正类,cm[1][1]。
python
from sklearn.metrics import confusion_matrix:

By definition a confusion matrix :math:`C` is such that :math:`C_{i, j}`
is equal to the number of observations known to be in group :math:`i` and
predicted to be in group :math:`j`.in binary classification, the count of
true negatives is:math:`C_{0,0}`,
false negatives is :math:`C_{1,0}`,
true positives is:math:`C_{1,1}` and
false positives is :math:`C_{0,1}`
二、根据混响矩阵计算分类指标
对于二分类问题,可以将样例根据其真实类别与机器学习器预测类别的组合划分为:TN、FP、FN、TP。
样例总数 = TN + FP + FN + TP。
2.1 精确率(Accuracy)
精确率是最常用的分类性能指标,可以用来表示模型的精度,即模型识别正确的个数/样本的总个数。一般情况下,模型的精度越高,说明模型的效果越好。
A c c u r a c y = T P + T N T N + F P + F N + T P = 预测正确的 ( 正类 + 负类 ) 样本数 总样本数 = 预测正确的样本数 总样本数 \mathbf{Accuracy=\frac{TP+TN}{TN + FP + FN + TP}=\frac{预测正确的(正类+负类)样本数}{\color{blue} 总样本数}=\frac{预测正确的样本数}{\color{blue} 总样本数}} Accuracy=TN+FP+FN+TPTP+TN=总样本数预测正确的(正类+负类)样本数=总样本数预测正确的样本数
2.2 召回率(Recall)
召回率又称为查全率,表示的是,模型正确识别出为正类的样本的数量占总的正类样本数量的比值。一般情况下,Recall越高,说明有更多的正类样本被模型预测正确,模型的效果越好。
Recall(召回率) = Sensitivity(敏感指标,True Positive Rate,TPR)= 查全率
R e c a l l = T P T P + F N = 预测正确的正类样本数 正类正确预测为正类 + 正类误认为负类 = 预测正确的正类样本数 真实为正类的样本数 \mathbf{Recall=\frac{TP}{TP + FN}=\frac{预测正确的正类样本数}{正类正确预测为正类+正类误认为负类}=\frac{预测正确的正类样本数}{\color{blue} 真实为正类的样本数}} Recall=TP+FNTP=正类正确预测为正类+正类误认为负类预测正确的正类样本数=真实为正类的样本数预测正确的正类样本数
2.3 正确率/准确率(Precision)
又称为查准率,表示在模型识别为正类的样本中,真正为正类的样本所占的比例。
P r e c i s i o n = T P T P + F P = 预测正确的正类样本数 预测正确的正类 + 负类误认为正类 = 预测正确的正类样本数 预测为正类的样本数 \mathbf{Precision=\frac{TP}{TP + FP}=\frac{预测正确的正类样本数}{预测正确的正类+负类误认为正类}=\frac{预测正确的正类样本数}{\color{blue} 预测为正类的样本数}} Precision=TP+FPTP=预测正确的正类+负类误认为正类预测正确的正类样本数=预测为正类的样本数预测正确的正类样本数
参考链接: