Prometheus + Grafana 的组合在微服务项目中可以完成许多DevOps任务,它们共同提供了强大的监控和可视化功能。
我们陆续介绍Prometheus + Grafana 的相关用法。
上一期,我们介绍了Prometheus+Grafana的安装,
Prometheus+Grafana保姆笔记(1)------Prometheus+Grafana的安装
本期我们介绍监控Spring Boot微服务程序。
一、添加Spring Boot Actuator
在spring boot程序中,我们在pom.xml添加Spring Web, Spring Boot Actuator, 和 Micrometer Prometheus依赖
XML
        <dependency>
            <groupId>org.springframework.boot</groupId>
            <artifactId>spring-boot-starter-web</artifactId>
        </dependency>

        <dependency>
            <groupId>org.springframework.boot</groupId>
            <artifactId>spring-boot-starter-actuator</artifactId>
        </dependency>
        <dependency>
            <groupId>io.micrometer</groupId>
            <artifactId>micrometer-registry-prometheus</artifactId>
        </dependency>
二、配置application.properties
XML
server.port=8080
management.endpoints.web.exposure.include=*
management.endpoint.metrics.tags.application=${spring.application.name}
management.endpoint.prometheus.enabled=true
请注意,这个配置将暴露所有 Actuator 端点,包括 /**。如果你只想暴露特定的端点,你可以将 include 设置为这些端点的名称,例如 include: 'health', 'info'。
三、验证Actuator端点
- 打开浏览器,访问http://localhost:8080/actuator,你应该能看到一个包含/prometheus端点的JSON响应。
- 访问http://localhost:8080/actuator/prometheus,你应该能看到Prometheus格式的监控数据。
发现这些数据查询结果都是200,代表成功啦。
四、配置Prometheus
编辑Prometheus配置文件:
-
Prometheus的配置文件通常是
prometheus.yml,位于Prometheus安装目录的config子目录中。 -
编辑该文件,添加一个作业(job)来抓取Spring Boot应用的监控数据:
XML
scrape_configs:
  - job_name: 'demo-app'
    metrics_path: '/actuator/prometheus'
    static_configs:
- targets: ['localhost:8080']启动Prometheus:
- 根据你的安装方式(二进制包、Docker容器等),启动Prometheus服务。
- 确保Prometheus正在监听其配置的端口(默认为9090)。
验证Prometheus抓取数据:
- 访问Prometheus的Web界面(
http://localhost:9090)。 - 在Status -> Targets页面中,检查
demo-app作业的状态是否为UP,并且Scrapes(抓取次数)在增加。
五、配置Grafana
启动Grafana:
- 根据你的安装方式启动Grafana服务。
- 访问Grafana的Web界面(
http://localhost:3000),使用默认的用户名和密码(通常是admin/admin)登录。
添加Prometheus数据源:
- 在Grafana中,点击左侧的"Configuration" -> "Data Sources",然后点击"Add data source"。
- 选择"Prometheus"作为数据源类型,并填写Prometheus服务的URL(
http://localhost:9090)。 - 保存数据源配置。
创建仪表盘:
- 点击左侧的"Dashboards" -> "New dashboard"创建一个新的仪表盘。
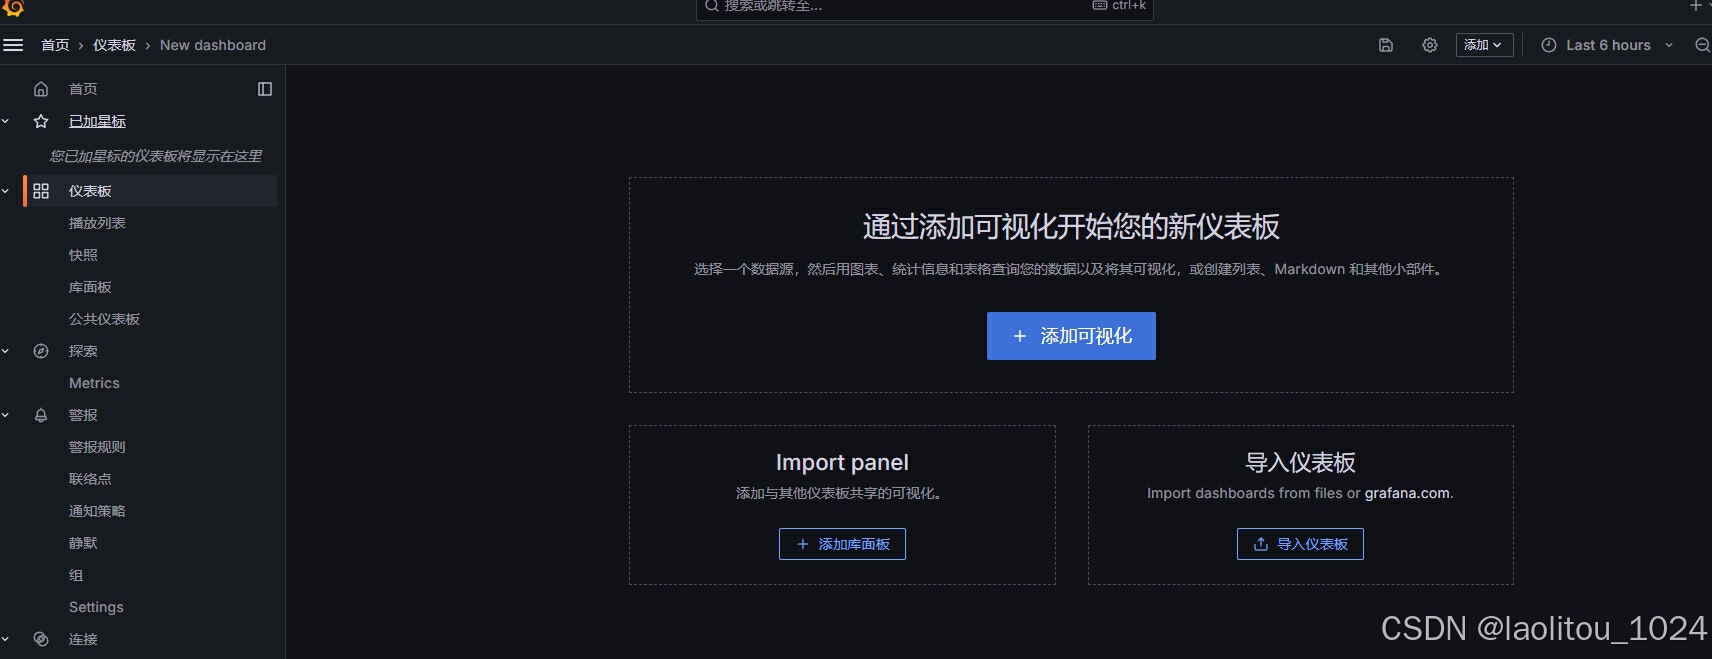
你可以"添加可视化"来DIY一套自己的监控图表界面,使用Grafana的查询编辑器(Query Editor)来编写PromQL查询,并添加图表和面板来展示API的响应时间等监控数据。
但是往往你的主要需求,就是大众的需求 ,群众已经帮我们开源好啦。你可以通过上图右下角的"导入仪表盘"来导入一套适合spring boot微服务项目的现成开源模板
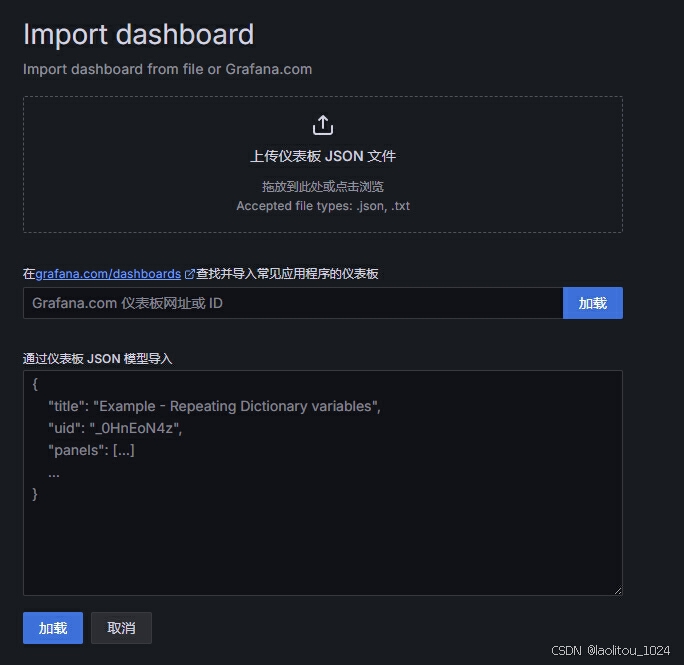
输入SpringBoot APM Dashboard(中文版本)地址
XML
https://grafana.com/grafana/dashboards/21319-springboot-apm-dashboard/加载后,选择数据源 Prometheus,就可以生成漂亮又全面的监控大盘啦
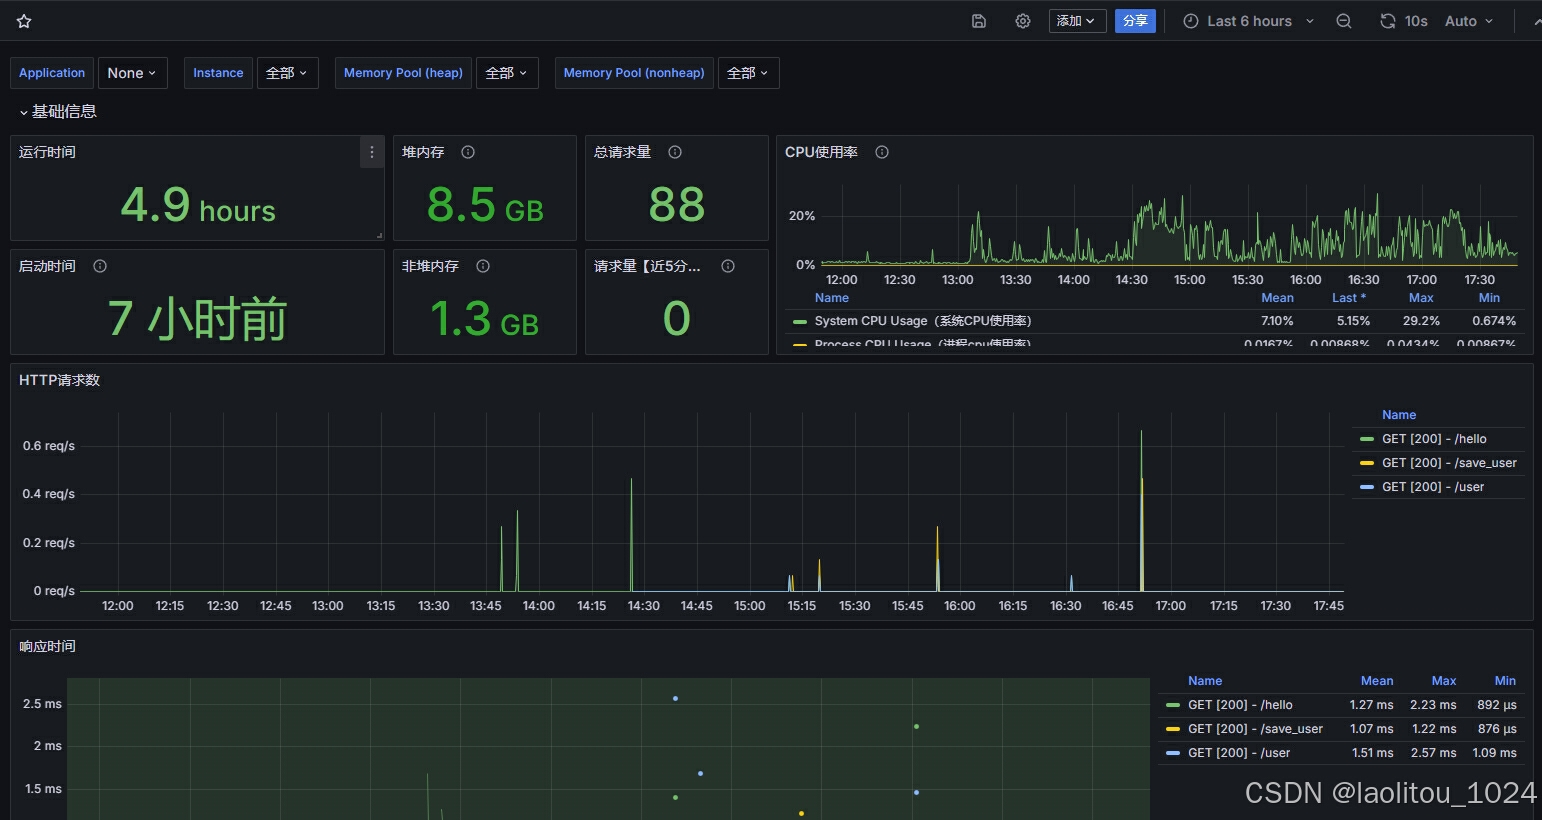
通过以上步骤,你成功地搭建了一个使用Prometheus + Grafana + Spring Boot Actuator来监控Spring Boot微服务。你可以查看各种指标,如 CPU 使用率、内存使用量、HTTP 请求等,并根据实际需求进一步定制和优化监控配置。
OK,先这样,下期我们试试Prometheus + Grafana来监控MySQL.