文章目录
- 一、prometheus监控对外服务
-
- [1.1 blackbox_exporter安装](#1.1 blackbox_exporter安装)
- [1.2 prometheus配置](#1.2 prometheus配置)
-
- [(1) prometheus.yml配置](#(1) prometheus.yml配置)
- [(2) blackbox_alerts.yml配置](#(2) blackbox_alerts.yml配置)
- [1.3 Grafana配置](#1.3 Grafana配置)
一、prometheus监控对外服务
prometheus监控对外服务需要使用blackbox_exporter组件,该组件能主要用于提供对外部服务的"黑盒监控"。即,监控者并不直接访问服务的内部实现(例如,数据库的状态或者应用的内部指标),而是从外部对服务进行简单的可用性检测,比如:
- HTTP(S) 服务的可用性:检查 HTTP 服务是否返回正常的响应。
- TCP 连接是否可用:检查 TCP 服务是否能够正常连接。
- DNS 查询的可用性:检查 DNS 服务的响应。
- SMTP、POP3、IMAP 服务可用性:监控邮件服务的端口是否响应。
Blackbox Exporter 通过向指定的端口发送请求,并根据返回结果来确定服务是否健康。这种方式适用于你并不希望直接暴露应用内部的指标数据,而只是希望监控其外部可用性。
1.1 blackbox_exporter安装
下载解压
blackbox_exporter下载地址:blackbox_exporter
bash
[root@localhost web]# wget https://github.com/prometheus/blackbox_exporter/releases/download/v0.24.0/blackbox_exporter-0.24.0.linux-amd64.tar.gz

[root@localhost web]# tar -xf blackbox_exporter-0.24.0.linux-amd64.tar.gz
运行测试
blackbox_exporter启动时默认加载安装目录下的配置文件blackbox.yml,如果不在安装目录启动需要指定配置文件目录
bash
[root@localhost web]# /usr/local/blackbox_exporter/blackbox_exporter --config.file=/usr/local/blackbox_exporter/blackbox.yml
ts=2025-12-25T02:10:41.058Z caller=main.go:78 level=info msg="Starting blackbox_exporter" version="(version=0.24.0, branch=HEAD, revision=0b0467473916fd9e8526e2635c2a0b1c56011dff)"
ts=2025-12-25T02:10:41.058Z caller=main.go:79 level=info build_context="(go=go1.20.4, platform=linux/amd64, user=root@e5bbfcc8184e, date=20230516-11:07:25, tags=netgo)"
ts=2025-12-25T02:10:41.059Z caller=main.go:91 level=info msg="Loaded config file"
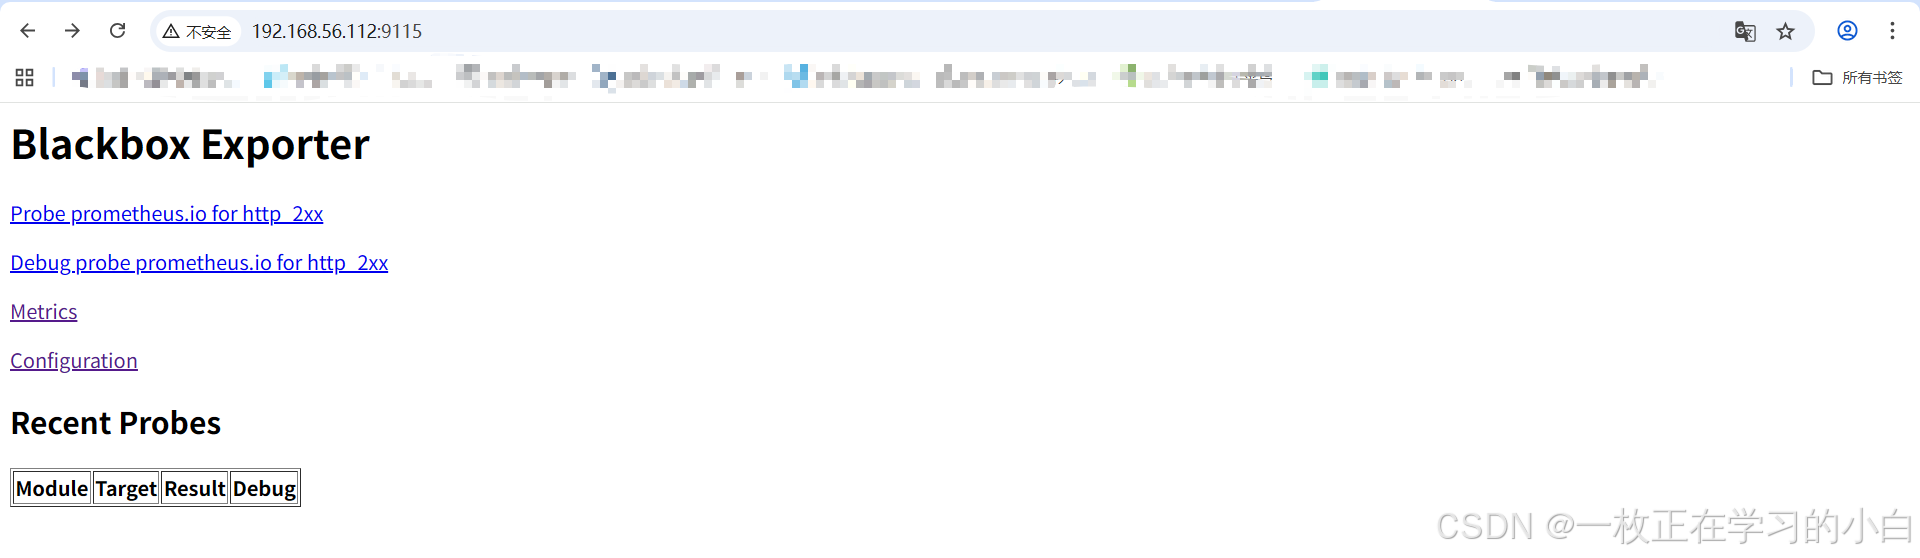
ts=2025-12-25T02:10:41.060Z caller=tls_config.go:274 level=info msg="Listening on" address=[::]:9115访问9115端口
配置blackbox_exporter服务
bash
[root@localhost web]# vim /usr/lib/systemd/system/blackbox_exporter.service
[Unit]
Description=blackbox_exporter Service
After=network.target

[Service]
Type=simple
ExecStart=/usr/local/blackbox_exporter/blackbox_exporter --config.file=/usr/local/blackbox_exporter/blackbox.yml
Restart=on-failure
RestartSec=10s

[Install]
WantedBy=multi-user.target


[root@localhost web]# systemctl daemon-reload
[root@localhost web]# systemctl restart blackbox_exporter.service
[root@localhost web]# systemctl enable blackbox_exporter.service
1.2 prometheus配置
(1) prometheus.yml配置
prometheus.yml文件中需要增加三部分配置信息 配置1:验证http返回码是否为2xx
yml
# http监控任务,验证http状态码返回是否为2xx
  - job_name: "blackbox-http"
    metrics_path: /probe
    params:
      module: [http_2xx]
    static_configs:
      - targets:
          - https://www.baidu.com
          - http://192.168.56.112:80
    relabel_configs:
      - source_labels: [__address__]
        target_label: __param_target
      - target_label: instance
        source_labels: [__param_target]
      - target_label: __address__
        replacement: 192.168.56.112:9115   # blackbox_exporter地址
配置2:验证服务端口是否可用
yml
# tcp监控任务,验证tcp端口是否可连接
  - job_name: "blackbox-tcp"
    metrics_path: /probe
    params:
      module: [tcp_connect]
    static_configs:
      - targets:
          - 192.168.56.112:22     # sshd端口
          - 192.168.56.112:3306   # mysql端口
          - 192.168.56.112:6379   # redis端口
          - 192.168.56.112:80     # nginx端口
    relabel_configs:
      - source_labels: [__address__]
        target_label: __param_target
      - target_label: instance
        source_labels: [__param_target]
      - target_label: __address__
        replacement: 192.168.56.112:9115
配置3:验证服务器是否在线(ping)
yml
  - job_name: "blackbox-ping"
    metrics_path: /probe
    params:
      module: [icmp]
    static_configs:
      - targets:
          - 8.8.8.8          # 外部地址1,验证能否访问外网
          - 1.1.1.1          # 外部地址2,验证能否访问外网
          - 192.168.56.1     # 内部网关地址,比如虚拟机配置的网关
          - 192.168.56.112   # 服务器地址1
          - 192.168.56.109   # 服务器地址2
    relabel_configs:
      - source_labels: [__address__]
        target_label: __param_target
      - target_label: instance
        source_labels: [__param_target]
      - target_label: __address__
replacement: 192.168.56.112:9115注意:探测mysql时会导致mysql一直中断连接,导致mysql中断连接次数多,探测redis时,会一直探测失败,需要在blackbox.yml文件中增加额外配置
blackbox.yml文件

promethues文件

配置完成后重启prometheus

(2) blackbox_alerts.yml配置
新增blackbox_alerts.yml文件用于配置相关告警规则
bash
vim /usr/local/prometheus/rules/blackbox_alerts.yml

groups:
- name: blackbox-alerts
  rules:

  # HTTP 服务不可用
  - alert: HTTPServiceDown
    expr: probe_success{job="blackbox-http"} == 0
    for: 1m
    labels:
      severity: critical
    annotations:
      summary: "HTTP 服务不可用: {{ $labels.instance }}"
      description: "探测失败 >=1分钟,请检查服务或网络。"

  # TCP 端口不可达
  - alert: TCPPortDown
    expr: probe_success{job="blackbox-tcp"} == 0
    for: 1m
    labels:
      severity: critical
    annotations:
      summary: "TCP 端口不可用: {{ $labels.instance }}"
      description: "端口连接失败 >=1分钟,请检查应用或防火墙。"

  # ping 不通
  - alert: HostUnreachable
    expr: probe_success{job="blackbox-ping"} == 0
    for: 2m
    labels:
      severity: warning
    annotations:
      summary: "主机不可达: {{ $labels.instance }}"
      description: "ICMP 探测失败 >=2分钟,可能网络中断。"

  # HTTP 响应时间过高
  - alert: HTTPHighLatency
    expr: probe_duration_seconds{job="blackbox-http"} > 1
    for: 2m
    labels:
      severity: warning
    annotations:
      summary: "HTTP 响应慢: {{ $labels.instance }}"
      description: "探测耗时超 1 秒,持续 2 分钟。"

  # 证书即将过期(30天内)
  - alert: SSLCertExpiringSoon
    expr: (probe_ssl_earliest_cert_expiry - time()) < 30 * 24 * 3600
    for: 10m
    labels:
      severity: warning
    annotations:
      summary: "SSL证书将过期: {{ $labels.instance }}"
      description: "证书剩余有效期不足 30 天,请尽快更新。"
  # http状态码不是2xx
  - alert: HttpCodeIsNot2xx
    expr: probe_http_status_code <=199 OR probe_http_status_code >=400
    for: 1m
    labels:
      severity: critial
    annotations:
      summary: "http状态码检测失败: {{ $labels.instance }}"
      description: "当前状态码为:{{ $value }}。"
1.3 Grafana配置
grafana仪表盘模板为7587
