Python数据分析可视化
案例效果图
py
import pandas as pd
import matplotlib.pyplot as plt
import matplotlib

# 数据
data = {
    "房型": [1, 2, 3, 4, 5, 6, 7, 8, 9, 10, 11],
    "住宅类型": ["普通宅", "普通宅", "普通宅", "非普通宅", "非普通宅", "非普通宅", "非普通宅", "非普通宅", "其他", "其他", "非普通宅"],
    "容积率": ["列入", "列入", "列入", "列入", "列入", "列入", "列入", "列入", "不列入", "不列入", "不列入"],
    "开发成本": [4263, 4323, 4532, 5288, 5268, 5533, 5685, 4323, 2663, 2791, 2982],
    "房型面积": [77, 98, 117, 145, 156, 167, 178, 126, 103, 129, 133],
    "建房套数": [250, 250, 150, 250, 250, 250, 250, 75, 150, 150, 75],
    "开发成本 (元/)": [4263, 4323, 4532, 5288, 5268, 5533, 5685, 4323, 2663, 2791, 2982],
    "售价 (元/)": [12000, 10800, 11200, 12800, 12800, 13600, 14000, 10400, 6400, 6800, 7200]
}

# 创建 DataFrame
df = pd.DataFrame(data)

# 设置中文字体
plt.rcParams['font.sans-serif'] = ['SimHei']  # 中文显示
plt.rcParams['axes.unicode_minus'] = False  # 负号显示

# 创建柱状图
plt.figure(figsize=(12, 7))

# 华尔街日报风格的颜色
colors = ['#003f5c', '#2f4b7c', '#665191', '#a05195', '#d45087',
          '#f95d6a', '#ff7c43', '#ffa600', '#ffd700', '#f0e0d0', '#c2c2c2']

# 绘制柱状图
bars = plt.bar(df["房型"].astype(str), df["建房套数"], color=colors, edgecolor='black')

# 添加数据标签
for bar in bars:
    yval = bar.get_height()
    plt.text(bar.get_x() + bar.get_width()/2, yval + 10, f'{yval}', ha='center', va='bottom', fontsize=10, fontweight='bold', color='black')

# 设置x轴刻度标签
plt.xticks(df["房型"].astype(str), [f'房型{i}' for i in df["房型"]], fontsize=12)

# 设置轴标签和标题
plt.ylabel('建房套数', fontsize=12)
plt.title('不同房型的建房套数', fontsize=14, fontweight='bold')

# 添加网格线
plt.grid(axis='y', linestyle='--', alpha=0.7)

# 自动调整图表边距以确保内容显示完整
plt.tight_layout()

# 显示图形
plt.show()
图形效果:

这个图的配色比较好看。
python
import pandas as pd
import matplotlib.pyplot as plt
from matplotlib import rcParams

# 数据
data = {
    "房型": [1, 2, 3, 4, 5, 6, 7, 8, 9, 10, 11],
    "住宅类型": ["普通宅", "普通宅", "普通宅", "非普通宅", "非普通宅", "非普通宅", "非普通宅", "非普通宅", "其他", "其他", "非普通宅"],
    "容积率": ["列入", "列入", "列入", "列入", "列入", "列入", "列入", "列入", "不列入", "不列入", "不列入"],
    "开发成本": [4263, 4323, 4532, 5288, 5268, 5533, 5685, 4323, 2663, 2791, 2982],
    "房型面积": [77, 98, 117, 145, 156, 167, 178, 126, 103, 129, 133],
    "建房套数": [250, 250, 150, 250, 250, 250, 250, 75, 150, 150, 75],
    "开发成本 (元/平方米)": [4263, 4323, 4532, 5288, 5268, 5533, 5685, 4323, 2663, 2791, 2982],
    "售价 (元/平方米)": [12000, 10800, 11200, 12800, 12800, 13600, 14000, 10400, 6400, 6800, 7200]
}

# 创建 DataFrame
df = pd.DataFrame(data)

# 设置字体
rcParams['font.sans-serif'] = ['SimHei']  # 例如,使用 SimHei 字体显示中文
rcParams['axes.unicode_minus'] = False    # 显示负号

# 创建散点图
plt.figure(figsize=(14, 7))
scatter = plt.scatter(df["房型面积"], df["售价 (元/平方米)"], c=df["开发成本"], cmap='viridis', s=100, edgecolors='k')
plt.colorbar(scatter, label='开发成本 (元/平方米)')
plt.xlabel('房型面积 (平方米)')
plt.ylabel('售价 (元/平方米)')
plt.title('房型面积与售价以及成本的关系')
plt.grid(True)

# 在每个数据点上标记房型,保持一定距离
for i in range(len(df)):
    plt.text(df["房型面积"][i] + 2, df["售价 (元/平方米)"][i] + 200, f'房型{i + 1}', fontsize=9, ha='left')

plt.show()
散点图效果如下:

散点图可以同时反应3个关系。
python
import pandas as pd
import matplotlib.pyplot as plt

# 数据
data = {
    "房型": [1, 2, 3, 4, 5, 6, 7, 8, 9, 10, 11],
    "建房套数": [250, 250, 150, 250, 250, 250, 250, 75, 150, 150, 75]
}

# 创建 DataFrame
df = pd.DataFrame(data)

# 饼图绘制
plt.figure(figsize=(10, 8))

# 高级感配色方案
colors = ['#6C5B7B', '#C06C84', '#F67280', '#F8B195', '#F9D5A8',
          '#F3B6A3', '#E1C6C1', '#D9B8C4', '#C9A7B4', '#B68583', '#A9A5A0']

# 绘制饼图
plt.pie(df["建房套数"], labels=[f'房型{i}' for i in df["房型"]], colors=colors, autopct='%1.1f%%', startangle=140, wedgeprops={'edgecolor': 'black'})

# 添加标题
plt.title('不同房型建造套数的占比')

# 显示图形
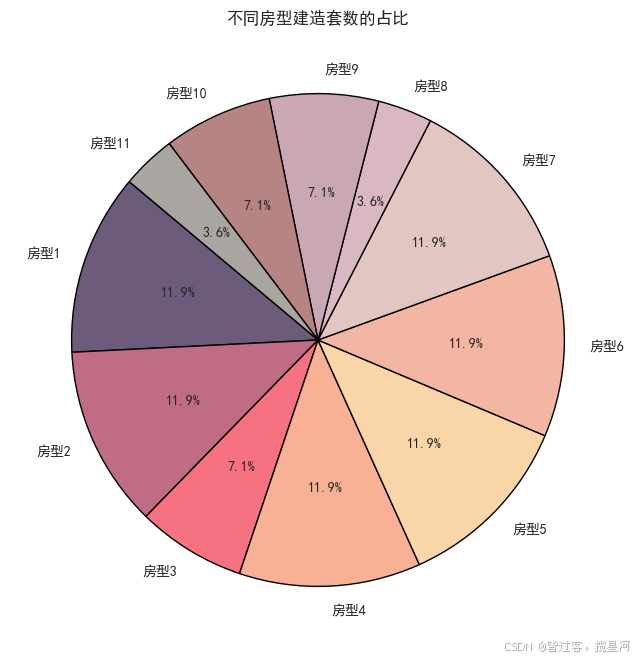
plt.show()
一个简单的饼图:

看起来比较清爽。
python
import matplotlib.pyplot as plt
import numpy as np
from matplotlib import cm, colors

# 设置支持中文的字体(使用默认的或者系统中可用的字体)
plt.rcParams['font.sans-serif'] = ['SimHei']  # SimHei 是黑体字的中文字体
plt.rcParams['axes.unicode_minus'] = False   # 解决负号 '-' 显示问题

# 提供的数据
labels = ['房型 1', '房型 2', '房型 3', '房型 4', '房型 5', '房型 6', '房型 7', '房型 8', '房型 9', '房型 10', '房型 11']
heights = [0.0606, 0.0909, 0.0758, 0.0909, 0.1061, 0.1212, 0.1364, 0.0909, 0.0303, 0.0455, 0.0606]

# 按高度排序数据(顺时针递增)
sorted_indices = np.argsort(heights)
sorted_labels = [labels[i] for i in sorted_indices]
sorted_heights = [heights[i] for i in sorted_indices]

# 创建反转渐变色
cmap = cm.get_cmap('plasma_r')  # 使用反转的渐变色
norm = colors.Normalize(vmin=min(sorted_heights), vmax=max(sorted_heights))
colors_map = [cmap(norm(height)) for height in sorted_heights]

# 设置图形和极坐标
plt.figure(figsize=(12, 12))
ax = plt.subplot(111, polar=True)

# 设置高度和宽度
width = 2 * np.pi / len(sorted_heights)
angles = [i * width for i in range(len(sorted_heights))]

# 绘制条形图
bars = ax.bar(x=angles, height=sorted_heights, width=width, bottom=0,
              linewidth=1, edgecolor="white", color=colors_map)

# 标签设置
labelPadding = 0.02  # 调整标签与条形的距离
for bar, angle, height, label in zip(bars, angles, sorted_heights, sorted_labels):
    rotation = np.rad2deg(angle)
    alignment = "left"
    if angle >= np.pi / 2 and angle < 3 * np.pi / 2:
        alignment = "right"
        rotation = rotation + 180
    ax.text(x=angle, y=bar.get_height() + labelPadding,
            s=label, ha=alignment, va='center', rotation=rotation,
            rotation_mode="anchor")

ax.set_thetagrids([], labels=[])
plt.show()
这是一个比较亮眼的图:

有点像旋转楼梯一样。
python
import matplotlib.pyplot as plt
import numpy as np

# 提供的数据
labels = ['房型 1', '房型 2', '房型 3', '房型 4', '房型 5', '房型 6', '房型 7', '房型 8', '房型 9', '房型 10', '房型 11']
values = [0.0606, 0.0909, 0.0758, 0.0909, 0.1061, 0.1212, 0.1364, 0.0909, 0.0303, 0.0455, 0.0606]

# 计算角度和条形宽度
angles = np.linspace(0, 2 * np.pi, len(labels), endpoint=False).tolist()
angles += angles[:1]  # 完成圆圈

values += values[:1]  # 完成圆圈

# 创建图形和轴
fig, ax = plt.subplots(figsize=(10, 10), subplot_kw=dict(polar=True))

# 绘制圆环
ax.fill(angles, values, color='lightblue', alpha=0.5)
ax.plot(angles, values, color='blue', linewidth=2)  # 边界

# 添加标签
for i, (angle, value, label) in enumerate(zip(angles[:-1], values[:-1], labels)):
    x = (value + 0.05) * np.cos(angle)
    y = (value + 0.05) * np.sin(angle)
    ax.text(x, y, label, horizontalalignment='center', verticalalignment='center')

# 设置标签和刻度
ax.set_yticklabels([])  # 移除y轴刻度标签
ax.set_xticks(angles[:-1])  # 设置x轴刻度
ax.set_xticklabels(labels, rotation=45, ha='right')  # 设置x轴标签

# 显示图形
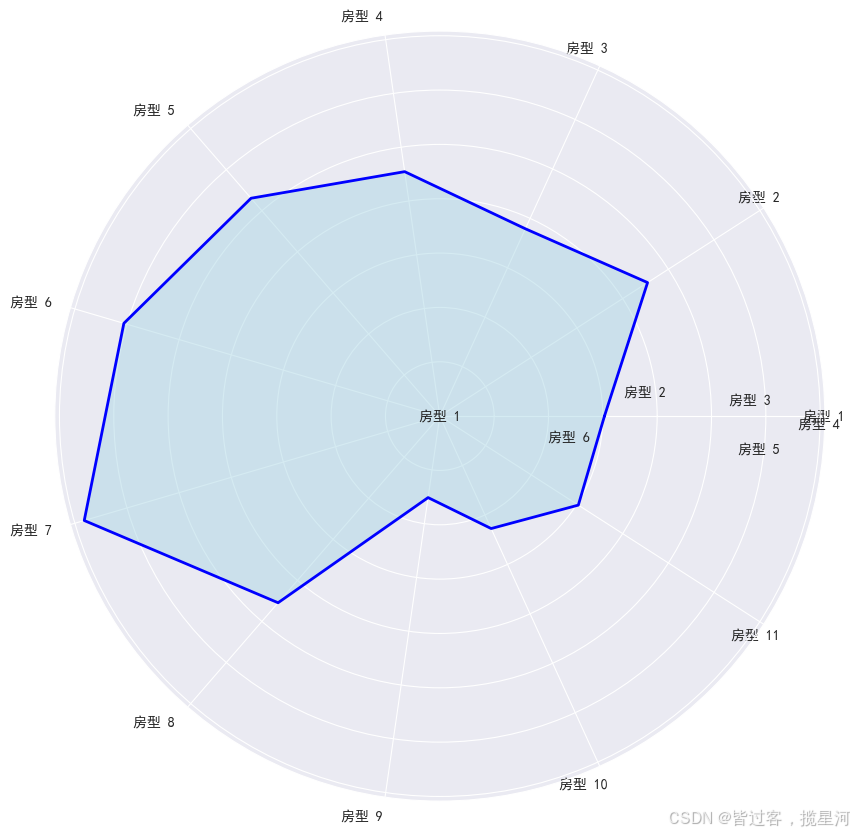
plt.show()
上面是一个雷达图:

用于成绩,各种表现,反应强项和若点。
python
import matplotlib.pyplot as plt
import numpy as np

# 数据
labels = ['房型 1', '房型 2', '房型 3', '房型 4', '房型 5', '房型 6', '房型 7', '房型 8', '房型 9', '房型 10', '房型 11']
sizes = [0.0606, 0.0909, 0.0758, 0.0909, 0.1061, 0.1212, 0.1364, 0.0909, 0.0303, 0.0455, 0.0606]

# 生成渐变色
cmap = plt.get_cmap('Blues')  # 可以选择其他渐变色图
colors = [cmap(i / len(sizes)) for i in range(len(sizes))]

# 创建圆环图
fig, ax = plt.subplots()
wedges, texts, autotexts = ax.pie(sizes, labels=labels, autopct='%1.1f%%', startangle=90, wedgeprops=dict(width=0.4), colors=colors)

# 设置中文显示
for text in texts:
    text.set_fontsize(10)
    text.set_color('black')

for autotext in autotexts:
    autotext.set_fontsize(8)
    autotext.set_color('black')

# 保持圆形
ax.axis('equal')

plt.title('房型分布圆环图')
plt.show()
上面是一个圆环图,通过圆环的面积,表示占比:

渐变色的颜色,看做清新顺畅。