- 🍨 本文为🔗365天深度学习训练营 中的学习记录博客
- 🍖 原作者:K同学啊
目标:
-
学习简单线性回归模型和多元线性回归模型
-
通过代码实现:通过鸢尾花花瓣长度预测花瓣宽度
具体实现 :
(一)环境 :
语言环境 :Python 3.10
编 译 器: PyCharm
框 架 :scikit-learn
(二)具体步骤:
造个数据集,内容格式如下:

导入库import pandas as pd
import numpy as np
import matplotlib.pyplot as plt
简单线性回归
# 加载数据
dataset = pd.read_csv('./studentscores.csv')
print(dataset)
# 取第一列Hours的值
X = dataset.iloc[:, :1].values
print(X)
# 取第二列Scores的值
Y = dataset.iloc[:, 1].values
print(Y)
很好奇,看看X,Y的形状:
print(X.shape)
print(Y.shape)
看来两者是一样的形状和大小 。继续:
# 切分一下数据集,75%用来训练,25%用来测试
from sklearn.model_selection import  train_test_split
X_train, X_test, Y_train, Y_test = train_test_split(X, Y,
                                                    test_size=1/4,
                                                    random_state=0)
检验一下切分的成果:
print(X_train, X_train.shape)
print(Y_train, Y_train.shape)
print(X_test, X_test.shape)
print(Y_test, Y_test.shape)
做简单线性回归
# 简单线性回归
from sklearn.linear_model import LinearRegression

regressor = LinearRegression()
regressor = regressor.fit(X_train, Y_train)

# 预测一下结果
Y_pred = regressor.predict(X_test)

print(Y_pred, Y_pred.shape)
这个预测结果和上面的Y_test比较一下,可以看到两者之间的差距以及相似性。我们进行可视化直观看看:
# 训练集可视化
plt.scatter(X_train, Y_train, color='red')
plt.plot(X_train, regressor.predict(X_train), color='blue')
plt.show()
**
# 测试集预测结果可视化
plt.scatter(X_test, Y_test, color='red')
plt.plot(X_test, regressor.predict(X_test), color='blue')
plt.show()
红点是实际分布,蓝色线是预测趋势线。两者是趋于一致的,预测的偏离并不大。
注:plt.scatter()绘制散点图,plt.plot()绘制折线图。
下面看看多元线性回归,通过鸢尾花花瓣长度预测花瓣宽度
-
导入数据集
url = 'https://archive.ics.uci.edu/ml/machine-learning-databases/iris/iris.data'
names = ['花萼-length', '花萼-width', '花瓣-length', '花瓣-width', 'class']
dataset = pd.read_csv(url, names=names)
print(dataset)

-
分析一下数据
plt.plot(dataset['花萼-length'], dataset['花瓣-width'], 'x', label="marker='x'")
plt.plot(dataset['花萼-width'], dataset['花瓣-width'], 'o', label="marker='o'")
plt.plot(dataset['花瓣-length'], dataset['花瓣-width'], 'v', label="marker='v'")
plt.legend(numpoints=1)
plt.show()

-
取数据
取[花萼-width : 花瓣-length]
X = dataset.iloc[:, [1, 2]].values
print(X, X.shape)


Y = dataset.iloc[:, 3].values  # 取花瓣-width值
print(Y, Y.shape)
-
将dataset切分成训练数据集和测试数据集
from sklearn.model_selection import train_test_split
X_train, X_test, Y_train, Y_test = train_test_split(X, Y,
test_size=0.2,
random_state=0) -
训练多元线性回归模型
from sklearn.linear_model import LinearRegression
regressor = LinearRegression()
regressor.fit(X_train, Y_train) -
在测试集上预测结果
y_pred = regressor.predict(X_test)
print(y_pred)

-
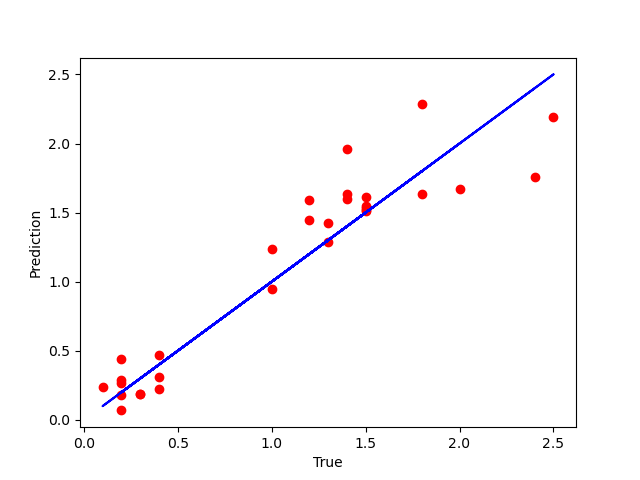
把测试集预测结果可视化
plt.scatter(Y_test, y_pred, color='red')
plt.plot(Y_test, Y_test, color='blue') # 假设预测100%正确,那么走势是蓝线
plt.plot(Y_test)
plt.xlabel("True")
plt.ylabel("Prediction")
plt.show()
