简介
SQL优化中读懂执行计划尤其重要,以下举例说明在执行计划中常见的参数其所代表的含义。
创建测试数据
-- 创建测试表
drop table if exists customers ;
drop table if exists orders ;
drop table if exists order_items ;
drop table if exists products ;
CREATE TABLE customers (
    customer_id SERIAL PRIMARY KEY,
    name VARCHAR(100) NOT NULL,
    registration_date DATE NOT NULL
);
CREATE TABLE orders (
    order_id SERIAL PRIMARY KEY,
    customer_id INT REFERENCES customers(customer_id),
    order_date DATE NOT NULL,
    total_amount NUMERIC(10, 2) NOT NULL
);
CREATE TABLE order_items (
    order_item_id SERIAL PRIMARY KEY,
    order_id INT REFERENCES orders(order_id),
    product_name VARCHAR(100) NOT NULL,
    quantity INT NOT NULL,
    price_per_item NUMERIC(10, 2) NOT NULL
);
CREATE TABLE products (
    product_id SERIAL PRIMARY KEY,
    product_name VARCHAR(100) NOT NULL,
    product_category VARCHAR(100) NOT NULL,
    price NUMERIC(10, 2) NOT NULL
);


 -- 插入数据
INSERT INTO customers (name, registration_date)
VALUES
('Alice', '2022-01-10'),
('Bob', '2022-01-15'),
('Charlie', '2022-01-20');
INSERT INTO products (product_name, product_category, price)
VALUES
('Laptop', 'Electronics', 1200.00),
('Headphones', 'Electronics', 150.00),
('Coffee Maker', 'Home Appliances', 80.00);
INSERT INTO orders (customer_id, order_date, total_amount)
VALUES
(1, '2022-01-12', 1350.00),
(2, '2022-01-16', 80.00),
(3, '2022-01-21', 1200.00);

INSERT INTO order_items (order_id, product_name, quantity, price_per_item)
VALUES
(1, 'Laptop', 1, 1200.00),
(1, 'Headphones', 1, 150.00),
(2, 'Coffee Maker', 1, 80.00),
(3, 'Laptop', 1, 1200.00);
创建测试SQL
SELECT
    c.customer_id,
    c.name AS customer_name,
    EXTRACT(YEAR FROM o.order_date) AS order_year,
    COUNT(o.order_id) AS total_orders,
    SUM(o.total_amount) AS total_spent,
    COUNT(oi.order_item_id) AS total_order_items
FROM
    customers c
JOIN
    orders o ON c.customer_id = o.customer_id
JOIN
    order_items oi ON o.order_id = oi.order_id
GROUP BY
    c.customer_id, c.name, EXTRACT(YEAR FROM o.order_date)
HAVING
    SUM(o.total_amount) > 500
ORDER BY
    total_spent DESC;
可选参数
explain (ANALYZE,BUFFERS,COSTS,FORMAT,GENERIC_PLAN,SETTINGS,SUMMARY,TIMING,VERBOSE,WAL)
ANALYZE:
执行查询并返回实际执行时间和行数统计信息。通过 ANALYZE 参数,您可以得到实际执行的时间、读取的行数以及执行的次数。
BUFFERS:
显示每一步骤的缓冲区(Buffer)访问情况,包括共享缓冲区、临时缓冲区的读取与写入。这能帮助您分析查询是否大量访问磁盘或者是否存在频繁的内存缓冲区使用。
COSTS :
显示估计的执行成本,包括启动成本(执行查询前的初始成本)和总成本。默认情况下,EXPLAIN 会显示成本,使用 COSTS 参数可以控制是否显示这些成本。
FORMAT :
可以指定输出的格式,常用的格式有 JSON TEXT XML YAML 。这对于自动化系统解析查询计划非常有用。
GENERIC_PLAN:
示 EXPLAIN 使用的通用查询计划,而不是为特定参数生成的计划。对于预处理语句或准备好的查询,使用此选项可以查看 PostgreSQL 生成的通用计划。
SETTINGS:
显示在执行查询时使用的设置(如 work_mem、max_parallel_workers_per_gather 等)。这有助于了解查询执行时使用了哪些配置参数。
SUMMARY:
显示执行计划的总结信息,包括计划时间、执行时间、缓冲区统计等。默认情况下,SUMMARY 会显示。
TIMING:
显示每个执行步骤的时间,默认是启用的。禁用后可以减少执行计划输出的细节,这在某些场景下有助于简化分析。
VERBOSE:
显示更多详细信息,包括表名、索引名和每个扫描步骤涉及的列名。适合进行详细调试。
WAL:
显示查询生成了多少 WAL(预写日志)活动。这对于调试写操作尤其有用,可以分析查询对 WAL 的影响。
列举示例
 postgres=# explain (ANALYZE)
postgres-# SELECT
postgres-#     c.customer_id,
postgres-#     c.name AS customer_name,
postgres-#     EXTRACT(YEAR FROM o.order_date) AS order_year,
postgres-#     COUNT(o.order_id) AS total_orders,
postgres-#     SUM(o.total_amount) AS total_spent,
postgres-#     COUNT(oi.order_item_id) AS total_order_items
postgres-# FROM
postgres-#     customers c
postgres-# JOIN
postgres-#     orders o ON c.customer_id = o.customer_id
postgres-# JOIN
postgres-#     order_items oi ON o.order_id = oi.order_id
postgres-# GROUP BY
postgres-#     c.customer_id, c.name, EXTRACT(YEAR FROM o.order_date)
postgres-# HAVING
postgres-#     SUM(o.total_amount) > 500
postgres-# ORDER BY
postgres-#     total_spent DESC;
                                                             QUERY PLAN
-------------------------------------------------------------------------------------------------------------------------------------
 Sort  (cost=86.40..86.64 rows=97 width=302) (actual time=0.055..0.057 rows=2 loops=1)
   Sort Key: (sum(o.total_amount)) DESC
   Sort Method: quicksort  Memory: 25kB
   ->  HashAggregate  (cost=78.61..83.20 rows=97 width=302) (actual time=0.046..0.049 rows=2 loops=1)
         Group Key: c.customer_id, EXTRACT(year FROM o.order_date)
         Filter: (sum(o.total_amount) > '500'::numeric)
         Batches: 1  Memory Usage: 37kB
         Rows Removed by Filter: 1
         ->  Hash Join  (cost=59.83..74.98 rows=290 width=278) (actual time=0.034..0.038 rows=4 loops=1)
               Hash Cond: (o.customer_id = c.customer_id)
               ->  Hash Join  (cost=42.62..56.29 rows=290 width=32) (actual time=0.014..0.016 rows=4 loops=1)
                     Hash Cond: (oi.order_id = o.order_id)
                     ->  Seq Scan on order_items oi  (cost=0.00..12.90 rows=290 width=8) (actual time=0.003..0.004 rows=4 loops=1)
                     ->  Hash  (cost=24.50..24.50 rows=1450 width=28) (actual time=0.004..0.005 rows=3 loops=1)
                           Buckets: 2048  Batches: 1  Memory Usage: 17kB
                           ->  Seq Scan on orders o  (cost=0.00..24.50 rows=1450 width=28) (actual time=0.003..0.003 rows=3 loops=1)
               ->  Hash  (cost=13.20..13.20 rows=320 width=222) (actual time=0.015..0.015 rows=3 loops=1)
                     Buckets: 1024  Batches: 1  Memory Usage: 9kB
                     ->  Seq Scan on customers c  (cost=0.00..13.20 rows=320 width=222) (actual time=0.007..0.008 rows=3 loops=1)
 Planning Time: 0.301 ms
 Execution Time: 0.097 ms
(21 rows)
以上案例为例,PG执行计划遵循从下到上,从里到外的规则。
  ->  Hash  (cost=24.50..24.50 rows=1450 width=28) (actual time=0.004..0.005 rows=3 loops=1)
                           Buckets: 2048  Batches: 1  Memory Usage: 17kB
                           ->  Seq Scan on orders o  (cost=0.00..24.50 rows=1450 width=28) (actual time=0.003..0.003 rows=3 loops=1)
Seq Scan on orders 对表orders顺序扫描,
(cost=0.00...24.50 rows=1450 width=28) 预估耗费成本,rows=1450预估扫描行1450 width=28预估扫描每行的宽度(以字节为单位),即每行大约占用 28字节。
(actual time=0.003...0.003 rows=3 loops=1) 实际消费成本,0.003...0.003: 0.003排序开始时间,0.003排序结束时间
对orders表扫描结束之后,会对其进行构建hash,常被用关联、嵌套等情况。
(cost=24.50...24.50 rows=1450 width=28) (actual time=0.004...0.005 rows=3 loops=1) 这两段解释同上相同
Buckets: 2048 Batches: 1 Memory Usage: 17kB
Buckets: 2048 表示哈希表中有 2048 个桶,每个桶用于存储散列结果相同的行。这是哈希表的一部分设计,用于分配空间。
Batches: 1 表示只需一批数据处理,因为表的大小足够小,整个哈希表可以存储在内存中。如果数据量非常大,PostgreSQL 可能会将哈希表分成多个批次处理,以防止内存不足。
Memory Usage: 17kB 是哈希表在内存中的大小,显示这次哈希操作所消耗的内存为 17KB。
  ->  Hash  (cost=13.20..13.20 rows=320 width=222) (actual time=0.015..0.015 rows=3 loops=1)
                     Buckets: 1024  Batches: 1  Memory Usage: 9kB
                     ->  Seq Scan on customers c  (cost=0.00..13.20 rows=320 width=222) (actual time=0.007..0.008 rows=3 loops=1)
Seq Scan on customers c 对customers 表进行顺序扫描, (cost=0.00...13.20 rows=320 width=222)
cost=0.00...13.20 扫描耗费的成本
rows=320 这是估计需要排序的行数
width=222:这是估算每行的宽度(以字节为单位),即每行大约占用 222字节。
actual time=0.007...0.008 为实际耗时,0.007毫秒是排序开始的时间,0.008毫秒是排序结束的时间。
rows=3 表示查询实际排序的行数是 2 行。
loops=1 表示实际执行了一次
 Sort  (cost=86.40..86.64 rows=97 width=302) (actual time=0.055..0.057 rows=2 loops=1)
   Sort Key: (sum(o.total_amount)) DESC
   Sort Method: quicksort  Memory: 25kB
   ->  HashAggregate  (cost=78.61..83.20 rows=97 width=302) (actual time=0.046..0.049 rows=2 loops=1)
         Group Key: c.customer_id, EXTRACT(year FROM o.order_date)
         Filter: (sum(o.total_amount) > '500'::numeric)
         Batches: 1  Memory Usage: 37kB
         Rows Removed by Filter: 1
HashAggregate (cost=78.61...83.20 rows=97 width=302) (actual time=0.046...0.049 rows=2 loops=1)
表示进行聚合操作所需要的耗费。
Group Key: c.customer_id, EXTRACT(year FROM o.order_date)
Group Key 表示使用的分组键
Filter: (sum(o.total_amount) > '500'::numeric) 表示用的过滤条件
Batches: 1 Memory Usage: 37kB 表示哈希聚合操作占用了 37kB 内存
Rows Removed by Filter: 1 被过滤掉的数据行数
此执行计划可以看出其预估行rows 和实际的rows 有较大的出入。实际上统计信息不是最新信息的问题导致,重新对其analyze单独执行重新收集一下统计信息就可以。
当执行vacuum full之后(也会自动进行analyze)
postgres=# explain (ANALYZE)
postgres-# SELECT
postgres-#     c.customer_id,
postgres-#     c.name AS customer_name,
postgres-#     EXTRACT(YEAR FROM o.order_date) AS order_year,
postgres-#     COUNT(o.order_id) AS total_orders,
postgres-#     SUM(o.total_amount) AS total_spent,
postgres-#     COUNT(oi.order_item_id) AS total_order_items
postgres-# FROM
postgres-#     customers c
postgres-# JOIN
postgres-#     orders o ON c.customer_id = o.customer_id
postgres-# JOIN
postgres-#     order_items oi ON o.order_id = oi.order_id
postgres-# GROUP BY
postgres-#     c.customer_id, c.name, EXTRACT(YEAR FROM o.order_date)
postgres-# HAVING
postgres-#     SUM(o.total_amount) > 500
postgres-# ORDER BY
postgres-#     total_spent DESC;
                                                           QUERY PLAN
---------------------------------------------------------------------------------------------------------------------------------
 Sort  (cost=3.35..3.36 rows=1 width=302) (actual time=0.063..0.065 rows=2 loops=1)
   Sort Key: (sum(o.total_amount)) DESC
   Sort Method: quicksort  Memory: 25kB
   ->  HashAggregate  (cost=3.28..3.34 rows=1 width=302) (actual time=0.052..0.055 rows=2 loops=1)
         Group Key: c.customer_id, EXTRACT(year FROM o.order_date)
         Filter: (sum(o.total_amount) > '500'::numeric)
         Batches: 1  Memory Usage: 24kB
         Rows Removed by Filter: 1
         ->  Hash Join  (cost=2.14..3.23 rows=4 width=278) (actual time=0.037..0.041 rows=4 loops=1)
               Hash Cond: (o.customer_id = c.customer_id)
               ->  Hash Join  (cost=1.07..2.13 rows=4 width=32) (actual time=0.014..0.016 rows=4 loops=1)
                     Hash Cond: (oi.order_id = o.order_id)
                     ->  Seq Scan on order_items oi  (cost=0.00..1.04 rows=4 width=8) (actual time=0.002..0.003 rows=4 loops=1)
                     ->  Hash  (cost=1.03..1.03 rows=3 width=28) (actual time=0.005..0.005 rows=3 loops=1)
                           Buckets: 1024  Batches: 1  Memory Usage: 9kB
                           ->  Seq Scan on orders o  (cost=0.00..1.03 rows=3 width=28) (actual time=0.003..0.004 rows=3 loops=1)
               ->  Hash  (cost=1.03..1.03 rows=3 width=222) (actual time=0.014..0.014 rows=3 loops=1)
                     Buckets: 1024  Batches: 1  Memory Usage: 9kB
                     ->  Seq Scan on customers c  (cost=0.00..1.03 rows=3 width=222) (actual time=0.010..0.010 rows=3 loops=1)
 Planning Time: 0.568 ms
 Execution Time: 0.129 ms
(21 rows)
增加buffers参数之后的执行计划,会增加Buffers: shared hit=3 ,用于记录SQL在执行数据存取过程中使用到了多少个数据块
postgres=# explain (ANALYZE,BUFFERS)
postgres-# SELECT
postgres-#     c.customer_id,
postgres-#     c.name AS customer_name,
postgres-#     EXTRACT(YEAR FROM o.order_date) AS order_year,
postgres-#     COUNT(o.order_id) AS total_orders,
postgres-#     SUM(o.total_amount) AS total_spent,
postgres-#     COUNT(oi.order_item_id) AS total_order_items
postgres-# FROM
postgres-#     customers c
postgres-# JOIN
postgres-#     orders o ON c.customer_id = o.customer_id
postgres-# JOIN
postgres-#     order_items oi ON o.order_id = oi.order_id
postgres-# GROUP BY
postgres-#     c.customer_id, c.name, EXTRACT(YEAR FROM o.order_date)
postgres-# HAVING
postgres-#     SUM(o.total_amount) > 500
postgres-# ORDER BY
postgres-#     total_spent DESC;
                                                           QUERY PLAN
---------------------------------------------------------------------------------------------------------------------------------
 Sort  (cost=3.35..3.36 rows=1 width=302) (actual time=0.072..0.074 rows=2 loops=1)
   Sort Key: (sum(o.total_amount)) DESC
   Sort Method: quicksort  Memory: 25kB
   Buffers: shared hit=3
   ->  HashAggregate  (cost=3.28..3.34 rows=1 width=302) (actual time=0.053..0.056 rows=2 loops=1)
         Group Key: c.customer_id, EXTRACT(year FROM o.order_date)
         Filter: (sum(o.total_amount) > '500'::numeric)
         Batches: 1  Memory Usage: 24kB
         Rows Removed by Filter: 1
         Buffers: shared hit=3
         ->  Hash Join  (cost=2.14..3.23 rows=4 width=278) (actual time=0.038..0.043 rows=4 loops=1)
               Hash Cond: (o.customer_id = c.customer_id)
               Buffers: shared hit=3
               ->  Hash Join  (cost=1.07..2.13 rows=4 width=32) (actual time=0.013..0.016 rows=4 loops=1)
                     Hash Cond: (oi.order_id = o.order_id)
                     Buffers: shared hit=2
                     ->  Seq Scan on order_items oi  (cost=0.00..1.04 rows=4 width=8) (actual time=0.003..0.004 rows=4 loops=1)
                           Buffers: shared hit=1
                     ->  Hash  (cost=1.03..1.03 rows=3 width=28) (actual time=0.005..0.005 rows=3 loops=1)
                           Buckets: 1024  Batches: 1  Memory Usage: 9kB
                           Buffers: shared hit=1
                           ->  Seq Scan on orders o  (cost=0.00..1.03 rows=3 width=28) (actual time=0.003..0.004 rows=3 loops=1)
                                 Buffers: shared hit=1
               ->  Hash  (cost=1.03..1.03 rows=3 width=222) (actual time=0.013..0.014 rows=3 loops=1)
                     Buckets: 1024  Batches: 1  Memory Usage: 9kB
                     Buffers: shared hit=1
                     ->  Seq Scan on customers c  (cost=0.00..1.03 rows=3 width=222) (actual time=0.009..0.010 rows=3 loops=1)
                           Buffers: shared hit=1
 Planning:
   Buffers: shared hit=2
 Planning Time: 0.247 ms
 Execution Time: 0.124 ms
增加COSTS参数之后的执行计划中增加了 I/O Timings: shared read 用于解释将数据读取缓存到缓存所需要的时间耗费
Sort  (cost=3.35..3.36 rows=1 width=302) (actual time=0.057..0.059 rows=2 loops=1)
   Sort Key: (sum(o.total_amount)) DESC
   Sort Method: quicksort  Memory: 25kB
   Buffers: shared hit=3
   ->  HashAggregate  (cost=3.28..3.34 rows=1 width=302) (actual time=0.049..0.051 rows=2 loops=1)
         Group Key: c.customer_id, EXTRACT(year FROM o.order_date)
         Filter: (sum(o.total_amount) > '500'::numeric)
         Batches: 1  Memory Usage: 24kB
         Rows Removed by Filter: 1
         Buffers: shared hit=3
         ->  Hash Join  (cost=2.14..3.23 rows=4 width=278) (actual time=0.036..0.041 rows=4 loops=1)
               Hash Cond: (o.customer_id = c.customer_id)
               Buffers: shared hit=3
               ->  Hash Join  (cost=1.07..2.13 rows=4 width=32) (actual time=0.018..0.021 rows=4 loops=1)
                     Hash Cond: (oi.order_id = o.order_id)
                     Buffers: shared hit=2
                     ->  Seq Scan on order_items oi  (cost=0.00..1.04 rows=4 width=8) (actual time=0.002..0.003 rows=4 loops=1)
                           Buffers: shared hit=1
                     ->  Hash  (cost=1.03..1.03 rows=3 width=28) (actual time=0.004..0.004 rows=3 loops=1)
                           Buckets: 1024  Batches: 1  Memory Usage: 9kB
                           Buffers: shared hit=1
                           ->  Seq Scan on orders o  (cost=0.00..1.03 rows=3 width=28) (actual time=0.002..0.003 rows=3 loops=1)
                                 Buffers: shared hit=1
               ->  Hash  (cost=1.03..1.03 rows=3 width=222) (actual time=0.011..0.011 rows=3 loops=1)
                     Buckets: 1024  Batches: 1  Memory Usage: 9kB
                     Buffers: shared hit=1
                     ->  Seq Scan on customers c  (cost=0.00..1.03 rows=3 width=222) (actual time=0.007..0.008 rows=3 loops=1)
                           Buffers: shared hit=1
 Planning:
   Buffers: shared hit=43 read=3
   I/O Timings: shared read=0.035
 Planning Time: 0.432 ms
 Execution Time: 0.114 ms
I/O Timings: shared read=0.035 表示查询过程中,从磁盘读取到共享缓冲区的数据块总耗时为 0.035 毫秒。这个时间量通常是从物理磁盘读取数据的花费。I/O 时间越短,说明磁盘 I/O 性能越好。
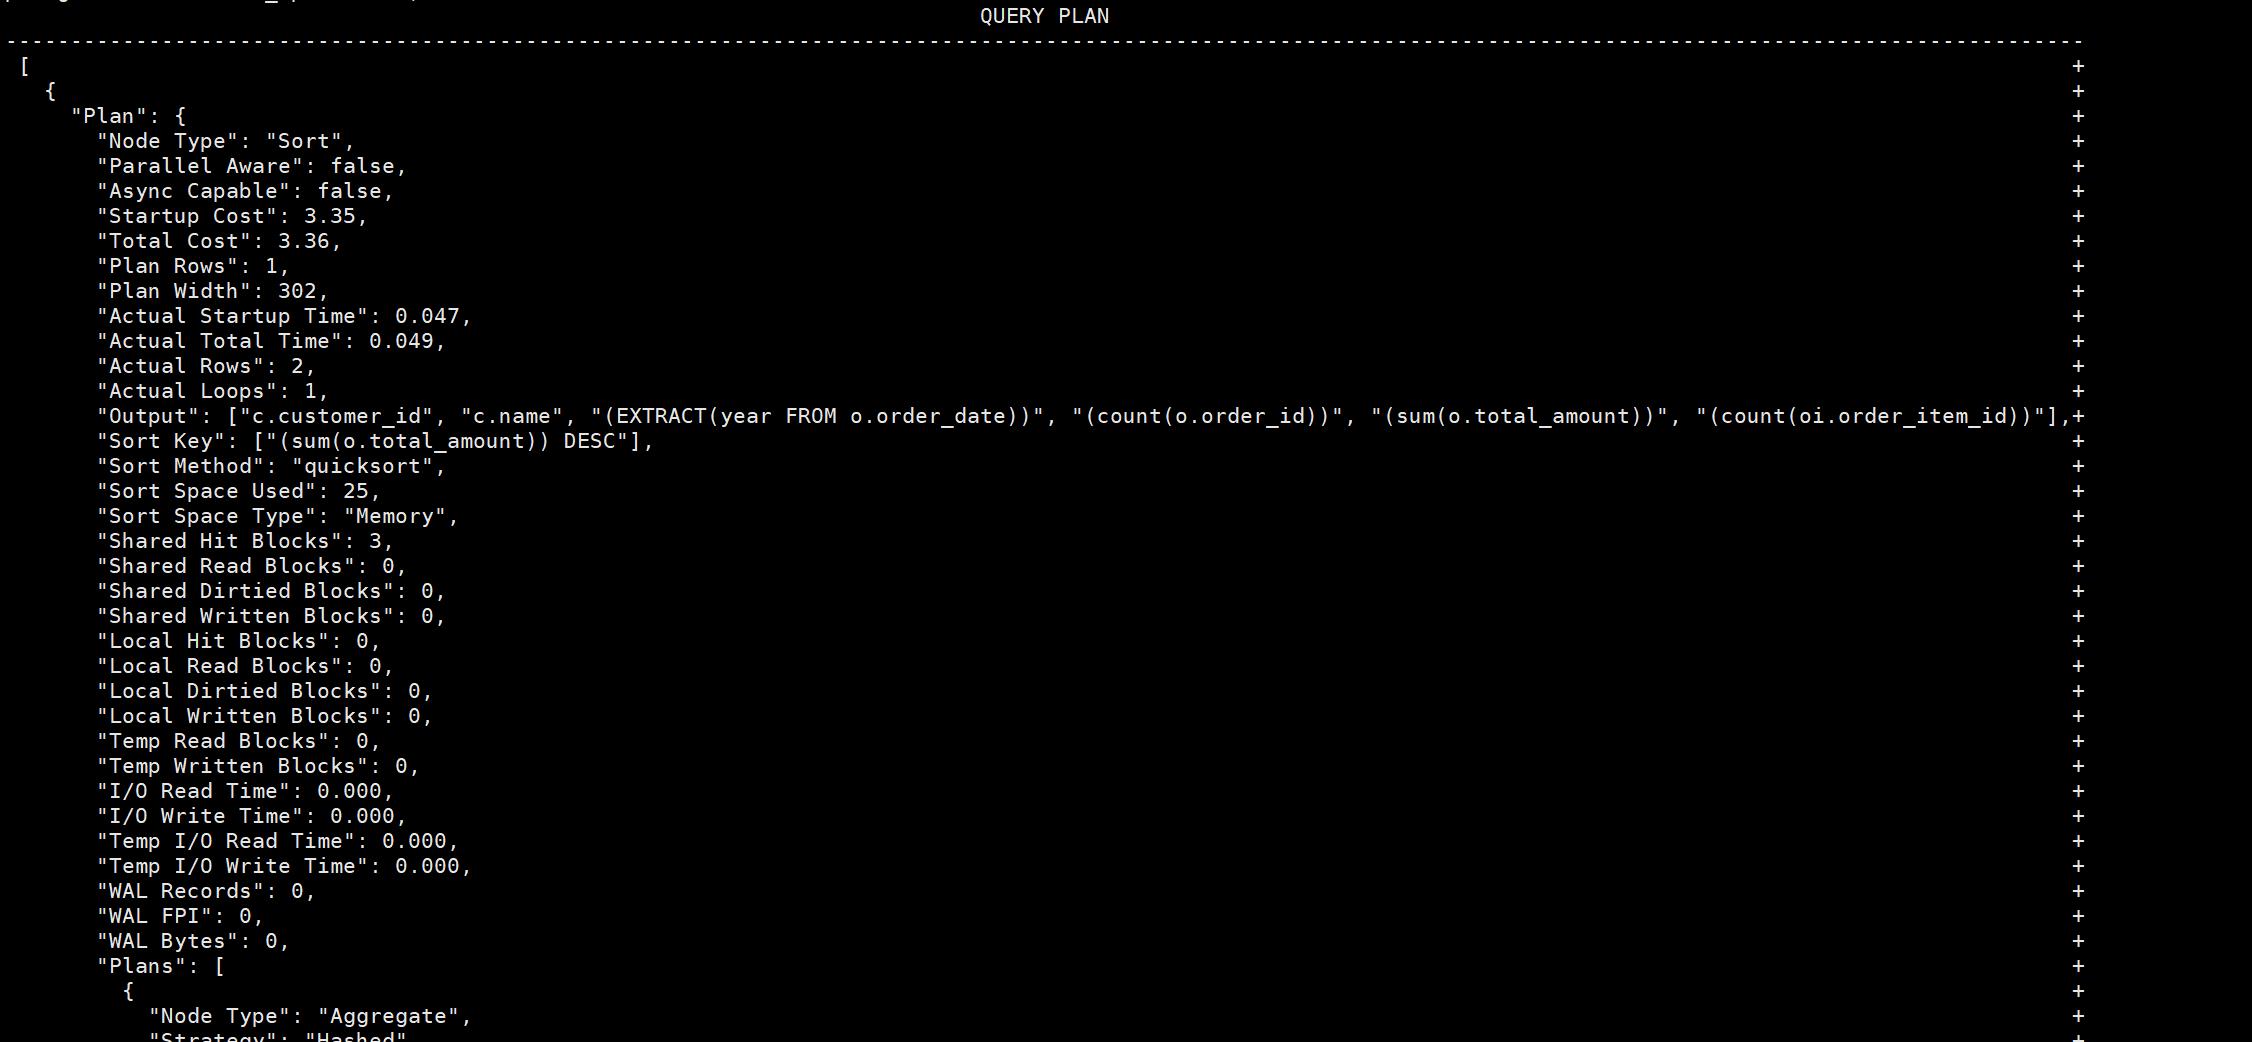
增加FORMAT 修改执行计划输出格式为json格式
explain (ANALYZE,BUFFERS,COSTS,VERBOSE,WAL,FORMAT JSON)
 SELECT
    c.customer_id,
    c.name AS customer_name,
    EXTRACT(YEAR FROM o.order_date) AS order_year,
    COUNT(o.order_id) AS total_orders,
    SUM(o.total_amount) AS total_spent,
    COUNT(oi.order_item_id) AS total_order_items
FROM
    customers c
JOIN
    orders o ON c.customer_id = o.customer_id
JOIN
    order_items oi ON o.order_id = oi.order_id
GROUP BY
    c.customer_id, c.name, EXTRACT(YEAR FROM o.order_date)
HAVING
    SUM(o.total_amount) > 500
ORDER BY
    total_spent DESC;