1、定义图像显示函数
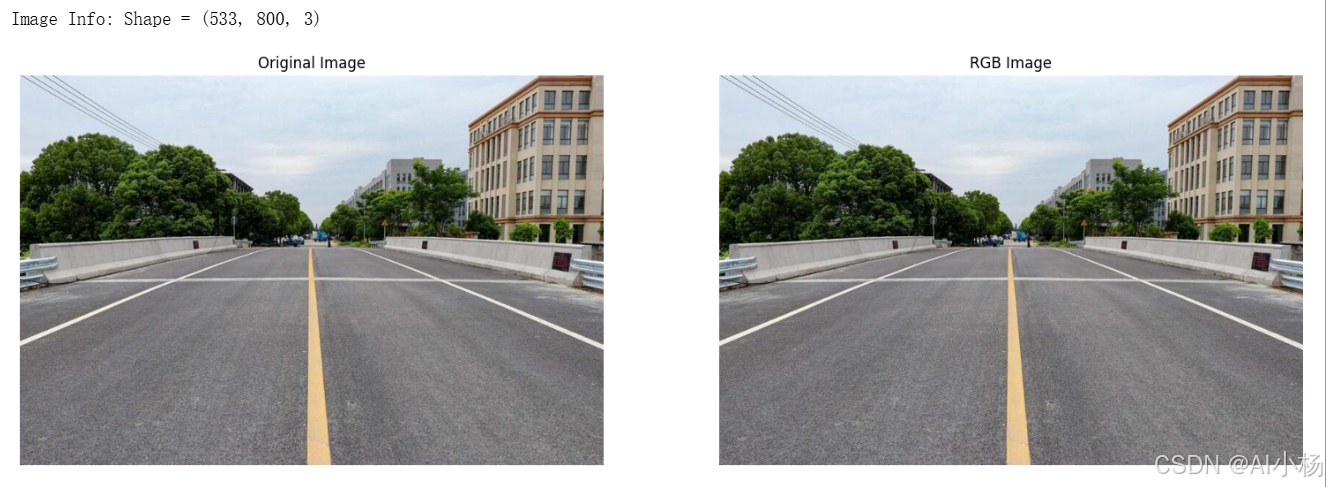
首先定义一个函数,函数的作用是通过plt库显示两幅图,为后续实验做准备。该函数的主要功能是:
- 从指定路径加载图像
- 显示图像的基本信息
- 将图像从BGR格式转换为RGB格式
- 并在一个图形窗口中显示两幅图像进行对比
python
import numpy as np
import cv2
import matplotlib.pyplot as plt
import pandas as pd
import time
import warnings

warnings.filterwarnings("ignore")

def load_image(path):
    """
    从指定路径加载图像并返回。

    :param path: 图像文件的路径
    :return: 加载的图像
    """
    img = cv2.imread(path)
    if img is None:
        raise FileNotFoundError(f"Image not found at {path}")
    return img

def display_image_info(img, title="Image Info"):
    """
    打印图像的基本信息。

    :param img: 图像数据
    :param title: 打印信息的标题
    """
    print(f"{title}: Shape = {img.shape}")

def convert_to_rgb(img):
    """
    将图像从 BGR 格式转换为 RGB 格式。

    :param img: 输入图像
    :return: 转换后的图像
    """
    return cv2.cvtColor(img, cv2.COLOR_BGR2RGB)


def compare_images(img1, img2, titles=("Original Image", "Processed Image"), figsize=(16, 5)):
    """
    在一个图形窗口中显示两幅图像进行对比。

    :param img1: 第一幅图像
    :param img2: 第二幅图像
    :param titles: 两幅图像的标题
    :param figsize: 图形窗口的大小
    """
    fig, axes = plt.subplots(1, 2, figsize=figsize)
    fig.tight_layout()

    # 显示第一幅图像
    axes[0].imshow(convert_to_rgb(img1))
    axes[0].set_title(titles[0])
    axes[0].axis('off')

    # 显示第二幅图像
    axes[1].imshow(convert_to_rgb(img2))
    axes[1].set_title(titles[1])
    axes[1].axis('off')

    plt.show()

# 主程序
if __name__ == "__main__":
    # 加载图像
    image_path = 'dataset/test3.jpg'
    img = load_image(image_path)

    # 显示图像信息
    display_image_info(img)

    # 对比显示原始图像和处理后的图像
compare_images(img, img, titles=("Original Image", "RGB Image"))- 运行效果如下:(原图和RGB图)

2、将图像转换为灰度图
- 将图像转换为灰度图:
python
#将图像转换为灰度图
def convert_to_gray(img):
    temp = cv2.cvtColor(img,cv2.COLOR_BGR2GRAY)
    return cv2.cvtColor(temp,cv2.COLOR_BGR2RGB)
gray_img = convert_to_gray(img)
#对比显示原始图像和灰度图像
compare_images(img, gray_img, titles=("Original Image", "Grayscale Image"))- 运行效果如下:(原图和灰度图)

3、高斯模糊
高斯模糊是一种图像处理效果,通常用于减少图像噪声以及降低细节层次。它是一种平滑和淡化图像部分的技术,通常用于减少噪声或为图像的前景添加焦点。高斯模糊如下:
python
#高斯模糊
def gaussian_blur(image, kernel_size):
    """
    对图像进行高斯模糊处理。

    :param image: 输入图像
    :param kernel_size: 高斯核的大小,必须是奇数
    :return: 高斯模糊后的图像
    """
    if kernel_size % 2 == 0:
        raise ValueError("Kernel size must be an odd number.")
    return cv2.GaussianBlur(image, (kernel_size, kernel_size), 0)

# 对灰度图像进行高斯模糊处理
gauss_img = gaussian_blur(gray_img, 5)

# 对比显示灰度图像和高斯模糊后的图像
compare_images(gray_img, gauss_img, titles=("Grayscale Image", "Gaussian Blurred Image"))- 运行效果如下:(灰度图和高斯处理效果图)

4、边缘检测
边缘检测是图形图像处理、计算机视觉和机器视觉中的一个基本工具,通常用于特征提取和特征检测,旨在检测一张数字图像中有明显变化的边缘或者不连续的区域,在一维空间中,类似的操作被称作步长检测(step detection)。边缘是一幅图像中不同屈原之间的边界线,通常一个边缘图像是一个二值图像。边缘检测的目的是捕捉亮度急剧变化的区域,而这些区域通常是我们关注的。
4.1 灰度图像直方图
- 绘制灰度图像的像素值分布直方图:
python
#灰度图直方图
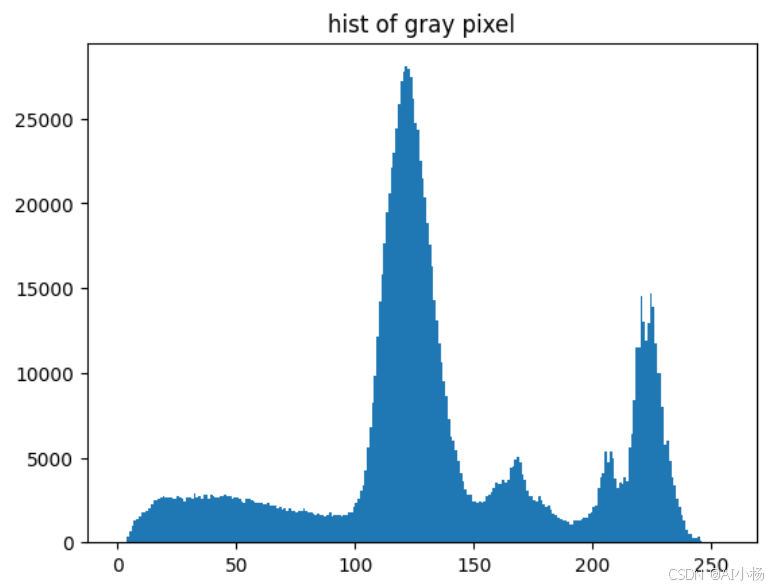
plt.hist(gauss_img.ravel(),256,[0,256])
plt.title('hist of gray pixel')
plt.show()- 运行效果如下图:

从图像的灰度图像素值分布直方图可以看出像素值主要分布在110到140之间。
4.2 边缘检测
图像边缘检测,从上述的图像灰度图的像素值的分布值中我们知道像素值的分布峰值在110-140之间,故canny(gauss_img,110,140),边缘检测如下:
python
#边缘检测
def canny(image,low_threshold,high_threshold):
    """
    功能: 使用Canny算法进行边缘检测。
    参数:
        image: 输入图像,通常应该是灰度图像。
        low_threshold: 低阈值,用于检测弱边缘。
        high_threshold: 高阈值,用于检测强边缘。
    返回: 边缘检测后的图像。
    """
    return cv2.Canny(image,low_threshold,high_threshold)
cannyd_img = canny(gauss_img,110,140)
compare_images(gauss_img,cannyd_img, titles=("Grayscale Image", "Canny Image"))- 运行效果如下:

5、提取感兴趣区域(ROI)
5.1 原图提取ROI
- 代码介绍:
下列代码实现了一个功能,该功能可以基于给定的多边形顶点来提取图像中的特定区域。这个过程包括创建一个与输入图像相同大小的掩模,然后在这个掩模上填充多边形区域,并使用这个掩模与原始图像进行按位与操作,从而只保留多边形区域内的图像部分。
封装了一个region_of_interest函数 :- 创建一个与输入图像相同大小的黑色掩模。
- 根据图像的通道数确定掩模的颜色。
- 填充多边形区域为白色,以创建掩模。
- 将原图像与掩模进行按位与操作,以保留兴趣区域。
- ROI区域实现如下:
python
#生成mask掩膜,提取ROI
#ROI即感兴趣区域,英文:Region of interest

def region_of_interest(image: np.ndarray, vertices: np.ndarray) -> np.ndarray:
    """
    应用图像掩模以保留由顶点定义的兴趣区域。

    参数:
    :param image: 输入图像(numpy数组)。
    :param vertices: 定义兴趣区域的多边形顶点数组。
    :return: 应用了掩模的图像。
    """
    # 创建与输入图像相同大小的黑色掩模
    mask = np.zeros_like(image)

    # 根据图像的通道数确定掩模的颜色
    ignore_mask_color = (255,) * image.shape[2] if len(image.shape) > 2 else 255

    # 填充多边形区域为白色,以创建掩模
    cv2.fillPoly(mask, vertices, ignore_mask_color)

    # 将原图像与掩模进行按位与操作,以保留兴趣区域
    masked_image = cv2.bitwise_and(image, mask)

    return masked_image

# 获取图像尺寸
imshape = img.shape

# 设置掩膜区域
temp_v = np.array([[(0, 350), (350, 225), (530, 245), (800, 355), (950, 1000), (0, 700)]], dtype=np.int32)

# 调用函数裁剪图像
crop_img = region_of_interest(img, temp_v)

# 显示对比图
compare_images(img,crop_img,titles=("Grayscale Image", "ROI Image"))- 运行效果如下:

5.2 边缘检测后提取ROI
- 对边缘检测后的图像进行提取ROI,如下:
python
crop_mask = region_of_interest(cannyd_img,temp_v)
compare_images(cannyd_img,crop_mask,titles=("Canny Image", "ROI Canny Image"))- 运行效果如下:

6、基于霍夫变换检测直线
6.1 什么是霍夫变换?
- 定义:
霍夫变换(Hough Transform)是图像处理中的一种特征提取技术,它通过一种投票算法检测具有特定形状的物体。Hough变换是图像处理中从图像中识别几何形状的基本方法之一。Hough变换的基本原理在于利用点与线的对偶性,将原始图像空间的给定的曲线通过曲线表达形式变为参数空间的一个点。这样就把原始图像中给定曲线的检测问题转化为寻找参数空间中的峰值问题。也即把检测整体特性转化为检测局部特性。比如直线、椭圆、圆、弧线等。
原则上霍夫变换可以检测任何形状,但复杂的形状需要的参数就多,霍夫空间的维数就多,因此在程序实现上所需的内存空间以及运行效率上都不利于把标准霍夫变换应用于实际复杂图形的检测中。霍夫梯度法是霍夫变换的改进(圆检测),它的目的是减小霍夫空间的维度,提高效率。
直线检测原理:将要检测的对象转到霍夫空间中,利用累加器找到最优解,即为所求直线。
(注:检测前要对图像二值化处理)
6.2 霍夫变换实现
下列代码定义了两个函数 hough_lines 和 lsd_lines,分别用于使用霍夫变换和LSD算法检测图像中的直线,并使用了一个装饰器 timed_function 来测量这两个函数的执行时间。
- 实现如下:
python
def timed_function(func):
    """装饰器,用于测量函数执行时间"""
    def wrapper(*args, **kwargs):
        start = time.time()
        result = func(*args, **kwargs)
        end = time.time() - start
        print(f"{func.__name__} took {end:.4f}s")
        return result
    return wrapper

@timed_function
def hough_lines(img: np.ndarray, rho: float, theta: float, threshold: int, min_line_length: int, max_line_gap: int) -> np.ndarray:
    """
    使用霍夫变换检测图像中的直线。

    参数:
    :param img: 输入图像(边缘检测后的二值图像)。
    :param rho: 线段以像素为单位的距离精度。
    :param theta: 像素以弧度为单位的角度精度。
    :param threshold: 霍夫平面累加的阈值。
    :param min_line_length: 线段最小长度(像素级)。
    :param max_line_gap: 最大允许断裂长度。
    :return: 检测到的直线数组。
    """
    lines = cv2.HoughLinesP(img, rho, theta, threshold, np.array([]), min_line_length, max_line_gap)
    return lines

# 参数设置
rho = 1
theta = np.pi / 180
hof_threshold = 20
min_line_len = 30
max_line_gap = 100

# 调用函数
lines_hough = hough_lines(crop_mask, rho, theta, hof_threshold, min_line_len, max_line_gap)- 上述参数介绍:
rho: 线段以像素为单位的距离精度。theta: 像素以弧度为单位的角度精度。hof_threshold: 霍夫平面累加的阈值。min_line_len: 线段最小长度(像素级)。max_line_gap: 最大允许断裂长度。
- 代码运行效果如下:

7、车道线检测并计算斜率
- 在图像上绘制检测到的车道线,并显示每条线的斜率:
python
#车道线斜率显示
def draw_lines(image: np.ndarray, lines: np.ndarray) -> np.ndarray:
    """
    在图像上绘制检测到的车道线,并显示每条线的斜率。

    参数:
    :param image: 输入图像。
    :param lines: 检测到的直线数组。
    :return: 绘制了车道线的图像。
    """
    for line in lines:
        for x1, y1, x2, y2 in line:
            # 计算直线的斜率
            fit = np.polyfit((x1, x2), (y1, y2), deg=1)
            slope = fit[0]
            slope_str = f"{slope:.2f}"  # 格式化斜率字符串

            # 绘制直线
            cv2.line(image, (int(x1), int(y1)), (int(x2), int(y2)), (0, 255, 0), 10)

            # 在终点附近绘制斜率文本
            cv2.putText(image, slope_str, (int(x2), int(y2)), cv2.FONT_HERSHEY_SIMPLEX, 1.2, (255, 255, 255), 2)

    return image

# 调用函数
lined_image = draw_lines(img.copy(),lines_hough)

# 显示对比图
compare_images(img, lined_image,titles=("Original Image", "Lane line slope Image"))- 运行效果如下:

8、计算车道线平均斜率和截距
- 计算了左右车道线和中心线的平均斜率和截距:
python
def draw_lines_detection(image: np.ndarray, lines: np.ndarray) -> tuple:
    """
    在图像上绘制检测到的车道线,并计算左右车道线和中心线的平均斜率和截距。

    参数:
    :param image: 输入图像。
    :param lines: 检测到的直线数组。
    :return: 绘制了车道线的图像以及左右车道线和中心线的平均斜率和截距。
    """
    middle_x = image.shape[1] // 2  # 图像的中点
    left_slopes = []
    right_slopes = []
    center_slopes = []

    left_biases = []
    right_biases = []
    center_biases = []

    for line in lines:
        for x1, y1, x2, y2 in line:
            fit = np.polyfit((x1, x2), (y1, y2), deg=1)
            slope = fit[0]
            bias = fit[1]

            if -0.41 < slope < -0.30:  # 左边线
                cv2.line(image, (x1, y1), (x2, y2), (0, 255, 0), 10)
                left_slopes.append(slope)
                left_biases.append(bias)
            elif 0.38 < slope < 0.42:  # 右边线
                cv2.line(image, (x1, y1), (x2, y2), (0, 0, 255), 10)
                right_slopes.append(slope)
                right_biases.append(bias)
            elif slope > 1:  # 中心线
                cv2.line(image, (x1, y1), (x2, y2), (255, 0, 0), 10)
                center_slopes.append(slope)
                center_biases.append(bias)

    # 计算平均值
    left_slope = np.mean(left_slopes) if left_slopes else 0
    left_bias = np.mean(left_biases) if left_biases else 0
    right_slope = np.mean(right_slopes) if right_slopes else 0
    right_bias = np.mean(right_biases) if right_biases else 0
    center_slope = np.mean(center_slopes) if center_slopes else 0
    center_bias = np.mean(center_biases) if center_biases else 0

    return image, left_slope, left_bias, right_slope, right_bias, center_slope, center_bias

# 调用函数
lined_image, left_slope, left_bias, right_slope, right_bias, center_slope, center_bias = draw_lines_detection(img.copy(), lines_hough)

# 显示对比图
compare_images(img, lined_image,titles=("Original Image", "Lane markings detection Image"))- 运行效果如下:

上述代码介绍:
- 功能: 在图像上绘制检测到的车道线,并计算左右车道线和中心线的平均斜率和截距。
- 参数 :
image: 输入图像。lines: 检测到的直线数组。
- 返回: 绘制了车道线的图像以及左右车道线和中心线的平均斜率和截距。
- 步骤 :
- 计算图像的中点。
- 初始化存储斜率和截距的列表。
- 遍历每条直线,计算斜率和截距。
- 根据斜率范围判断直线属于左边线、右边线还是中心线,并分别绘制不同颜色的直线。
- 将斜率和截距添加到相应的列表中。
- 计算每个类别的平均斜率和截距。
- 返回绘制了车道线的图像和计算结果。
9、绘制每一条车道线
- 在图像上绘制左右车道线和中心线:
python
def draw_all_line(img, slope, bias, color, y2=230):
    # 计算起点
    x1 = 0 if slope == 'left' else img.shape[1] if slope == 'right' else int((img.shape[0] - bias) / slope)
    y1 = int(slope * x1 + bias) if isinstance(slope, (int, float)) else img.shape[0]

    # 计算终点
    x2 = int((y2 - bias) / slope) if isinstance(slope, (int, float)) else x1

    # 绘制线条
    line_img = cv2.line(img.copy(), (x1, y1), (x2, y2), color, 10)

    return line_img

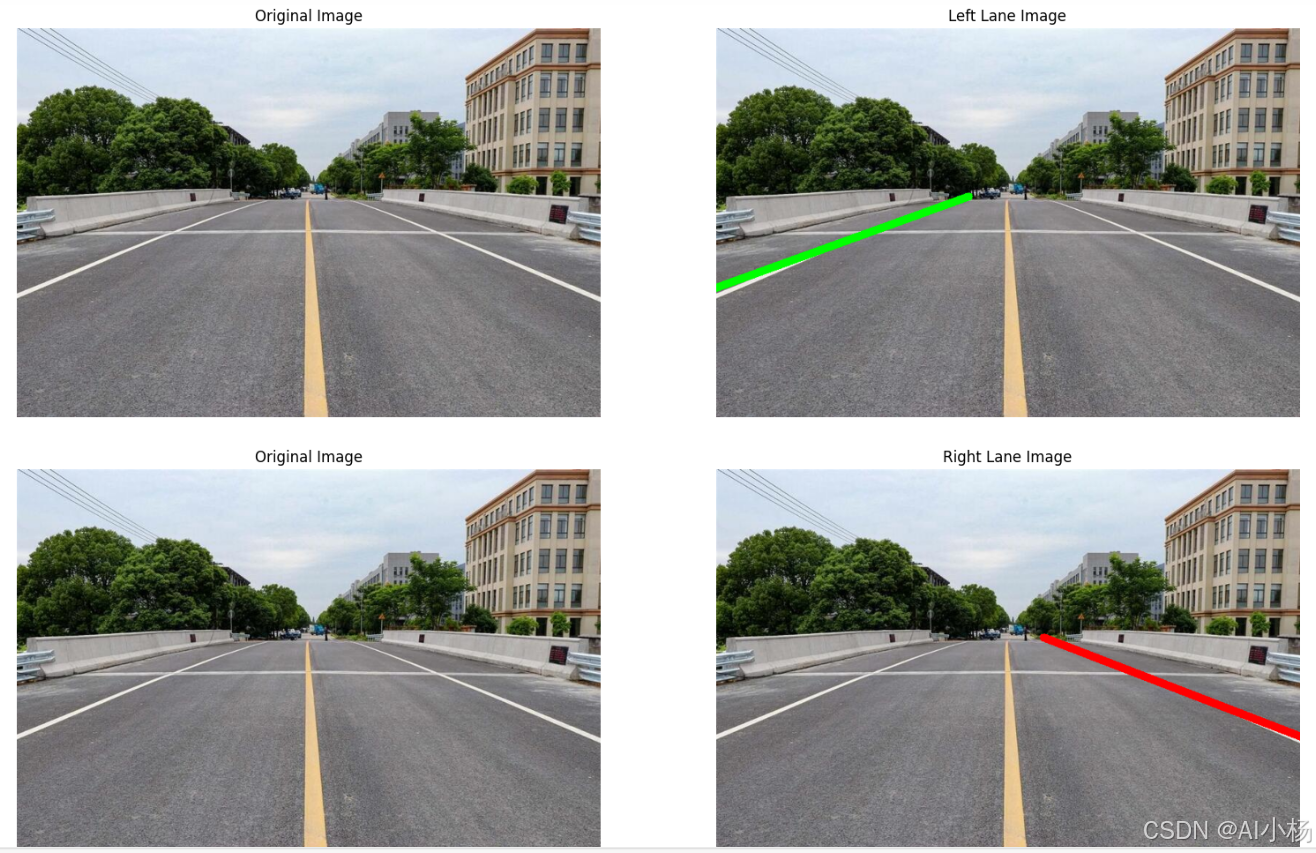
# 左边线
left_lines = draw_all_line(img, left_slope, left_bias, (0, 255, 0))
compare_images(img, left_lines,titles=("Original Image", "Left Lane Image"))

# 右边线
right_lines = draw_all_line(img, right_slope, right_bias, (0, 0, 255))
compare_images(img, right_lines,titles=("Original Image", "Right Lane Image"))

# 中线
center_lines = draw_all_line(img, center_slope, center_bias, (255, 0, 0))- 运行效果如下:


10、图像融合--绘制最终的车道线
- 在一个空白图像上绘制左右车道线和中心线,并将这些线条与原图像进行融合:
python
import numpy as np
import cv2

def draw_line(blank, slope, bias, color, y2=230):
    # 计算起点
    if slope == 'left':
        x1 = 0
        y1 = int(slope * x1 + bias)
    elif slope == 'right':
        x1 = blank.shape[1]
        y1 = int(slope * x1 + bias)
    else:
        y1 = blank.shape[0]
        x1 = int((y1 - bias) / slope)

    # 计算终点
    x2 = int((y2 - bias) / slope) if slope != 'left' and slope != 'right' else x1

    # 绘制线条
    cv2.line(blank, (x1, y1), (x2, y2), color, 20)

def draw_lines_and_fuse(img, left_slope, left_bias, right_slope, right_bias, center_slope, center_bias):
    # 创建空白图像
    blank = np.zeros_like(img)

    # 绘制左车道线
    draw_line(blank, left_slope, left_bias, (0, 255, 0))

    # 绘制右车道线
    draw_line(blank, right_slope, right_bias, (0, 0, 255))

    # 绘制中线
    draw_line(blank, center_slope, center_bias, (255, 0, 0))

    # 图像融合
    fusion = cv2.addWeighted(img, 0.8, blank, 1, 0)

    return fusion

# 示例调用
fusion = draw_lines_and_fuse(img, left_slope, left_bias, right_slope, right_bias, center_slope, center_bias)
compare_images(img, fusion,titles=("Original Image", "Image blending--Lane markings detection results"))- 运行效果如下:
