LightningChart .NET完全由GPU加速,并且性能经过优化,可用于实时显示海量数据-超过10亿个数据点。 LightningChart包括广泛的2D,高级3D,Polar,Smith,3D饼/甜甜圈,地理地图和GIS图表以及适用于科学,工程,医学,航空,贸易,能源和其他领域的体绘制功能。
在上文中(点击这里回顾>>),我们为大家介绍了什么是 LightningChart 的WPF图表以及基本的项目概况和设置等,本文将详细介绍如何来创建WPF图表。
系列设置
我们将打造5大系列:
cs
string[] cityNames = new string[] { "Paris", "New York City", "Tokyo", "Helsinki", "Buenos Aires" };
Color[] cityColors = new Color[] { Colors.LimeGreen, Colors.LightCoral, Colors.RoyalBlue, Colors.Green, Colors.Turquoise };
城市名称和城市颜色将存储在数组对象中,因为它们将在循环中进行映射:
cs
for (int i = 0; i < _dataRowCount; i++)
{
PointLineSeries temperatureSeries = new PointLineSeries(_chart.ViewXY, _chart.ViewXY.XAxes[0], yAxisTemperature);
temperatureSeries.LineStyle.Color = cityColors[i];
temperatureSeries.PointsVisible = false;
temperatureSeries.PointStyle.Color1 = Color.FromArgb(0, 0, 0, 0);
temperatureSeries.PointStyle.Color2 = cityColors[i];
_chart.ViewXY.PointLineSeries.Add(temperatureSeries);
temperatureSeries.Points = CreateRandomTemperatureData(101, i * 5);
点线系列基本上是笛卡尔平面中每个数据点的表示,这些点将根据其 X 和 Y 值相对于 X 轴和 Y 轴进行定位。这些点可以用线连接起来,这样我们就可以得到一条带有峰值的线:
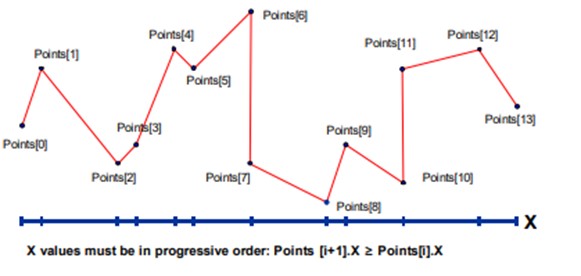
数据应该被格式化为一个数组,该数组将使用方法CreateRandomTemperatureData和CreateRandomHumidityData。
cs
PointLineSeries humiditySeries = new PointLineSeries(_chart.ViewXY, _chart.ViewXY.XAxes[0], yAxisHumidity);
humiditySeries.LineStyle.Color = cityColors[i];
humiditySeries.PointsVisible = true;
humiditySeries.PointStyle.Color1 = HumidityColor;
humiditySeries.PointStyle.Color2 = Color.FromArgb(0, 0, 0, 0);
humiditySeries.PointStyle.Shape = Shape.Rectangle;
humiditySeries.PointStyle.Angle = 45;
_chart.ViewXY.PointLineSeries.Add(humiditySeries);
humiditySeries.Points = CreateRandomHumidityData(101, i * 10);
第一点线系列和第二点线系列之间的主要区别在于,我们对温度系列使用 Y 温度轴,对湿度系列使用 Y 湿度轴。
创建数据点
cs
private SeriesPoint[] CreateRandomTemperatureData(int pointCount, double seedOffsetLevel)
{
Random random = new Random((int)seedOffsetLevel);
double value = seedOffsetLevel;
SeriesPoint[] data = new SeriesPoint[pointCount];
for (int i = 0; i < pointCount; i++)
{
data[i].X = i;
value += (random.NextDouble() - 0.5) * 3;
data[i].Y = value;
}
return data;
}
对于此示例,我们使用一个简单的循环来创建随机数据点。如您所见,数据点只需要 X 和 Y 值,这些点必须包含在每个轴的范围内。
CreateAnnotationsTable()
这是在 WPF 中创建表格的方法,它将在图表上创建并显示注释表:
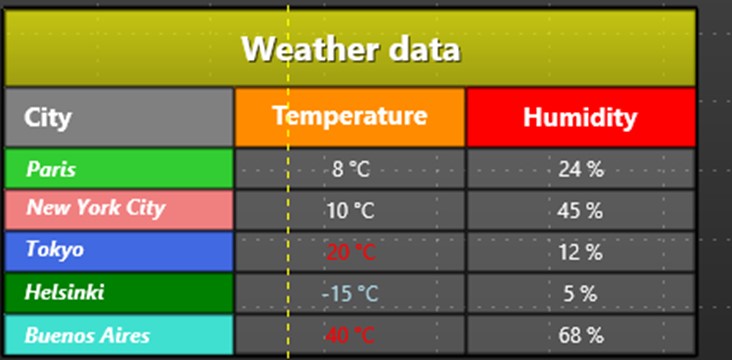
参数包括cityNames、cityColors、width和height。
cs
private void CreateAnnotationsTable(string[] cityNames, Color[] cityColors, float width, float height)
{
通过这些参数,我们将指定表格的大小、行数和颜色。要创建调整大小的边框,需要允许与用户交互、允许调整大小功能和其他视觉属性:
cs
AnnotationXY resizingBorder = CreateCell();
resizingBorder.AllowUserInteraction = true;
resizingBorder.AllowResize = true;
resizingBorder.AllowDragging = false;
resizingBorder.Fill.Style = RectFillStyle.None;
resizingBorder.Shadow.Visible = false;
resizingBorder.ResizedByUser += resizingBorder_ResizedByMouse;
resizingBorder.TextStyle.Visible = false;
resizingBorder.SizeScreenCoords.SetValues(width, height);
resizingBorder.Highlight = Highlight.None;
resizingBorder.BorderLineStyle.Width = 3;
SizeScreenCoords将帮助我们设置表格的默认大小,ResizedByUser将根据用户更新表格的大小:
cs
private void resizingBorder_ResizedByMouse(object sender, AnnotationResizedByUserXYEventArgs e)
{
AnnotationXY border = (AnnotationXY)sender;
RepositionAnnotationsTable(border.LocationScreenCoords.X, border.LocationScreenCoords.Y,
border.SizeScreenCoords.Width, border.SizeScreenCoords.Height);
}
所有这些属性都将存储在AnnotationXY对象中,此对象将包含边框、标题、行和列。标题是单元格,我们只需按需要的顺序添加它们:

cs
AnnotationXY header = CreateCell();
header.TextStyle.Font = new WpfFont("Serif", 20.0, "20", true, false);
header.TextStyle.Color = Colors.White;
header.TextStyle.Shadow.Style = TextShadowStyle.DropShadow;
header.Text = "Weather data";
header.Fill.Style = RectFillStyle.ColorOnly;
header.Fill.Color = Color.FromArgb(180, 255, 255, 0);
header.Fill.GradientColor = Color.FromArgb(180, 200, 200, 0);
header.Fill.GradientFill = GradientFill.Linear;
header.AllowUserInteraction = true;
header.AllowDragging = true;
header.DraggedByUser += header_MovedByMouse;
//Column titles - City
AnnotationXY columnTitle1 = CreateCell();
columnTitle1.TextStyle.Font = new WpfFont("Serif", 15.0, "15", true, false);
columnTitle1.TextStyle.Color = Colors.White;
columnTitle1.Text = "City";
columnTitle1.Fill.Style = RectFillStyle.ColorOnly;
columnTitle1.Fill.Color = Colors.Gray;
columnTitle1.TextStyle.HorizAlign = AlignmentHorizontal.Left;
所有属性都与 CSS 属性非常相似,所以我认为没有必要全部解释。该CreateCell函数将向单元格添加更多属性,单元格的颜色将从轴中获取。
为了创建行,我们需要使用循环创建更多单元格:
cs
for (int row = 0; row < cityCount; row++)
{
//Row title
AnnotationXY cityTitle = CreateCell();
cityTitle.TextStyle.Font = new WpfFont("Serif", 12.0, "12", true, true);
cityTitle.TextStyle.Color = Colors.White;
cityTitle.Text = cityNames[row];
cityTitle.Fill.Color = cityColors[row];
cityTitle.Fill.Style = RectFillStyle.ColorOnly;
cityTitle.TextStyle.HorizAlign = AlignmentHorizontal.Left;
//Data cells
for (int dataCol = 0; dataCol < dataColumnsPerCity; dataCol++)
{
AnnotationXY data = CreateCell();
data.TextStyle.Font = new WpfFont("Serif", 12.0, "12", false, false);
data.TextStyle.Color = Colors.White;
data.Text = "N/A";
}
}
对于每个城市,将创建一个单元格,数据columnsPerCity在代码开头指定。
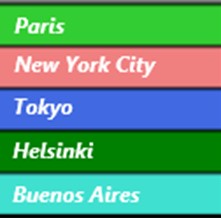
我们指定了值 2,这样我们就有两列按城市划分的列:
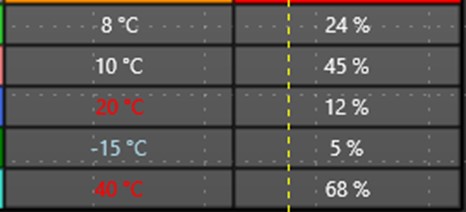
向表中添加数据
表将需要一个包含每列两个值的对象,在这种情况下我们将使用元组,元组有助于形成由"行"组成的多个部分的数据结构:
cs
Tuple<double, double>[] data = new Tuple<double, double>[5];
data[0] = new Tuple<double, double>(8, 24);
data[1] = new Tuple<double, double>(10, 45);
data[2] = new Tuple<double, double>(20, 12);
data[3] = new Tuple<double, double>(-15, 5);
data[4] = new Tuple<double, double>(40, 68);
UpdateTableData(data);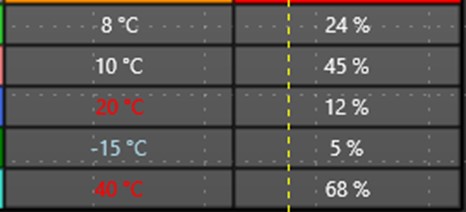
该方法UpdateTableData 将帮助我们将每个值添加到AnnotationXY对象中,通过这种方式,您可以实现一种创建具有更新值的元组的方法。
cs
_chart.BeginUpdate();
for (int iCity = 0; iCity < _dataRowCount; iCity++)
{
double tempature = data[iCity].Item1;
AnnotationXY cellTemperature = _chart.ViewXY.Annotations[5 + iCity * 3 + 1];
cellTemperature.Text = tempature.ToString() + " °C";
if (tempature < 0)
{
cellTemperature.TextStyle.Color = Colors.LightBlue;
}
else if (tempature < 20)
{
cellTemperature.TextStyle.Color = Colors.White;
}
else
{
cellTemperature.TextStyle.Color = Colors.Red;
}
AnnotationXY cellHumidity = _chart.ViewXY.Annotations[5 + iCity * 3 + 2];
cellHumidity.Text = data[iCity].Item2.ToString() + " %";
}
_chart.EndUpdate();
该方法将格式化值,给出与温度相关的颜色,定位相应单元格的方法基本上是计算单元格数量并添加城市行。
cs
_chart.EndUpdate();
gridChart.Children.Add(_chart);
一旦我们完成图表配置,就关闭EndUpdate()更新过程,并将图表对象添加到 XAML 网格中以便显示它。
结论
注释乍一看可能有点令人困惑,尤其是需要配置其视觉属性的所有代码。但好消息是:LightningChart .NET允许您以与使用 CSS 类进行样式设置非常相似的方式自定义这些注释。
有一件事可能会让您感到困惑,那就是表格的创建方式------但别担心,它比看起来要简单!将注释视为一个框或单元格,有点像 CSS 和 HTML 中的"DIV"。在这个单元格内,您可以添加所需的文本和信息。
要在 WPF 中创建表格,您只需创建一组单元格,所有单元格都整齐地排列在一个框架内,以使内容井井有条。设置表格后,只需使用文本属性为其分配值即可。您可以使用填充颜色、边框、文本、字体类型、字体大小等对其进行自定义。
调整大小和表更新函数的工作方式与可以应用于任何 .NET 项目的常规函数类似。因此,如果您希望在 WPF 中为您的项目实现注释或表,本练习将为您提供专注于数据源所需的工具。
即使是创建线系列,您也可以将此代码用于其他项目。逻辑保持不变;只有数据范围、颜色和标签会发生变化。
希望本次教程对您即将开展的项目有所帮助。