简介
在现代基础设施中,监控和可视化系统性能是至关重要的。Prometheus和Grafana作为两个强大的开源工具,分别提供了系统监控和数据可视化的功能。本篇文章将带你一步步在Ubuntu系统上部署这两个工具,让你能够深入了解系统性能,并及时解决任何问题。
部署这两个项目,有以下特点:
- 实时监控:实时收集和分析系统指标。
- 数据可视化:通过Grafana创建直观的仪表板,展示关键性能数据。
- 灵活配置:根据个人需求定制Prometheus和Grafana的配置。
功能特点简介
Prometheus和Grafana的组合提供了以下核心优势:
- 高性能监控:Prometheus能够高效地收集和存储时间序列数据,为系统性能监控提供了强大的支持。
- 直观的仪表板:Grafana提供了丰富的图表和仪表板,使得数据可视化变得简单直观。
- 灵活的配置:用户可以根据需要自定义Prometheus的监控规则和Grafana的仪表板。
接下来,我将一步一步教大家如何进行安装和部署!!
准备工作
服务器准备
必要前提:
- 一个充满求知欲的大脑。
- 一台 Linux 服务器(推荐腾讯云、阿里云或雨云等)。
我将以 雨云 为例,带大家创建一台自己的云服务器,以便学习本篇文章的内容。
注册链接: https://rainyun.ivwv.site
创建雨云服务器
以下步骤仅供参考,请根据实际需求选择配置。
- 点击 云产品 → 云服务器 → 立即购买。
- 选择距离你较近的区域,以保证低延迟。

- 按照自己需求选择配置,选择Ubuntu 22.04 版本,按照自己需求是否预装Docker。
- 最后按照提示进行购买。
- 购买后等待机器部署完毕,点击刚刚创建好的服务器,进入管理面板,找到远程连接相关信息。
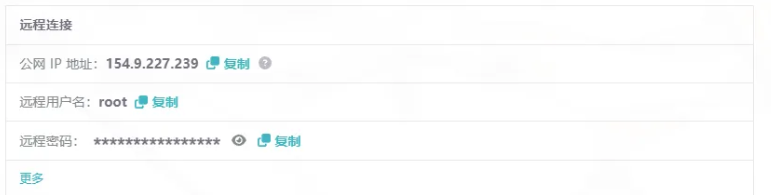
- 我们使用
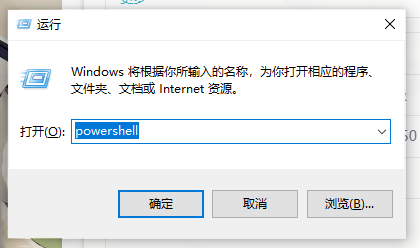
PowerShell进行SSH远程连接到服务器,Win+R打开运行窗口,输入powershell后点击确定。
- 输入
ssh root@你的服务器IP例如ssh root@154.9.227.239回车后,首次需要输入yes,再次回车后即可登录服务器。
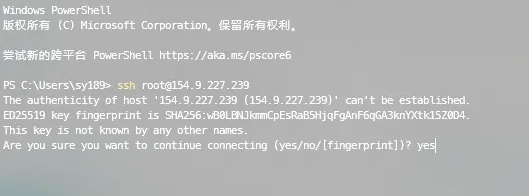
- 到此为止,我们的云服务器就远程连接上了。
开始部署
安装Prometheus
更新系统包
首先更新你的Ubuntu系统包,以确保你拥有最新系统版本。
bash
apt-get update && apt-get upgrade -y下载Prometheus
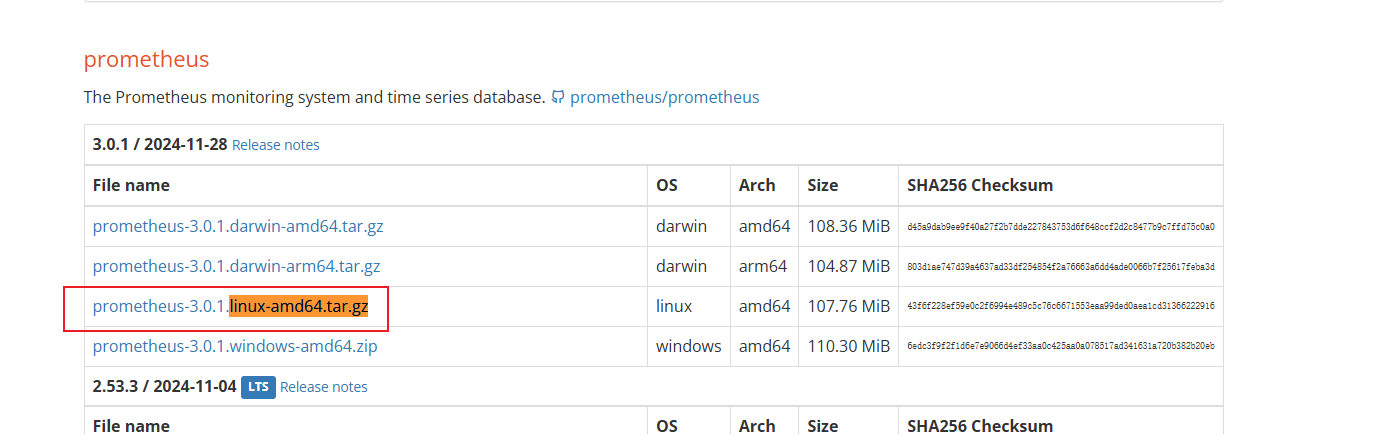
访问Prometheus的官方网站Prometheus官网并导航到下载页面,选择适合你的Ubuntu版本的包。
安装Prometheus
下载完成后,解压Prometheus tar包并移动到你希望的位置。
bash
wget https://github.com/prometheus/prometheus/releases/download/v3.0.1/prometheus-3.0.1.linux-amd64.tar.gz
tar zxvf prometheus-3.0.1.linux-amd64.tar.gz
cd prometheus-3.0.1.linux-amd64
配置Prometheus
Prometheus附带了一个名为"prometheus.yml"的默认配置文件,你可以根据监控需求进行自定义。
bash
cat prometheus.yml
# my global config
global:
  scrape_interval: 15s # Set the scrape interval to every 15 seconds. Default is every 1 minute.
  evaluation_interval: 15s # Evaluate rules every 15 seconds. The default is every 1 minute.
  # scrape_timeout is set to the global default (10s).

# Alertmanager configuration
alerting:
  alertmanagers:
    - static_configs:
        - targets:
          # - alertmanager:9093

# Load rules once and periodically evaluate them according to the global 'evaluation_interval'.
rule_files:
  # - "first_rules.yml"
  # - "second_rules.yml"

# A scrape configuration containing exactly one endpoint to scrape:
# Here it's Prometheus itself.
scrape_configs:
  # The job name is added as a label `job=<job_name>` to any timeseries scraped from this config.
  - job_name: "prometheus"

    # metrics_path defaults to '/metrics'
    # scheme defaults to 'http'.

    static_configs:
      - targets: ["localhost:9090"]
启动Prometheus
通过执行以下命令启动Prometheus服务器:
bash
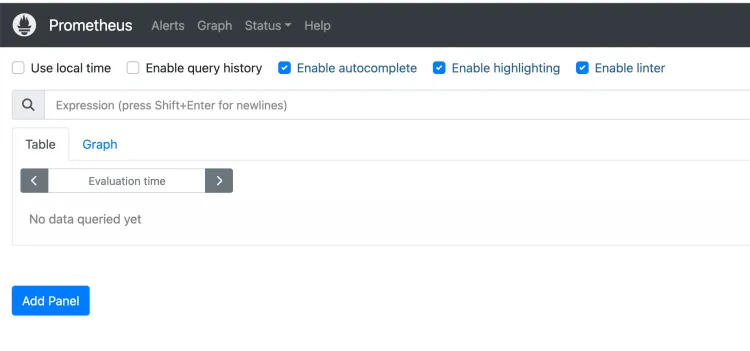
./prometheus --config.file=prometheus.yml验证Prometheus安装
在浏览器中访问http://your_domain:9090。如果Prometheus运行正确,你将看到Prometheus的Web界面。
安装Grafana
添加Grafana仓库
运行以下命令以将Grafana仓库添加到你的系统中:
bash
sudo apt install -y apt-transport-https
wget -q -O - https://packages.grafana.com/gpg.key | sudo apt-key add -
echo "deb https://packages.grafana.com/oss/deb stable main" | sudo tee /etc/apt/sources.list.d/grafana.list
安装Grafana
再次更新包列表并安装Grafana:
bash
sudo apt-get update
sudo apt-get install grafana
启动Grafana
启用并启动Grafana服务:
bash
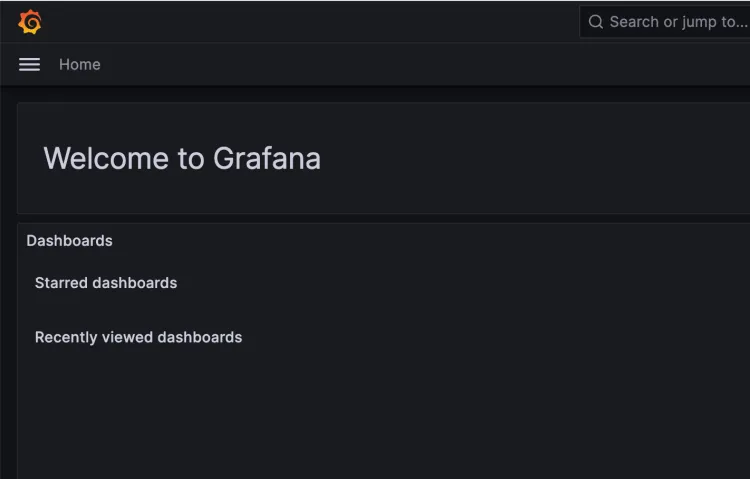
sudo systemctl enable --now grafana-server访问Grafana
在浏览器中访问http://your_server-ip:3000。需要设置新的管理员密码。按照屏幕上的指示完成设置即可。
执行以下命令以将管理员密码设置为新值:
bash
sudo systemctl stop grafana-server
sudo grafana-cli admin reset-admin-password <new_password>
sudo systemctl start grafana-server将<new_password>替换为你希望的新密码。
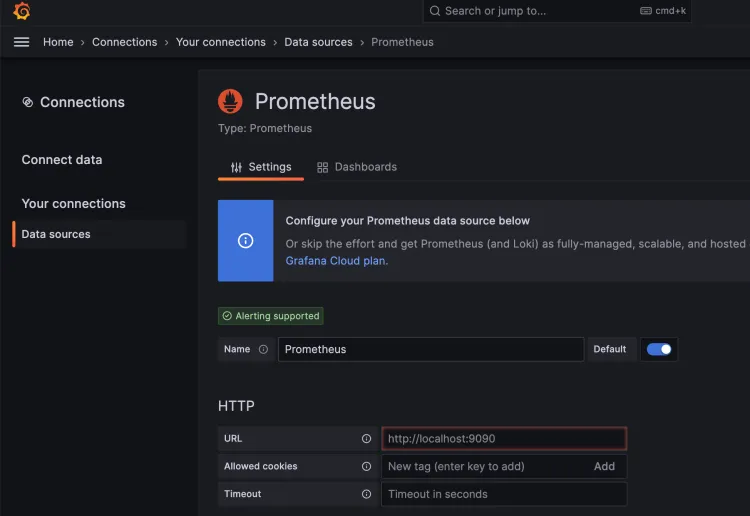
配置Prometheus作为数据源
在Grafana Web界面中,点击"Connections " > "Data Sources "。添加一个新的数据源并选择Prometheus 。提供你的Prometheus 服务器的URL(例如,http://your_domain:9090)并保存配置。
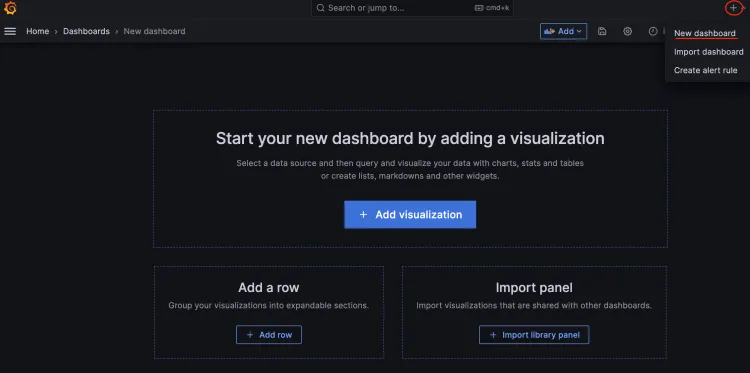
创建仪表板
Grafana提供了丰富的预构建仪表板和可视化工具。探索仪表板库或创建自定义仪表板,有效监控系统指标。
恭喜你!你已成功在Ubuntu系统上安装了Prometheus和Grafana。通过这个监控设置,你现在可以深入了解你的基础设施性能,并及时解决任何问题。尝试Grafana的可视化选项,创建适合你监控需求的个性化仪表板。继续探索Prometheus和Grafana的能力,释放它们的全部潜力。
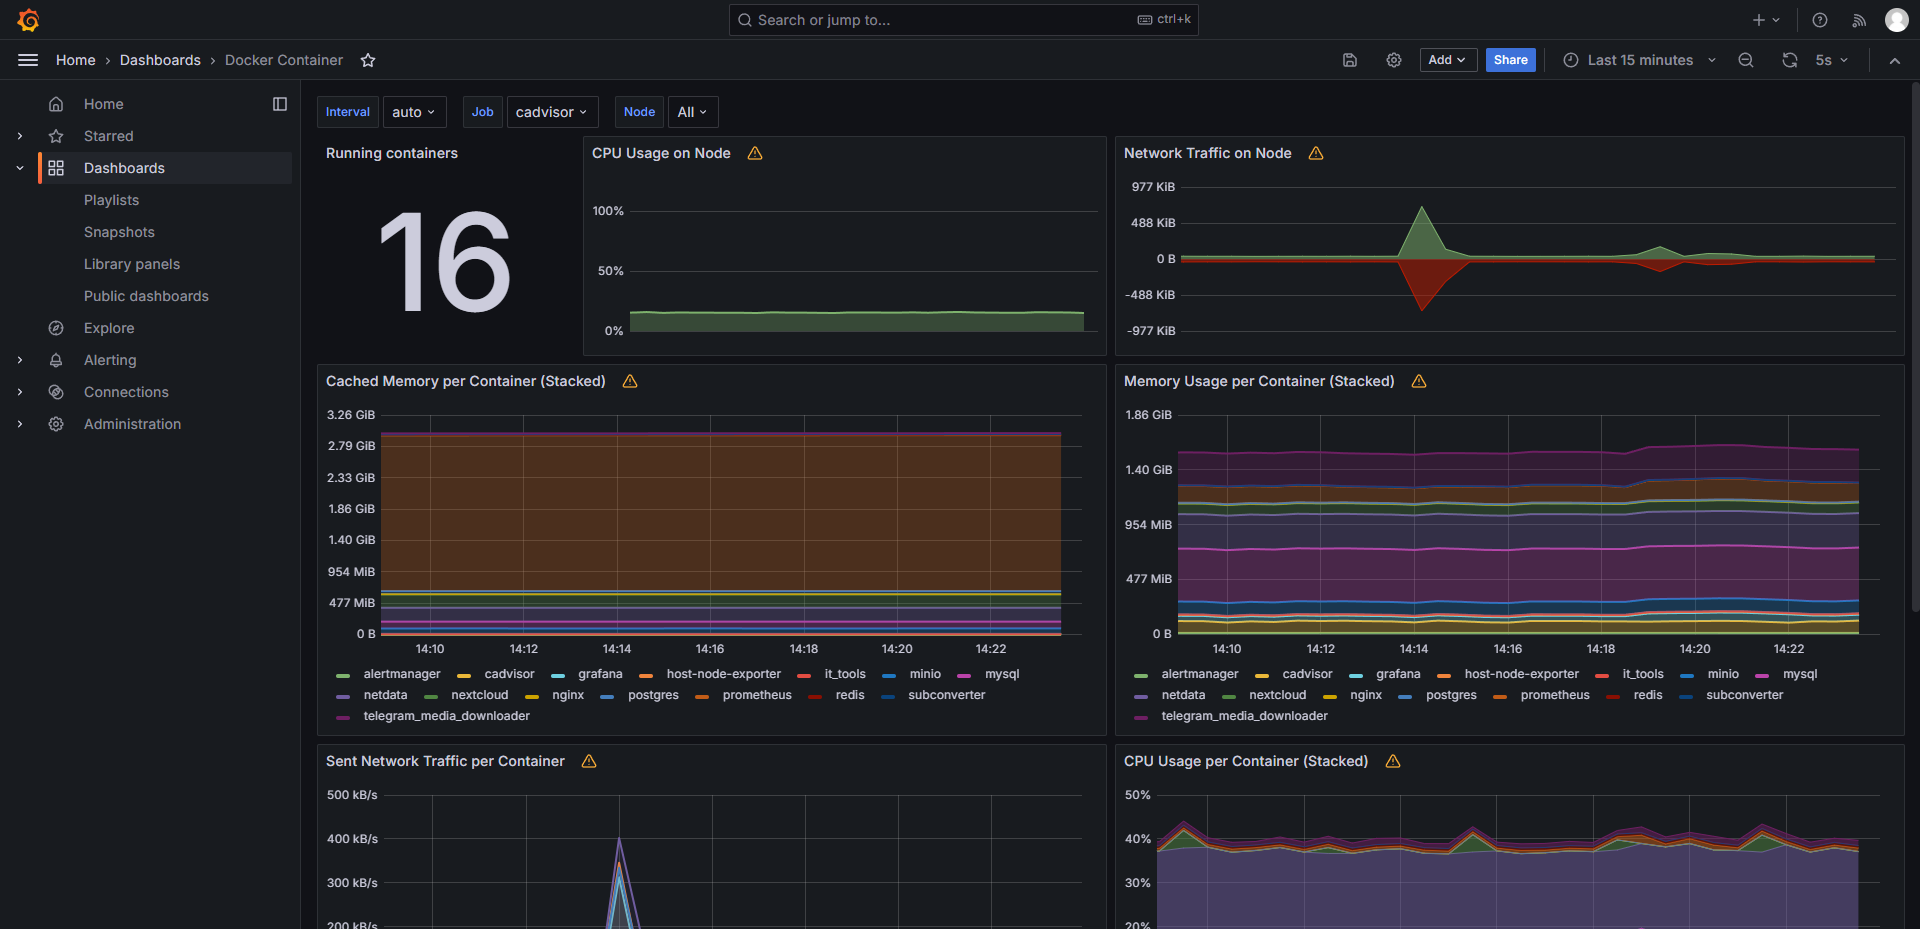
Grafana 推荐模板以及效果展示
Node Exporter Full : https://grafana.com/grafana/dashboards/11600-docker-container/
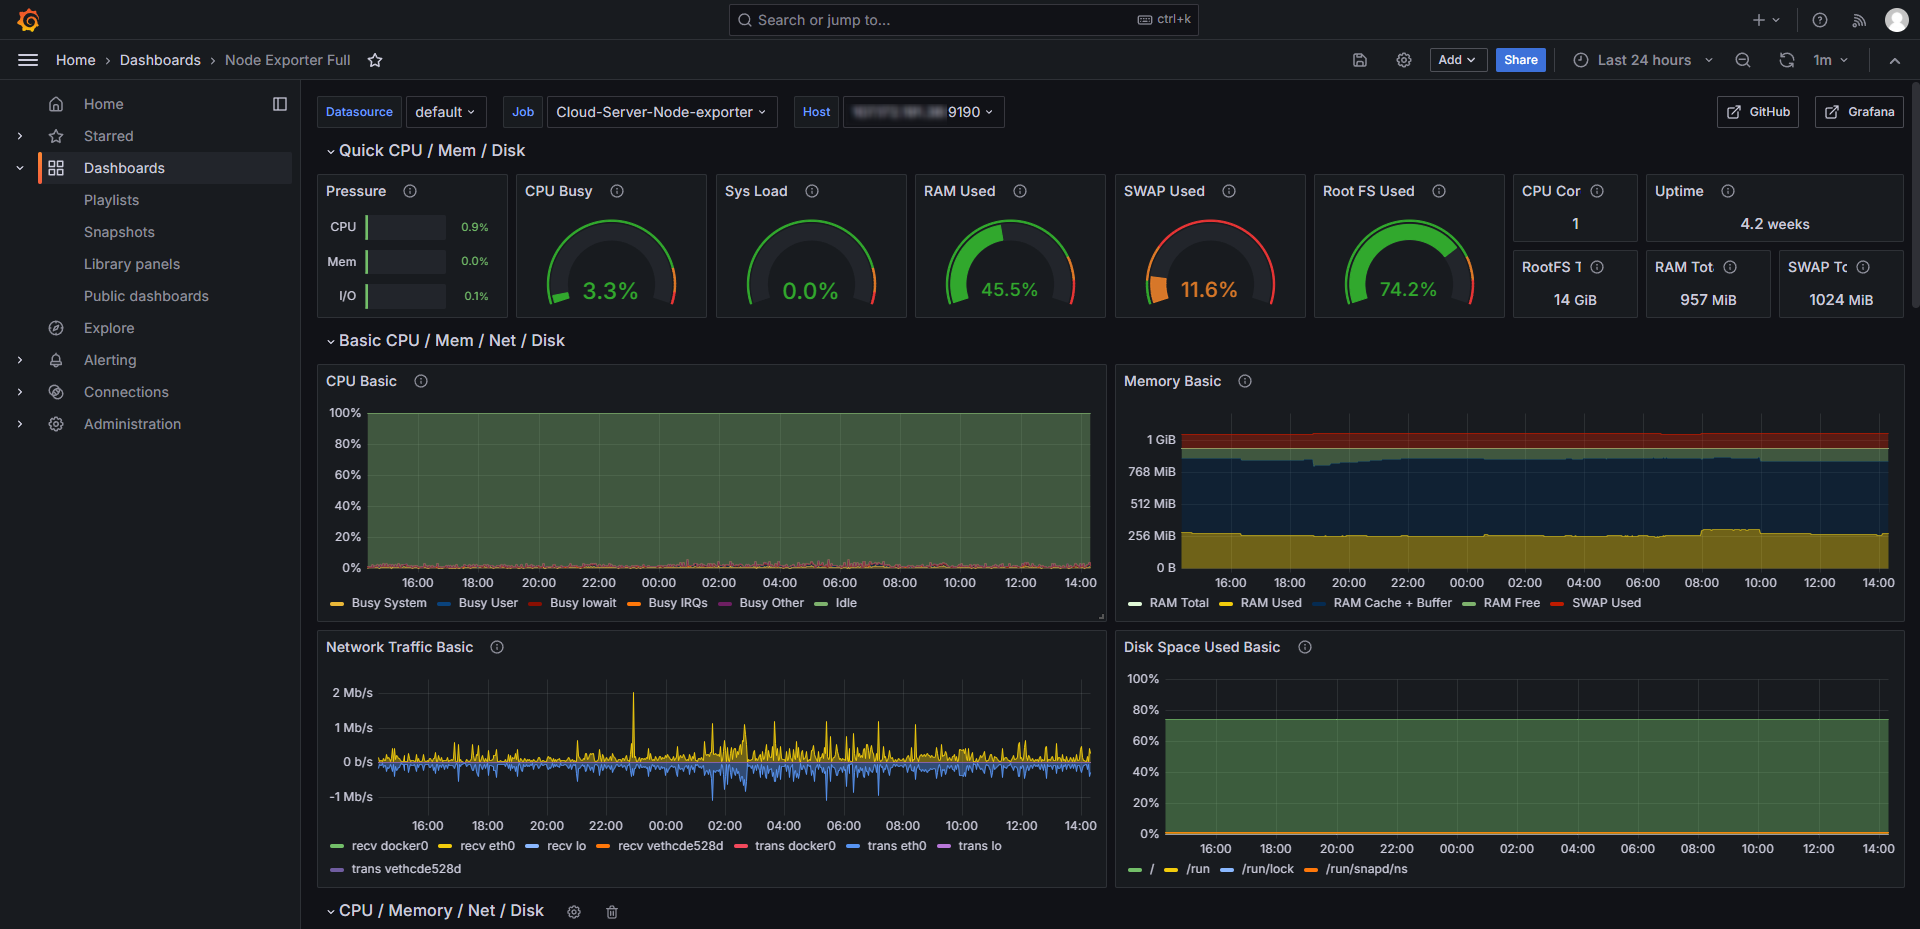
Docker Container: https://grafana.com/grafana/dashboards/1860-node-exporter-full/
也可以自己在 Grafana 的模板商店里面选择合适自己的模板 https://grafana.com/grafana/dashboards/
相关链接
雨云 - 新一代云服务提供商: https://rainyun.ivwv.site