【1】引言
前序学习进程中,已经掌握使用cv2.line()函数绘制线段的基本用法,结合对BGR通道颜色的调控,可以灵活输出由线段组成的文字类图像,相关链接包括且不限于:
python学opencv|读取图像(六)读取图像像素RGB值_opencv读取灰度图-CSDN博客
python学opencv|读取图像(十八)使用cv2.line创造线段-CSDN博客
在此基础上,我们按照点线面的逻辑。既然已经掌握绘制线段的技巧,那就尝试让它们连成图像,这次课我们开始绘制矩形的探索。
【2】官网教程
点击下述链接,直达官网教程:
在此处,我们会看到对cv2.rectangle()函数的详细解释:
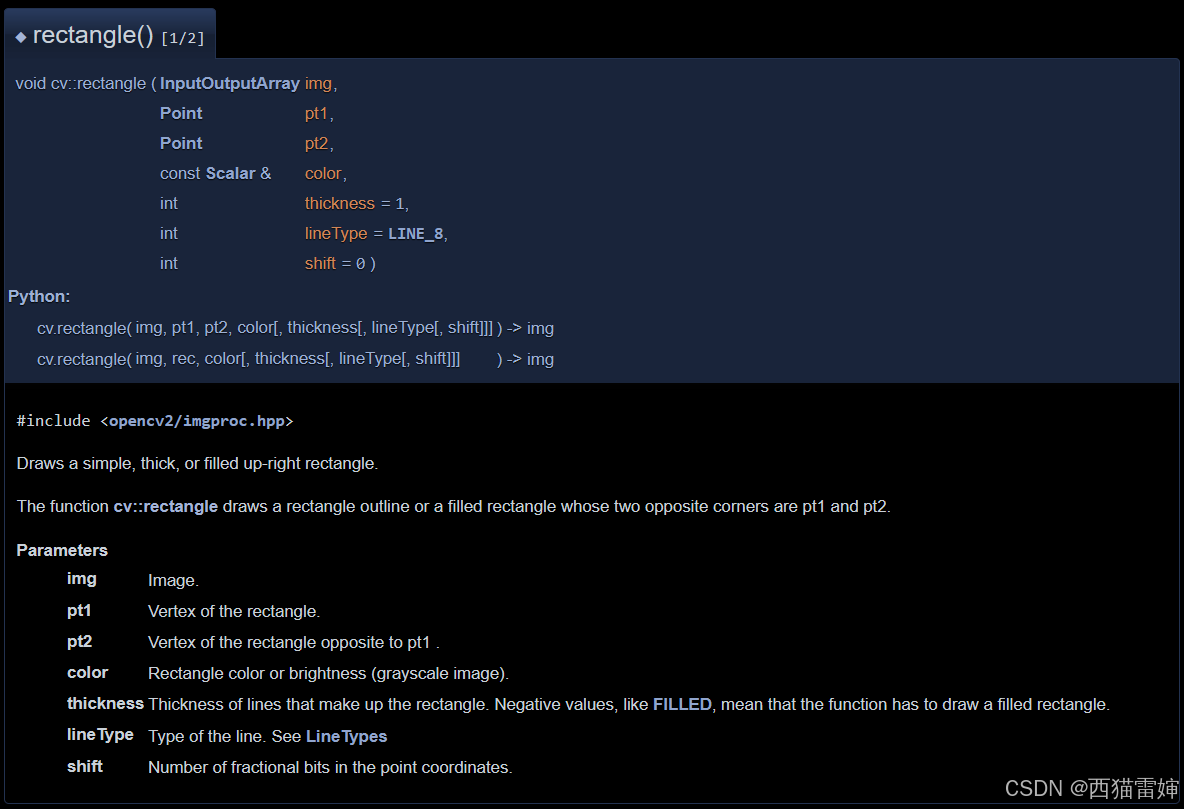
++图1++
这里的几个参数意义为:
void cv::rectangle ( InputOutputArray img, #绘图的画布,需提前准备
Point pt1, #矩形的左上角
Point pt2, #矩形的右下角
const Scalar & color, #矩形线条颜色
int thickness = 1, #矩形线条粗细
int lineType = LINE_8, #图像线段存储类型
int shift = 0 ) #点坐标的小数位数,暂无需关注
【3】代码测试
从这里,我们开始测试代码。
代码可以在绘制线段的基础上稍作修改,这里先给出完整段落:
python
import numpy as np  # 引入numpy模块
import cv2 as cv  # 引入cv模块

canvas = np.ones((580, 580, 3), np.uint8)*158  # 绘制一个580*580大小的画布,3代表有3个通道,unit8为图像存储格式
canvas = cv.rectangle(canvas, (50, 30), (530, 550), (155, 120, 60), 5)  # 矩形
canvas = cv.rectangle(canvas, (80, 80), (500, 500), (55, 160, 230), 10)  # 矩形
canvas = cv.rectangle(canvas, (150, 150), (430, 430), (50, 120, 90), -1)  # 矩形
#canvas = cv.line(canvas, (50, 550), (550, 550), (58, 50, 150), 15)  # 线段
#canvas = cv.line(canvas, (300, 50), (300, 550), (120, 150, 25), 20)  # 线段

cv.imshow('rectangle', canvas)  # 在屏幕展示你画线段的效果
cv.imwrite('rectangle.png', canvas)  # 保存图像
cv.waitKey()  # 图像不会自动关闭
cv.destroyAllWindows()  # 释放所有窗口
修改后的核心段落为:
python
canvas = np.ones((580, 580, 3), np.uint8)*158  # 绘制一个580*580大小的画布,3代表有3个通道,unit8为图像存储格式
canvas = cv.rectangle(canvas, (50, 30), (530, 550), (155, 120, 60), 5)  # 矩形
canvas = cv.rectangle(canvas, (80, 80), (500, 500), (55, 160, 230), 10)  # 矩形
canvas = cv.rectangle(canvas, (150, 150), (430, 430), (50, 120, 90), -1)  # 矩形
#canvas = cv.line(canvas, (50, 550), (550, 550), (58, 50, 150), 15)  # 线段
#canvas = cv.line(canvas, (300, 50), (300, 550), (120, 150, 25), 20)  # 线段
这里使用了三个cv2.rectangle()函数,分别绘制了三个矩形。
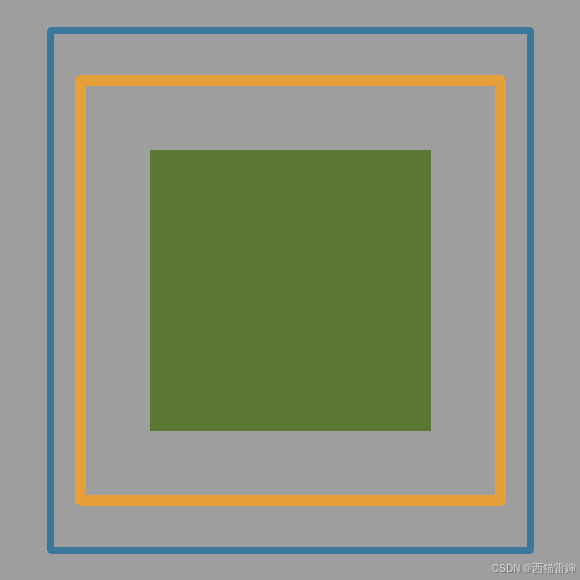
由于画布的大小是580*580,这里的三个矩形其实是同心正中分布:
第一个矩形,分别以(50, 30)和(530, 550)为左上、右下坐标点绘制矩形,颜色BGR组成为(155, 120, 60),线条粗细为5;
第二个矩形,分别以(80, 80)和(500, 500)为左上、右下坐标点绘制矩形,颜色BGR组成为(55, 160, 230),线条粗细为10;
第三个矩形,分别以(150, 150)和(430, 430)为左上、右下坐标点绘制矩形,颜色BGR组成为(50, 120, 90),线条粗细为-1代表是一个实心矩形。
在绘制矩形的代码下方,还留有cv2.line()函数作为对照。
运行代码后的输出图像为:
++图2++
【4】代码修改
同样的,如果我们想修改画布颜色,可以增添一些代码。
代码增添可以参考opencv绘制彩色图像学习文章:
python学opencv|读取图像(十)用numpy创建彩色图像_用numpyimwrite图像-CSDN博客
比如,设置各个通道的值为常数:
canvas[:,:,0]=150 #通道1
canvas[:,:,1]=100 #通道2
canvas[:,:,2]=200 #通道3
完整代码为:
python
import numpy as np  # 引入numpy模块
import cv2 as cv  # 引入cv模块

canvas = np.ones((580, 580, 3), np.uint8)*158  # 绘制一个580*580大小的画布,3代表有3个通道,unit8为图像存储格式
canvas[:,:,0]=150 #通道1
canvas[:,:,1]=100 #通道2
canvas[:,:,2]=200 #通道3
canvas = cv.rectangle(canvas, (50, 30), (530, 550), (155, 120, 60), 5)  # 矩形
canvas = cv.rectangle(canvas, (80, 80), (500, 500), (55, 160, 230), 10)  # 矩形
canvas = cv.rectangle(canvas, (150, 150), (430, 430), (50, 120, 90), -1)  # 矩形
#canvas = cv.line(canvas, (50, 550), (550, 550), (58, 50, 150), 15)  # 线段
#canvas = cv.line(canvas, (300, 50), (300, 550), (120, 150, 25), 20)  # 线段

cv.imshow('rectangle', canvas)  # 在屏幕展示你画线段的效果
cv.imwrite('rectangle.png', canvas)  # 保存图像
cv.waitKey()  # 图像不会自动关闭
cv.destroyAllWindows()  # 释放所有窗口
输出图像为:
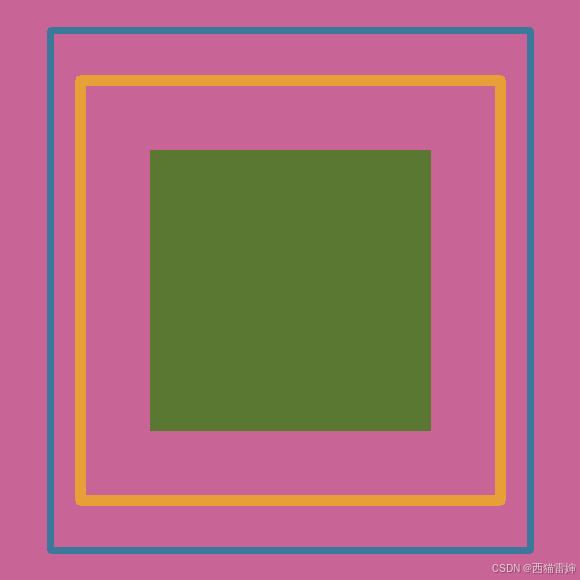
++图3++
如果修改为渐变背景,把各个通道改为三角函数动态取值:
# 第一个通道值
for i in range(0, 580, 1):
    for j in range(0, 580, 1):
        canvas[i, j, 0] = 0.2 * (i + j)  # 第一个通道值

# 第二个通道值
for i in range(0, 580, 1):
    for j in range(0, 580, 1):
        canvas[i, j, 1] = 200 * np.cos(i ^ j) + 55 * np.sin(j ^ i)  # 第二个通道值

# 第三个通道值
for i in range(0, 580, 1):
    for j in range(0, 580, 1):
        canvas[i, j, 2] = 255 * np.tanh(i + j)  # 第三个通道值
此时的完整代码为:
python
import numpy as np  # 引入numpy模块
import cv2 as cv  # 引入cv模块

canvas = np.ones((580, 580, 3), np.uint8)*158  # 绘制一个580*580大小的画布,3代表有3个通道,unit8为图像存储格式
# 第一个通道值
for i in range(0, 580, 1):
    for j in range(0, 580, 1):
        canvas[i, j, 0] = 0.2 * (i + j)  # 第一个通道值

# 第二个通道值
for i in range(0, 580, 1):
    for j in range(0, 580, 1):
        canvas[i, j, 1] = 200 * np.cos(i ^ j) + 55 * np.sin(j ^ i)  # 第二个通道值

# 第三个通道值
for i in range(0, 580, 1):
    for j in range(0, 580, 1):
        canvas[i, j, 2] = 255 * np.tanh(i + j)  # 第三个通道值

canvas = cv.rectangle(canvas, (50, 30), (530, 550), (155, 120, 60), 5)  # 矩形
canvas = cv.rectangle(canvas, (80, 80), (500, 500), (55, 160, 230), 10)  # 矩形
canvas = cv.rectangle(canvas, (150, 150), (430, 430), (50, 120, 90), -1)  # 矩形
#canvas = cv.line(canvas, (50, 550), (550, 550), (58, 50, 150), 15)  # 线段
#canvas = cv.line(canvas, (300, 50), (300, 550), (120, 150, 25), 20)  # 线段

cv.imshow('rectangle', canvas)  # 在屏幕展示你画线段的效果
cv.imwrite('rectangle.png', canvas)  # 保存图像
cv.waitKey()  # 图像不会自动关闭
cv.destroyAllWindows()  # 释放所有窗口
运行后获得的图像为:
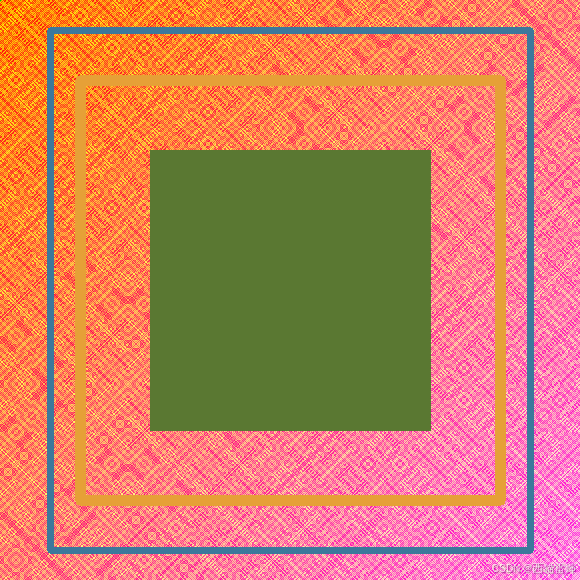
++图4++
再稍加修改:
# 第一个通道值
for i in range(0, 580, 1):
    for j in range(0, 580, 1):
        canvas[i, j, 0] = 0.2 * (i + j)+0.2 * (i - j)  # 第一个通道值

# 第二个通道值
for i in range(0, 580, 1):
    for j in range(0, 580, 1):
        canvas[i, j, 1] = 200 * np.cos(i ^ j) + 55 * np.sin(j ^ i)  # 第二个通道值

# 第三个通道值
for i in range(0, 580, 1):
    for j in range(0, 580, 1):
        canvas[i, j, 2] = 255 * np.tanh(i + j) +255 * np.tanh(i - j) # 第三个通道值
完整代码为:
python
import numpy as np  # 引入numpy模块
import cv2 as cv  # 引入cv模块

canvas = np.ones((580, 580, 3), np.uint8)*158  # 绘制一个580*580大小的画布,3代表有3个通道,unit8为图像存储格式
# 第一个通道值
for i in range(0, 580, 1):
    for j in range(0, 580, 1):
        canvas[i, j, 0] = 0.2 * (i + j)+0.2 * (i - j)  # 第一个通道值

# 第二个通道值
for i in range(0, 580, 1):
    for j in range(0, 580, 1):
        canvas[i, j, 1] = 200 * np.cos(i ^ j) + 55 * np.sin(j ^ i)  # 第二个通道值

# 第三个通道值
for i in range(0, 580, 1):
    for j in range(0, 580, 1):
        canvas[i, j, 2] = 255 * np.tanh(i + j) +255 * np.tanh(i - j) # 第三个通道值

canvas = cv.rectangle(canvas, (50, 30), (530, 550), (155, 120, 60), 5)  # 矩形
canvas = cv.rectangle(canvas, (80, 80), (500, 500), (55, 160, 230), 10)  # 矩形
canvas = cv.rectangle(canvas, (150, 150), (430, 430), (50, 120, 90), -1)  # 矩形
#canvas = cv.line(canvas, (50, 550), (550, 550), (58, 50, 150), 15)  # 线段
#canvas = cv.line(canvas, (300, 50), (300, 550), (120, 150, 25), 20)  # 线段

cv.imshow('rectangle', canvas)  # 在屏幕展示你画线段的效果
cv.imwrite('rectangle.png', canvas)  # 保存图像
cv.waitKey()  # 图像不会自动关闭
cv.destroyAllWindows()  # 释放所有窗口
运行后的输出图像为:
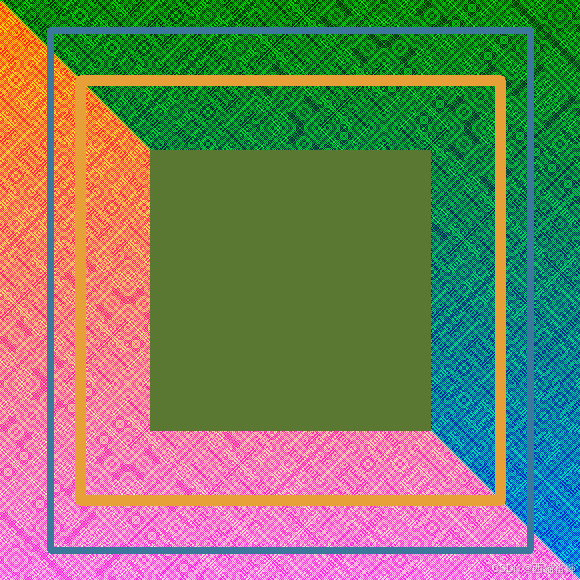
++图5++
【5】总结
掌握了使用cv2.rectangle()函数绘制矩形的基本操作技巧。