程序来自于Github,以下这篇博客作为完整的学习记录,也callback上一篇爬取公共交通站点的博文。
1. 导入库
首先是程序需要的python库。
python
import requests
import json
import pandas as pd
from lxml import etree
import time
from tqdm import tqdm-
requests:用于发送HTTP请求,获取网页内容或API数据。 -
json:用于处理JSON格式的数据。 -
pandas:用于数据处理和保存为CSV文件。 -
lxml:用于解析HTML内容。 -
time:用于控制爬取速度,避免过快请求导致被封禁。 -
tqdm:用于显示进度条,方便查看爬取进度。
2. 获取城市公交线路名称(get_bus_line_name 函数)
python
def get_bus_line_name(city_phonetic):
    url = 'http://{}.gongjiao.com/lines_all.html'.format(city_phonetic)
    r = requests.get(url).text
    et = etree.HTML(r)
    line_name = et.xpath('//div[@class="list"]//a/text()')
return line_name这里同样也需要先爬取公交线路的名称,函数需要传入city_phonetic也就是城市的拼音(如 changsha、wuhan),函数会返回该城市所有公交线路的名称列表(line_name)。
3. 爬取公交路线(get_line_station_data 函数)
获取公交线路的url是高德的https://restapi.amap.com/v3/bus/linename?extensions=all&key={ak}&output=json&city={city}&offset=1&keywords={line_name}
那么先来看一下官方的介绍,这里使用的是公交路线关键字查询,也就是说我们要输入公交路线的关键字,例如15路等等。
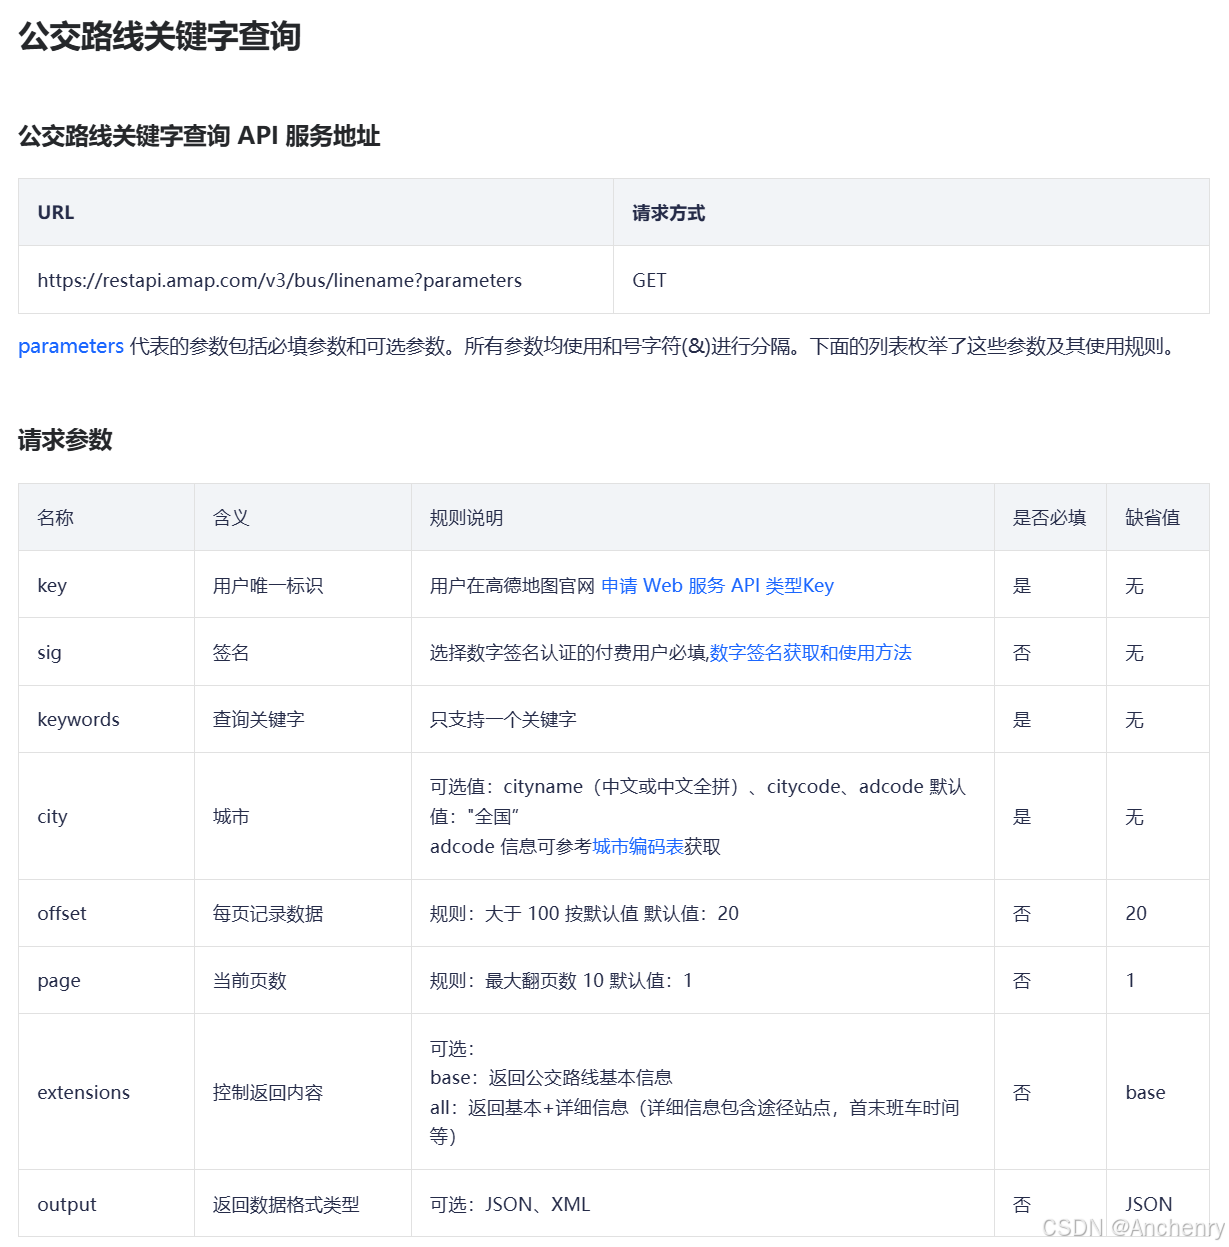
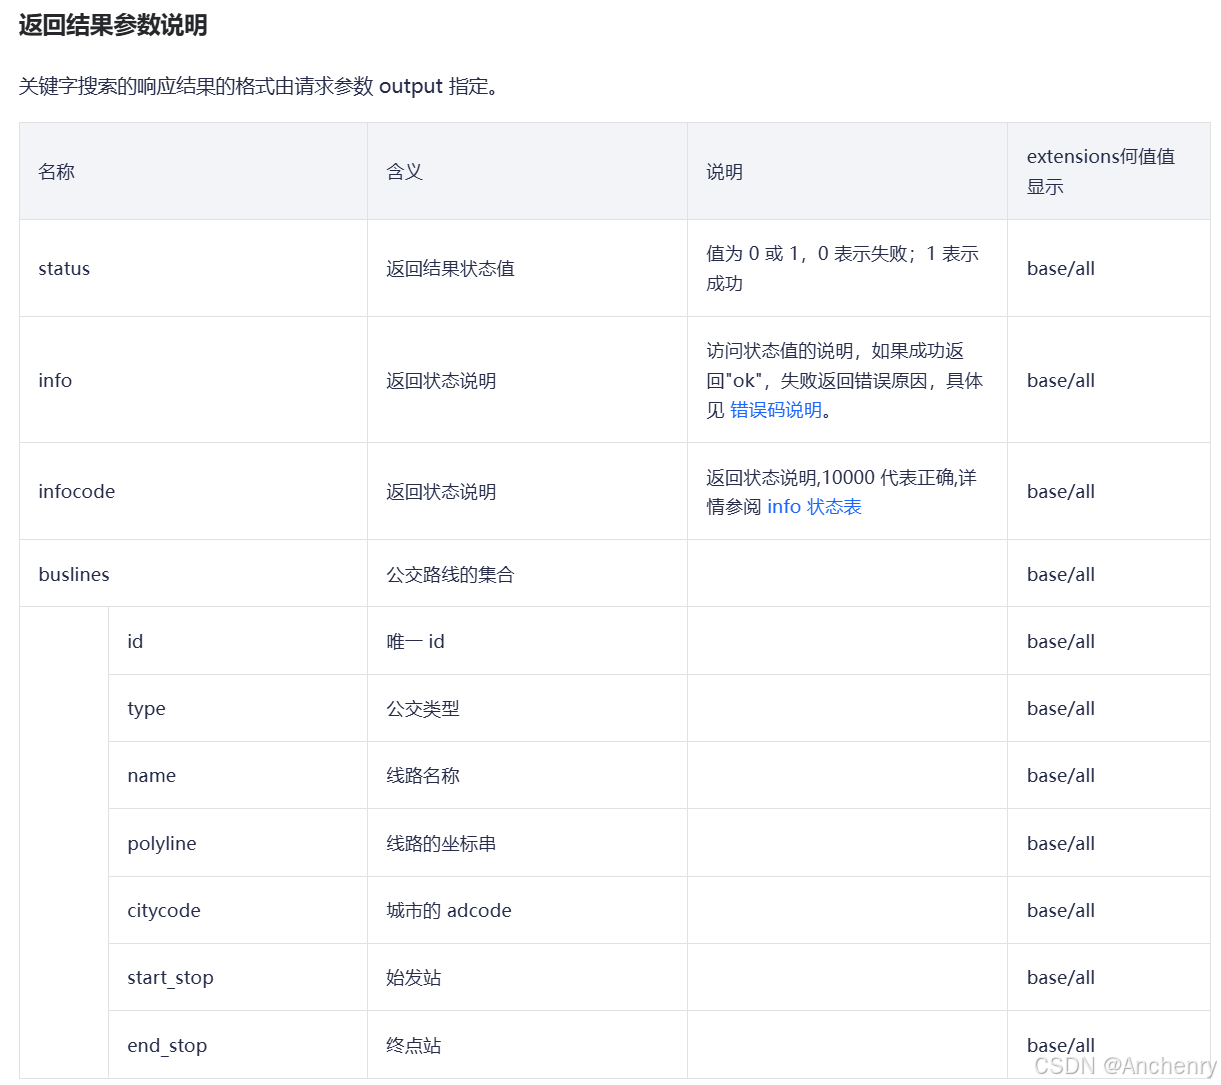
返回的内容如下,status记录了查询成功与否,buslines中记录了查询成功的公交路线。
接下来来看代码:
python
def get_line_station_data(city, line_name, ak, city_phonetic):
    print(f'正在获取-->{line_name}')
    time.sleep(1)
    url = f'https://restapi.amap.com/v3/bus/linename?extensions=all&key={ak}&output=json&city={city}&offset=1&keywords={line_name}'
    r = requests.get(url).text
    rt = json.loads(r)
    try:
        if rt['buslines']:
            if len(rt['buslines']) == 0:
                print('no data in list..')
            else:
                dt = {}
                dt['line_name'] = rt['buslines'][0]['name']
                dt['polyline'] = rt['buslines'][0]['polyline']
                dt['total_price'] = rt['buslines'][0]['total_price']

                station_name = []
                station_coords = []
                for st in rt['buslines'][0]['busstops']:
                    station_name.append(st['name'])
                    station_coords.append(st['location'])

                dt['station_name'] = station_name
                dt['station_corrds'] = station_coords

                dm = pd.DataFrame([dt])
                dm.to_csv(f'{city_phonetic}_lines.csv',
                          mode='a',
                          header=False,
                          index=False,
                          encoding='utf_8_sig')
        else:
            print('data not avaliable..')
            with open('data not avaliable.log', 'a') as f:
                f.write(line_name + '\n')
    except:
        print('error.. try it again..')
        time.sleep(2)
        get_line_station_data(city, line_name, ak, city_phonetic)
函数通过高德地图API获取某条公交线路的详细信息,并保存到CSV文件中。通过构造API请求URL获取公交线路数据,解析响应并提取线路名称、路径、票价、站点名称和坐标,将数据保存到CSV文件,若数据不可用则记录日志,失败时等待2秒后重试。
如果爬取失败的话,检查一下key是否达到了限额,一天只能爬取5000次,爬取公交线路比较耗费次数。
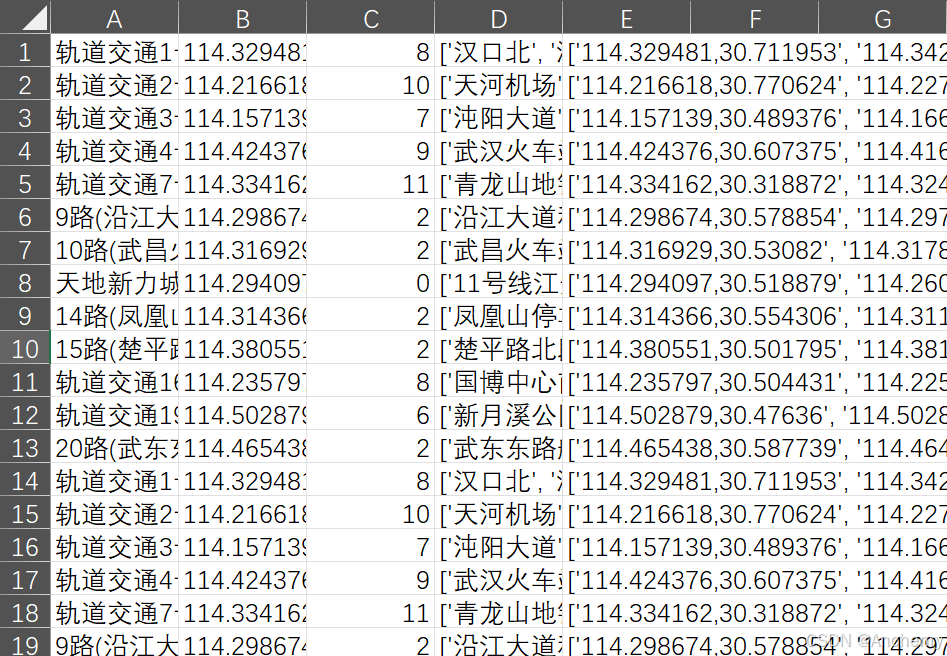
爬取完成后来看一下保存的csv,总共5列。
- A列:公交线路关键字(名称)
- B列:公交线路polyline,也就是线路途径的每个点(注意不是站点,公交线路的每个拐点都会被记录)
- C列:总价
- D列:途径站点关键字(名称)
- E列:途径站点经纬度坐标
4. 主程序调用
python
if __name__ == '__main__':
    city = '益阳'
    city_phonetic = 'yiyang'
    ak = '###'  # 这里建议更改为自己的key

    start_time = time.time()
    print(f'==========正在获取 {city} 线路名称==========')
    line_names = get_bus_line_name(city_phonetic)
    print(f'{city}在公交网上显示共有{len(line_names)}条线路')
    for line_name in tqdm(line_names):
        get_line_station_data(city, line_name, ak, city_phonetic)
    end_time = time.time()
    print(f'我爬完啦, 耗时{end_time - start_time}秒')
自己需要设置的是最开始的city、city_phonetic、ak.
程序调用了上面的函数并记录了爬取的时间。
5. 线路、站点转成shp
那么有了这个csv怎么可视化呢?
那么作者就写了DataToShp这个 类用于将公交线路和站点数据从CSV文件转换为Shapefile格式,主要功能包括:
get_station_data:将站点坐标和名称从字符串格式转换为列表格式,将数据从横向展开为纵向,并去除重复项;
get_line_data:将线路的折线数据从字符串格式转换为列表格式;
create_station_shp:创建站点Shapefile,包含站点名称和坐标;
create_lines_shp:创建线路Shapefile,包含线路名称和折线坐标;
其实作者其实在这里还引入了从高德的火星坐标系转换为WGS_84的函数,但是大部分时候这种转换并不可靠,所以建议高德爬取的数据就搭配高德地图进行可视化使用。
python
# -*- coding: utf-8 -*-
# @Author: Bardbo
# @Date:   2020-11-09 21:09:12
# @Last Modified by:   Bardbo
# @Last Modified time: 2020-11-09 21:59:35
import pandas as pd
import numpy as np
import shapefile
# import converter

class DataToShp:
    def __init__(self, filename):
        self.data = pd.read_csv(filename,
                                names=[
                                    'line_name', 'polyline', 'price',
                                    'station_names', 'station_coords'
                                ])

    def get_station_data(self):
        df_stations = self.data[['station_coords', 'station_names']]
        # 将原本的一行字符串变为列表
        df_stations['station_coords'] = df_stations['station_coords'].apply(
            lambda x: x.replace('[', '').replace(']', '').replace(
                '\'', '').split(', '))
        df_stations['station_names'] = df_stations['station_names'].apply(
            lambda x: x.replace('[', '').replace(']', '').replace(
                '\'', '').split(', '))
        # 横置的数据变为纵向的数据
        station_all = pd.DataFrame(\
                      np.column_stack((\
                                       np.hstack(df_stations['station_coords'].repeat(list(map(len, df_stations['station_coords'])))),
                                       np.hstack(df_stations['station_names'].repeat(list(map(len, df_stations['station_names']))))
                                     )),
                      columns=['station_coords','station_names'])
        # 去除重复
        station_all = station_all.drop_duplicates()
        # # 坐标转换
        # station_all['st_coords_wgs84'] = station_all['station_coords'].apply(
        #     self.stations_to_wgs84)
        station_all.reset_index(inplace=True)
        self.stations = station_all

    def get_line_data(self):
        df_lines = self.data[['line_name', 'polyline']]
        df_lines['polyline'] = df_lines['polyline'].apply(
            lambda x: x.split(';'))
        # # 坐标转换
        # df_lines['lines_wgs84'] = df_lines['polyline'].apply(
        #     self.lines_to_wgs84)
        df_lines.reset_index(inplace=True)
        self.lines = df_lines

    # def stations_to_wgs84(self, coor):
    #     xy = coor.split(',')
    #     lng, lat = float(xy[0]), float(xy[1])
    #     return converter.gcj02_to_wgs84(lng, lat)
    #
    # def lines_to_wgs84(self, coor):
    #     ls = []
    #     for c in coor:
    #         xy = c.split(',')
    #         lng, lat = float(xy[0]), float(xy[1])
    #         ls.append(converter.gcj02_to_wgs84(lng, lat))
    #     return ls

    def create_station_shp(self, city_phonetic):
        w = shapefile.Writer(f'./data/{city_phonetic}_stations.shp')
        w.field('name', 'C')
        # 确保所有坐标都是浮动类型
        for i in range(len(self.stations)):
            coords = self.stations.loc[i, 'station_coords'].split(',')  # 获取坐标
            lat = float(coords[0])  # 强制转换为浮动类型
            lon = float(coords[1])  # 强制转换为浮动类型
            # 确保坐标是浮动类型
            w.point(lat, lon)  # 写入点
            w.record(self.stations.loc[i, 'station_names'])  # 写入记录
        w.close()

    def create_lines_shp(self, city_phonetic):
        w = shapefile.Writer(f'./data/{city_phonetic}_lines.shp')
        w.field('name', 'C')
        for i in range(len(self.lines)):
            polyline = self.lines['polyline'][i]
            # 如果 polyline 是字符串,则使用 split();如果是列表,则直接使用
            if isinstance(polyline, list):
                polyline = [list(map(float, point.split(','))) for point in polyline]
            # 确保 polyline 是列表类型,进行写入
            w.line([polyline])
            w.record(self.lines['line_name'][i])
        w.close()


if __name__ == '__main__':
    dts = DataToShp('yiyang_lines.csv')
    dts.get_station_data()
    dts.get_line_data()
    dts.create_station_shp()
    dts.create_lines_shp()
    print('shp文件创建完成')
如下就是可视化后的效果【爬的时候无意中发现学校这多了两条公交,深入鄂州,win!】