文章目录
- 前言
- 一、监控体系架构设计
-
- [1.1 全链路监控系统组成](#1.1 全链路监控系统组成)
- [1.2 核心监控指标清单](#1.2 核心监控指标清单)
- 二、性能数据采集实战
-
- [2.1 增强版性能采集器](#2.1 增强版性能采集器)
- [2.2 用户行为轨迹录制](#2.2 用户行为轨迹录制)
- 三、深度性能优化策略
-
- [3.1 构建阶段优化(Webpack 5 示例)](#3.1 构建阶段优化(Webpack 5 示例))
- [3.2 运行时优化技巧](#3.2 运行时优化技巧)
- 四、错误监控与智能诊断
-
- [4.1 增强型错误边界](#4.1 增强型错误边界)
- [4.2 网络请求监控](#4.2 网络请求监控)
- 五、生产环境调优指南
-
- [5.1 Nginx 极致配置](#5.1 Nginx 极致配置)
- [5.2 CDN 策略优化](#5.2 CDN 策略优化)
- 六、自动化质量保障体系
-
- [6.1 CI/CD 集成流程](#6.1 CI/CD 集成流程)
- [6.2 性能回归测试](#6.2 性能回归测试)
- 七、可视化与智能分析
-
- [7.1 Grafana 监控面板配置](#7.1 Grafana 监控面板配置)
- [7.2 智能报警规则](#7.2 智能报警规则)
- 八、移动端专项优化
-
- [8.1 移动端性能增强](#8.1 移动端性能增强)
- [8.2 移动端监控差异点](#8.2 移动端监控差异点)
- 全链路监控系统部署流程
前言
技术栈
React/Vue/Angular + Webpack/Vite + Sentry + Prometheus + Grafana + Lighthouse
覆盖范围
🚩 性能监控 → 🚩 错误追踪 → 🚩 优化策略 → 🚩 自动化测试 → 🚩 生产调优
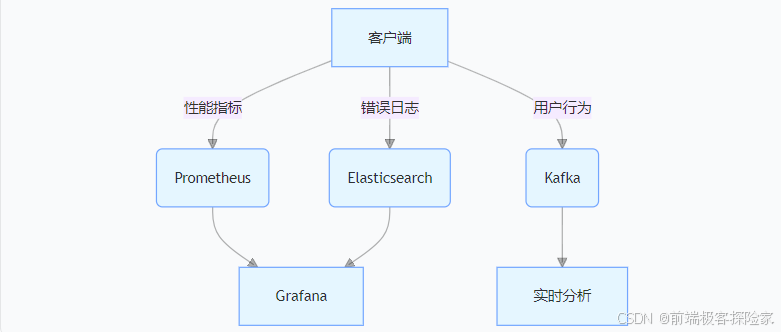
一、监控体系架构设计
1.1 全链路监控系统组成
1.2 核心监控指标清单
| 类别 | 指标 | 采集方式 | 达标阈值 |
|---|---|---|---|
| 加载性能 | FP/FCP/LCP | PerformanceObserver | LCP ≤2.5s |
| 交互响应 | FID/INP | Event Timing API | FID ≤100ms |
| 视觉稳定性 | CLS | Layout Instability API | CLS ≤0.1 |
| 资源加载 | CSS/JS Size | Resource Timing API | JS ≤300KB |
| 异常监控 | JS Error/API Error | window.onerror + XHR Hook | 错误 ≤1/1000PV |
二、性能数据采集实战
2.1 增强版性能采集器
typescript
class PerformanceMonitor {
  constructor() {
    this.metrics = {}
    this.initPaintMetrics()
    this.initResourceMetrics()
    this.initCustomMetrics()
  }

  initPaintMetrics() {
    const observer = new PerformanceObserver(list => {
      list.getEntries().forEach(entry => {
        this.metrics[entry.name] = entry.startTime
      })
    })
    observer.observe({ type: 'paint', buffered: true })
  }

  initResourceMetrics() {
    const observer = new PerformanceObserver(list => {
      list.getEntries().forEach(entry => {
        this.metrics[entry.name] = {
          duration: entry.duration,
          type: entry.initiatorType
        }
      })
    })
    observer.observe({ type: 'resource', buffered: true })
  }

  initCustomMetrics() {
    // 自定义时间标记
    performance.mark('customStart')
    // ...业务逻辑
    performance.mark('customEnd')
    performance.measure('customDuration', 'customStart', 'customEnd')
  }

  report() {
    navigator.sendBeacon('/analytics', this.metrics)
  }
}
2.2 用户行为轨迹录制
typescript
class UserSessionRecorder {
  constructor() {
    this.events = []
    this.startTime = Date.now()
    this.initListeners()
  }

  initListeners() {
    const events = ['click', 'input', 'scroll', 'touchstart']
    events.forEach(type => {
      window.addEventListener(type, e => {
        this.events.push({
          type,
          target: e.target?.tagName,
          timestamp: Date.now() - this.startTime,
          position: `${e.clientX},${e.clientY}`
        })
      }, { capture: true })
    })
  }

  export() {
    return {
      duration: Date.now() - this.startTime,
      events: this.events
    }
  }
}
三、深度性能优化策略
3.1 构建阶段优化(Webpack 5 示例)
typescript
// webpack.config.prod.js
module.exports = {
  optimization: {
    splitChunks: {
      chunks: 'all',
      maxInitialRequests: 5,
      cacheGroups: {
        vendors: {
          test: /[\\/]node_modules[\\/]/,
          priority: -10,
          reuseExistingChunk: true
        },
        common: {
          minChunks: 2,
          priority: -20,
          reuseExistingChunk: true
        }
      }
    },
    runtimeChunk: 'single',
    moduleIds: 'deterministic'
  },
  plugins: [
    new CompressionPlugin({
      algorithm: 'brotliCompress',
      threshold: 10240
    })
  ]
}
3.2 运行时优化技巧
typescript
// 图片懒加载优化
const lazyImages = document.querySelectorAll('img[data-src]')
const observer = new IntersectionObserver(entries => {
  entries.forEach(entry => {
    if (entry.isIntersecting) {
      const img = entry.target
      img.src = img.dataset.src
      observer.unobserve(img)
    }
  })
})
lazyImages.forEach(img => observer.observe(img))

// 虚拟滚动实现
class VirtualScroller {
  constructor(container, itemHeight, renderItem) {
    this.container = container
    this.itemHeight = itemHeight
    this.renderItem = renderItem
    this.visibleItems = []
    this.virtualize()
  }

  virtualize() {
    this.container.onscroll = () => {
      const scrollTop = this.container.scrollTop
      const startIdx = Math.floor(scrollTop / this.itemHeight)
      const endIdx = startIdx + Math.ceil(this.container.clientHeight / this.itemHeight)

      this.visibleItems = this.data
        .slice(startIdx, endIdx)
        .map((item, i) => ({
          top: (startIdx + i) * this.itemHeight,
          data: item
        }))

      this.render()
    }
  }

  render() {
    // 复用DOM节点
  }
}
四、错误监控与智能诊断
4.1 增强型错误边界
javascript
class ErrorBoundary extends React.Component {
  state = { hasError: false }

  static getDerivedStateFromError() {
    return { hasError: true }
  }

  componentDidCatch(error, info) {
    Sentry.withScope(scope => {
      scope.setContext('redux', store.getState())
      scope.setContext('component_stack', {
        stack: info.componentStack
      })
      scope.setUser({
        id: user.id,
        email: user.email
      })
      Sentry.captureException(error)
    })
  }

  render() {
    return this.props.children
  }
}

// 使用示例
<ErrorBoundary fallback={<ErrorPage />}>
  <App />
</ErrorBoundary>
4.2 网络请求监控
typescript
const originalFetch = window.fetch

window.fetch = async (input, init) => {
  const start = Date.now()
  try {
    const response = await originalFetch(input, init)
    const duration = Date.now() - start

    // 记录成功请求
    monitor.recordApi({
      url: input.url,
      status: response.status,
      duration,
      method: init?.method || 'GET'
    })

    return response
  } catch (error) {
    // 记录失败请求
    monitor.recordApiError({
      url: input.url,
      error: error.message,
      method: init?.method || 'GET'
    })
    throw error
  }
}
五、生产环境调优指南
5.1 Nginx 极致配置
nginx
# 性能优化配置
http {
  # 启用gzip和brotli压缩
  gzip on;
  gzip_types text/plain text/css application/json application/javascript;
  brotli on;
  brotli_types *;

  # 缓存策略
  proxy_cache_path /var/cache/nginx levels=1:2 keys_zone=my_cache:10m inactive=60m;

  # 开启HTTP2
  listen 443 ssl http2;

  # 安全头设置
  add_header Content-Security-Policy "default-src 'self'";
  add_header X-Frame-Options DENY;
}

# 监控日志格式
log_format analytics escape=json
  '{"time":"$time_iso8601",'
  '"host":"$http_host",'
  '"status":"$status",'
  '"request_time":"$request_time",'
  '"upstream_time":"$upstream_response_time",'
  '"bytes":"$body_bytes_sent",'
  '"referer":"$http_referer",'
  '"agent":"$http_user_agent"}';
5.2 CDN 策略优化
typescript
// 动态调整CDN地址
const CDN_HOSTS = [
  'https://cdn1.example.com',
  'https://cdn2.example.com',
  'https://cdn3.example.com'
]

function getOptimalCDN() {
  return new Promise(resolve => {
    const testUrls = CDN_HOSTS.map(host => `${host}/ping?t=${Date.now()}`)
    Promise.race(testUrls.map(url =>
      fetch(url).then(() => url)
    )).then(fastestUrl => {
      const host = new URL(fastestUrl).origin
      resolve(host)
    })
  })
}

// 应用示例
getOptimalCDN().then(host => {
  window.__CDN_HOST__ = host
})
六、自动化质量保障体系
6.1 CI/CD 集成流程
yaml
# .gitlab-ci.yml
stages:
  - test
  - build
  - deploy

performance_test:
  stage: test
  image: k6
  script:
    - k6 run --vus 100 --duration 30s tests/load.js

lighthouse_check:
  stage: test
  image: node
  script:
    - npm install -g lighthouse
    - lighthouse https://staging.example.com --output=html --output-path=./report.html
    - store_artifacts:
        path: ./report.html

deploy_prod:
  stage: deploy
  only:
    - master
  script:
    - npm run build
    - aws s3 sync ./dist s3://prod-bucket
6.2 性能回归测试
typescript
// tests/performance.test.js
const lighthouse = require('lighthouse')
const puppeteer = require('puppeteer')

describe('性能回归测试', () => {
  let browser

  beforeAll(async () => {
    browser = await puppeteer.launch()
  })

  afterAll(async () => {
    await browser.close()
  })

  test('LCP应小于2.5秒', async () => {
    const page = await browser.newPage()
    const report = await lighthouse(page.url(), {
      port: new URL(browser.wsEndpoint()).port,
      output: 'json'
    })

    expect(report.lhr.audits['largest-contentful-paint'].numericValue).toBeLessThan(2500)
  }, 30000)
})
七、可视化与智能分析
7.1 Grafana 监控面板配置
sql
-- 核心性能趋势查询
SELECT
  time_bucket('5m', created_at) AS time,
  avg(lcp) as avg_lcp,
  percentile_cont(0.95) WITHIN GROUP (ORDER BY lcp) as p95_lcp
FROM performance_metrics
WHERE created_at > NOW() - INTERVAL '24 HOURS'
GROUP BY time
ORDER BY time

-- 错误类型分布
SELECT
  error_type,
  COUNT(*) as count
FROM frontend_errors
WHERE environment = 'production'
GROUP BY error_type
ORDER BY count DESC
LIMIT 10
7.2 智能报警规则
yaml
alert_rules:
  - alert: HighErrorRate
    expr: |
      sum(rate(frontend_errors_total[5m])) by (environment)
      /
      sum(rate(page_views_total[5m])) by (environment)
      > 0.01
    for: 10m
    labels:
      severity: critical
    annotations:
      summary: "前端错误率超过1% (环境: {{ $labels.environment }})"

  - alert: SlowAPI
    expr: |
      histogram_quantile(0.95, sum by (le)(rate(api_duration_seconds_bucket[5m])))
      > 3
    for: 5m
    labels:
      severity: warning
    annotations:
      description: "95%的API响应时间超过3秒"
八、移动端专项优化
8.1 移动端性能增强
typescript
// 触摸事件优化
const touchHandler = {
  passive: true,
  capture: false
}

window.addEventListener('touchstart', this.handleTouch, touchHandler)
window.addEventListener('touchmove', this.handleMove, touchHandler)

// 内存敏感操作处理
function manageMemory() {
  if ('deviceMemory' in navigator && navigator.deviceMemory < 2) {
    // 低端设备启用轻量模式
    disableAnimations()
    reduceImageQuality()
    limitBackgroundProcesses()
  }
}

// 首屏关键资源预加载
const criticalResources = [
  '/css/main.css',
  '/js/runtime.js',
  '/fonts/iconfont.woff2'
]

criticalResources.forEach(res => {
  const link = document.createElement('link')
  link.rel = 'preload'
  link.as = res.endsWith('.css') ? 'style' : 'script'
  link.href = res
  document.head.appendChild(link)
})
8.2 移动端监控差异点
typescript
// 移动端特有指标采集
const collectMobileMetrics = () => {
  const metrics = {}

  // 设备信息
  metrics.device = {
    memory: navigator.deviceMemory,
    cores: navigator.hardwareConcurrency,
    connection: navigator.connection?.effectiveType
  }

  // 电池状态
  navigator.getBattery().then(battery => {
    metrics.battery = {
      level: battery.level,
      charging: battery.charging
    }
  })

  return metrics
}

// 网络状态监听
const connection = navigator.connection
connection.addEventListener('change', () => {
  monitor.logNetworkChange({
    type: connection.effectiveType,
    downlink: connection.downlink,
    rtt: connection.rtt
  })
})
全链路监控系统部署流程
- 基础设施准备:Kubernetes 集群 + Prometheus + Grafana
- 数据采集 SDK 集成:性能指标 + 错误日志 + 用户行为
- 数据处理流水线搭建:Flink 实时处理 + Elasticsearch 存储
- 可视化看板配置:核心指标趋势 + 地理分布 + 设备分析
- 报警系统集成:Slack / 钉钉通知 + PagerDuty 升级策略
到这里,这篇文章就和大家说再见啦!我的主页里还藏着很多 篇 前端 实战干货,感兴趣的话可以点击头像看看,说不定能找到你需要的解决方案~
创作这篇内容花了很多的功夫。如果它帮你解决了问题,或者带来了启发,欢迎:
点个赞❤️ 让更多人看到优质内容
关注「前端极客探险家」🚀 每周解锁新技巧
收藏文章⭐️ 方便随时查阅
📢 特别提醒:
转载请注明原文链接,商业合作请私信联系
感谢你的阅读!我们下篇文章再见~ 💕