目录
[1. 归一化range:0,1](#1. 归一化range:[0,1])
开始工作
第一步:创建画布空间
<div ref={containerRef} style={{ width: '100%' }} />第二步:获取画布空间并挂载AntVG2
  const chartRef = useRef<Chart | null>(null)
  const containerRef = useRef<HTMLDivElement>(null)

  useEffect(() => {
    if (!containerRef.current) return
    // 创建 G2 图表实例,并存储到 ref 中
    chartRef.current = new Chart({
      container: containerRef.current,
      autoFit: true,
      height: 400,
    })

    // 组件卸载时销毁 chart 实例
    return () => {
      chartRef.current?.destroy()
      chartRef.current = null
    }
  }, [])
第三步:进行画布设计配置与数据挂载
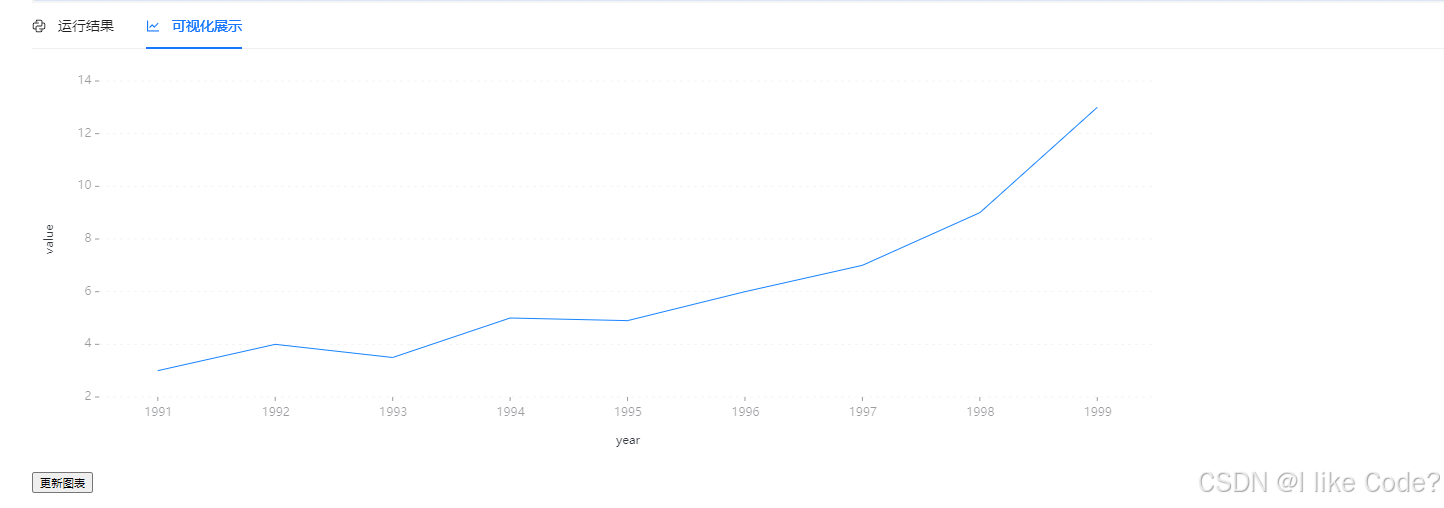
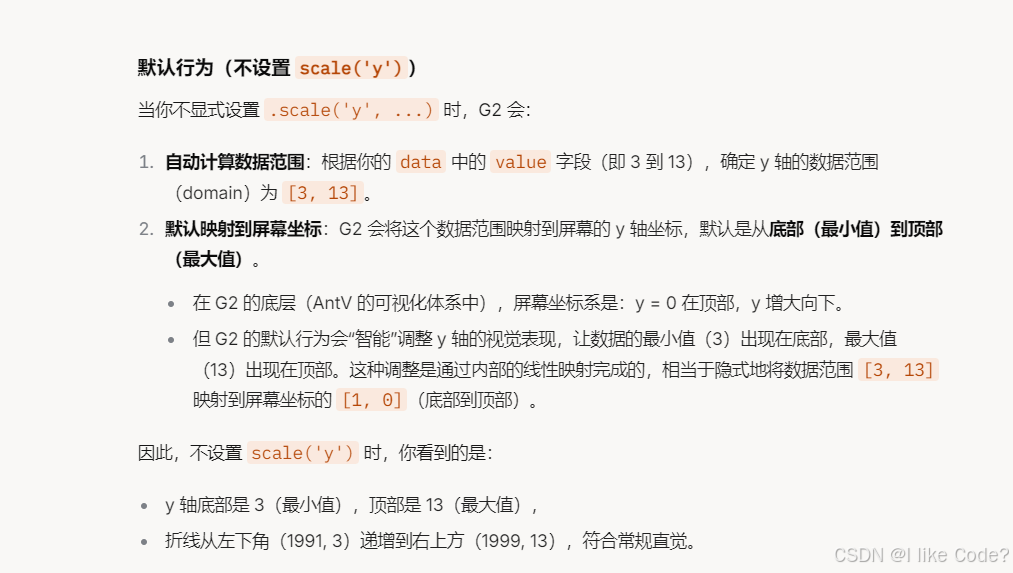
const data = [
  { year: '1991', value: 3 },
  { year: '1992', value: 4 },
  { year: '1993', value: 3.5 },
  { year: '1994', value: 5 },
  { year: '1995', value: 4.9 },
  { year: '1996', value: 6 },
  { year: '1997', value: 7 },
  { year: '1998', value: 9 },
  { year: '1999', value: 13 },
]


    chartRef.current
      .line()
      .data(data)
      .encode('x', 'year')
      .encode('y', 'value')
      .scale('x', { range: [0, 1], nice: true })
      .scale('y', { nice: true })
    chartRef.current.render()
第四步:完整代码
import { Chart } from '@antv/g2'
import React, { useEffect, useRef } from 'react'

const data = [
  { year: '1991', value: 3 },
  { year: '1992', value: 4 },
  { year: '1993', value: 3.5 },
  { year: '1994', value: 5 },
  { year: '1995', value: 4.9 },
  { year: '1996', value: 6 },
  { year: '1997', value: 7 },
  { year: '1998', value: 9 },
  { year: '1999', value: 13 },
]

const ChartShow: React.FC = () => {
  // 定义 ref 用来存储 chart 实例和 DOM 容器
  const chartRef = useRef<Chart | null>(null)
  const containerRef = useRef<HTMLDivElement>(null)

  useEffect(() => {
    if (!containerRef.current) return
    // 创建 G2 图表实例,并存储到 ref 中
    chartRef.current = new Chart({
      container: containerRef.current,
      autoFit: true,
      height: 400,
    })
    chartRef.current
      .line()
      .data(data)
      .encode('x', 'year')
      .encode('y', 'value')
      .scale('x', { range: [0, 1], nice: true })
      .scale('y', { nice: true })
    chartRef.current.render()
    // 组件卸载时销毁 chart 实例
    return () => {
      chartRef.current?.destroy()
      chartRef.current = null
    }
  }, [])
  const updateChart = () => {
    if (chartRef.current) {
      chartRef.current.render()
    }
  }

  return (
    <div>
      <div ref={containerRef} style={{ width: '50%' }} />
      <button onClick={updateChart}>更新图表</button>
    </div>
  )
}

export default ChartShow
实际效果如下
参数理解
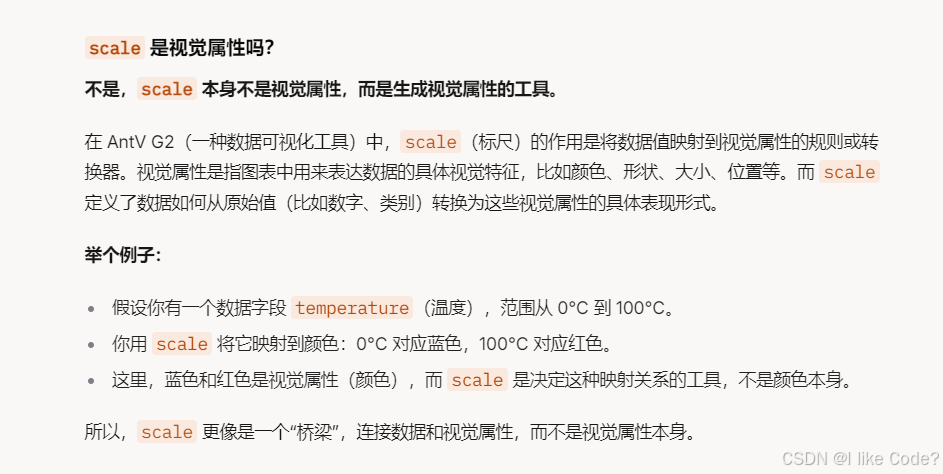
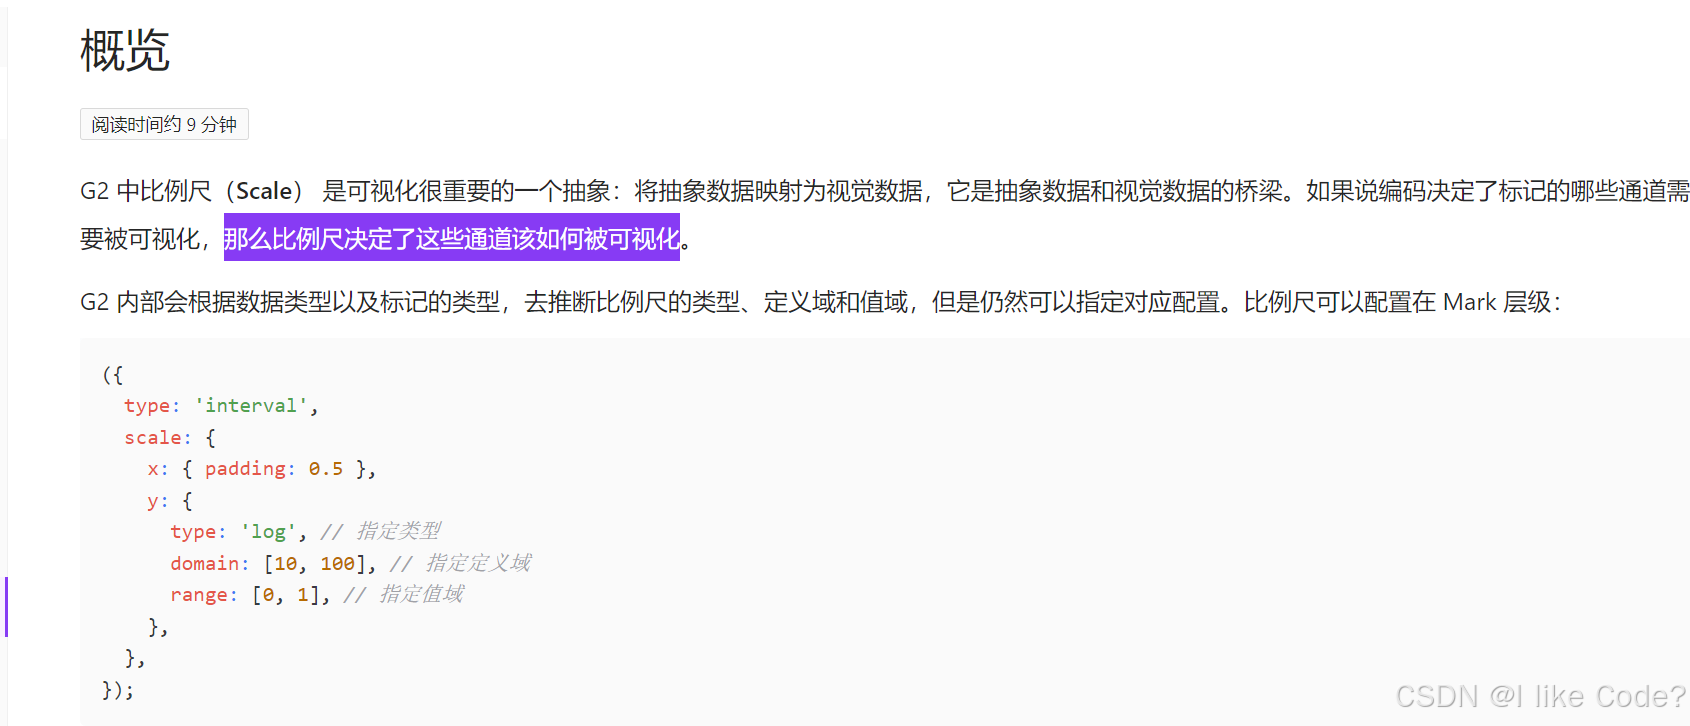
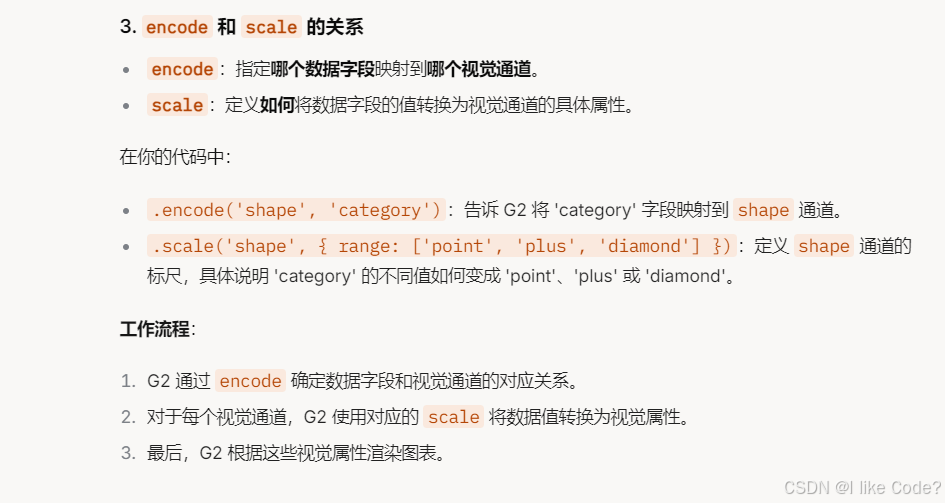
一、scale
1. 归一化range:0,1

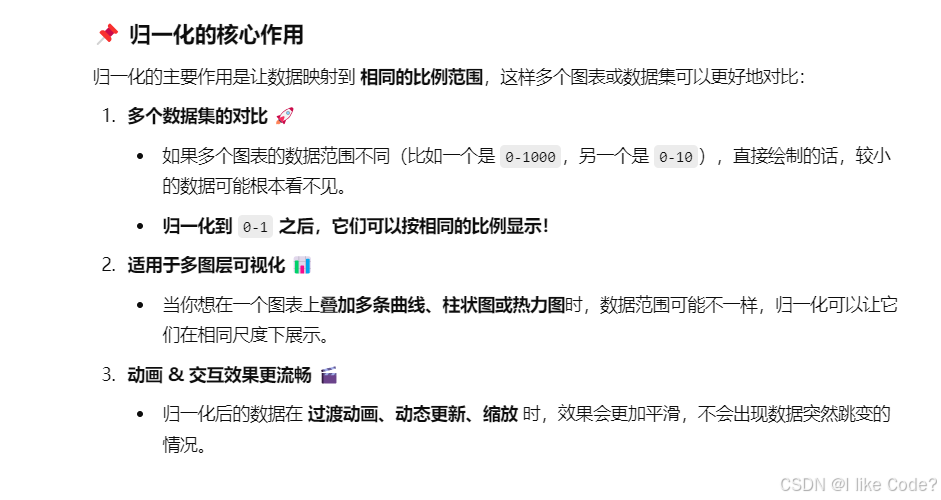
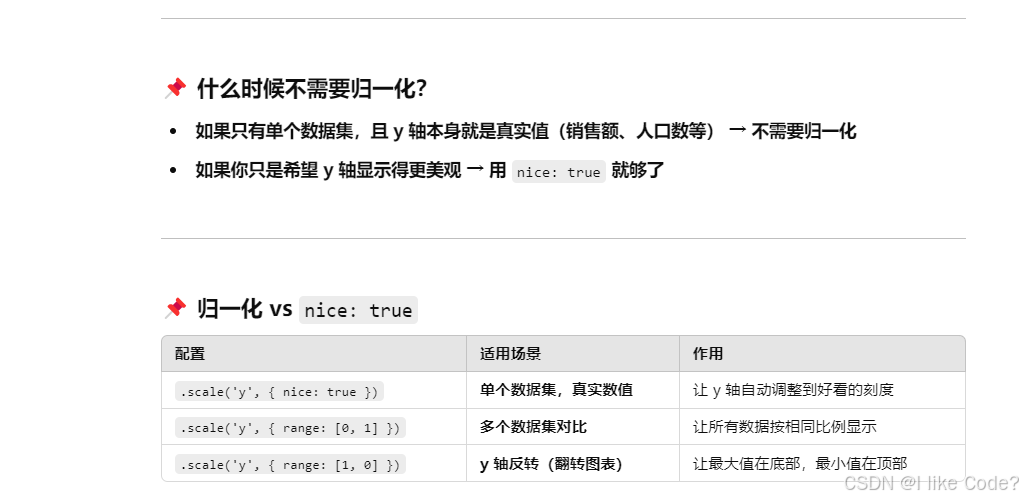
y轴设置归一化倒转问题

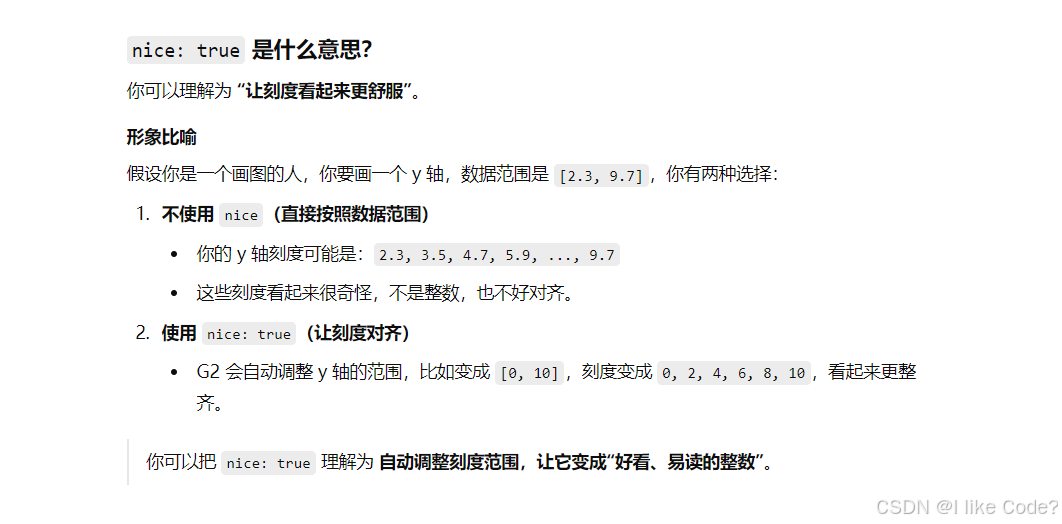
2.nice、domainMin
domainMin强制让Y从0开始渲染
nice让刻度变得更整齐
.scale('y', {
domainMin: 0,
nice: true,
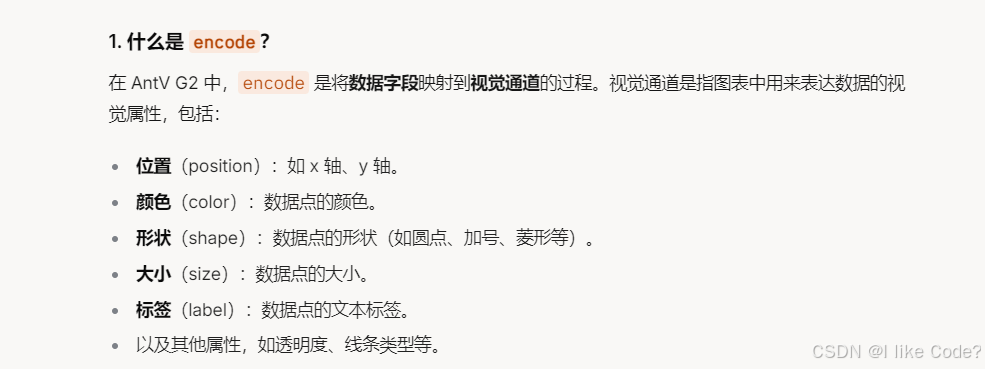
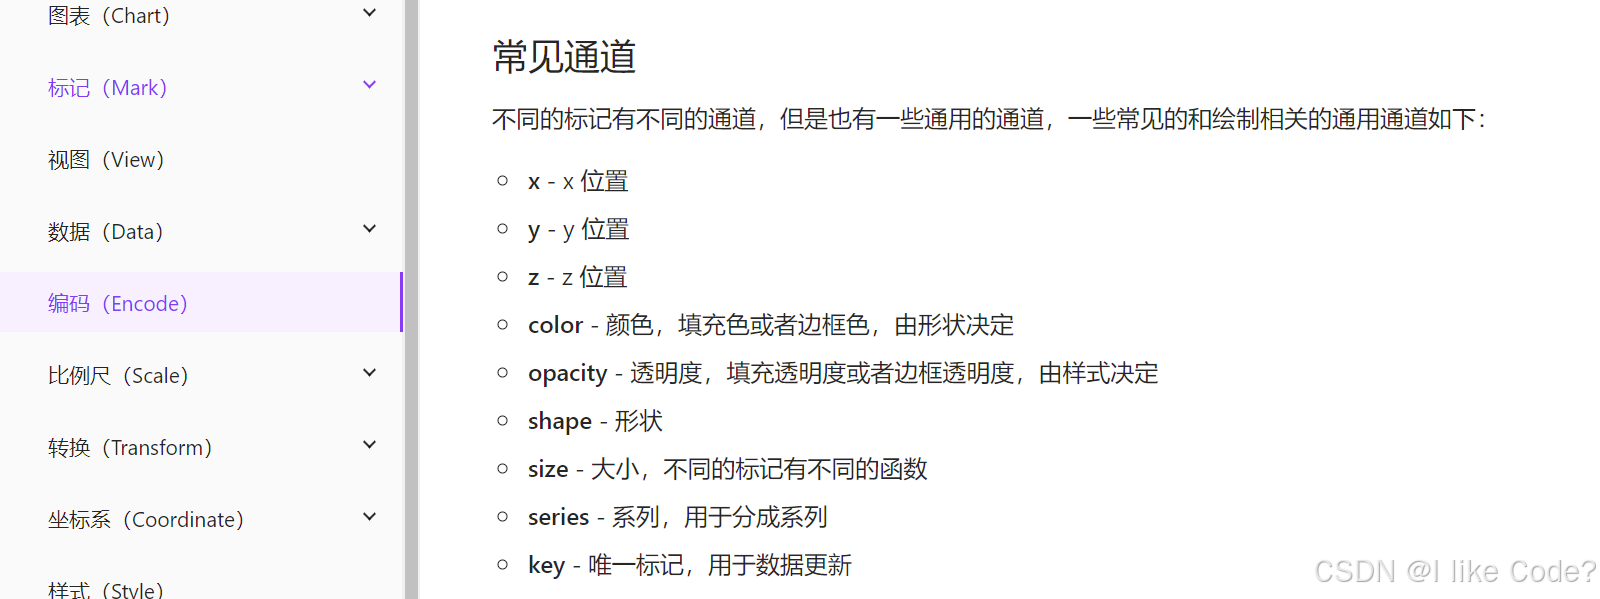
});二、encode
.encode('x', 'x')
.encode('y', 'y')
.encode('shape', 'category')
.encode('color', 'category')
.encode('size', 5)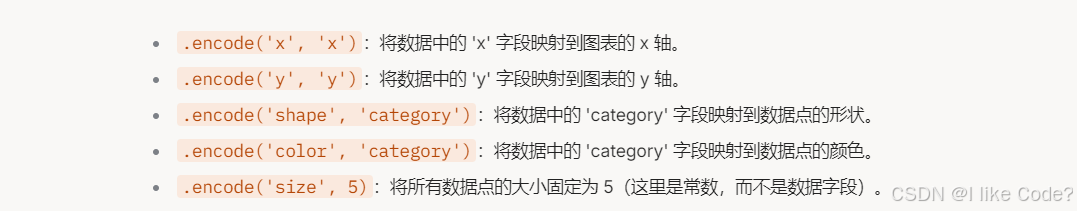

概念理解
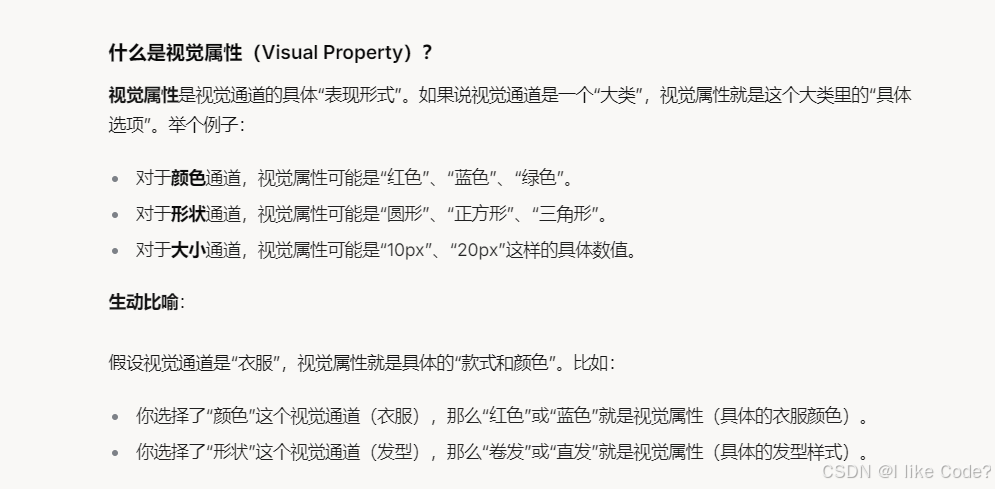
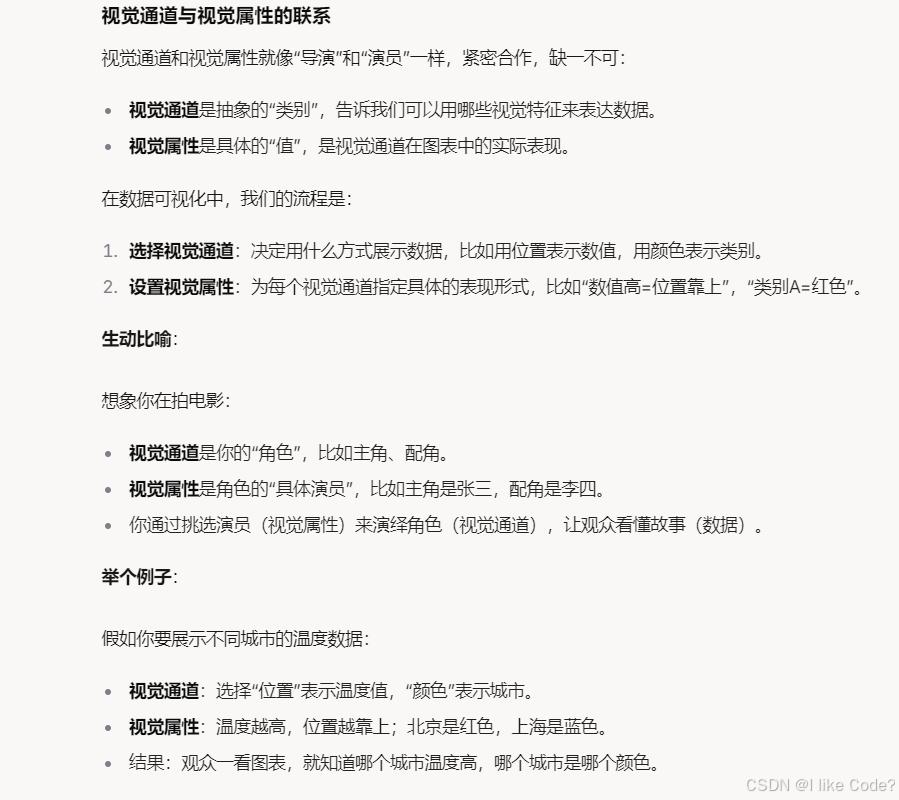
一、视觉通道
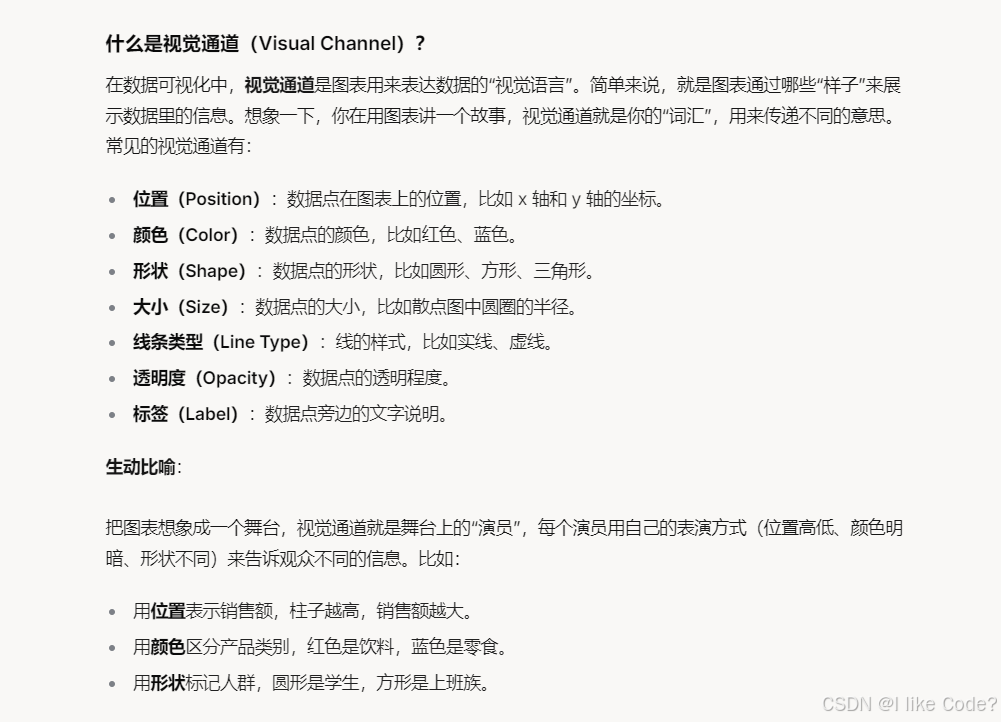
二、视觉属性