代码解释
- 分子结构定义 :
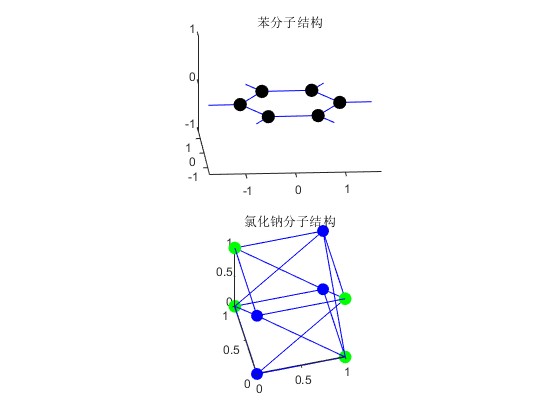
- 苯分子:定义了苯分子中 12 个原子(6 个碳原子和 6 个氢原子)的坐标和原子类型,同时也定义了原子之间的键连接关系。
- 氯化钠分子:定义了一个简单立方晶格的氯化钠结构,包含 8 个原子(4 个钠原子和 4 个氯原子)的坐标和原子类型,以及它们之间的键连接关系。
- 颜色和大小定义:为不同类型的原子定义了不同的颜色和大小,以便在绘制时进行区分。
- 子图布局 :使用
subplot函数创建一个 2x1 的子图布局,分别绘制苯分子和氯化钠分子的 3D 结构。 - 绘制分子结构 :
- 对于每个分子,首先使用
plot3函数绘制原子之间的键。 - 然后使用
scatter3函数根据原子类型绘制不同颜色和大小的球体表示原子。 - 最后使用
title函数为每个子图添加标题,并使用axis equal函数保证坐标轴比例一致,使图形符合 3D 规律。
- 对于每个分子,首先使用
你可以将上述代码复制到 MATLAB 编辑器中运行,就能看到苯分子和氯化钠分子的 3D 结构,不同原子用不同颜色的球体表示。如果需要绘制其他分子,只需按照相同的方式定义原子坐标、原子类型和键连接关系即可。
Matlab
% 苯分子结构
% 原子坐标和类型(1: C, 2: H)
benzene_atoms = [
    1   1.0000    0.0000    0.0000; % C1
    1   0.5000    0.8660    0.0000; % C2
    1  -0.5000    0.8660    0.0000; % C3
    1  -1.0000    0.0000    0.0000; % C4
    1  -0.5000   -0.8660    0.0000; % C5
    1   0.5000   -0.8660    0.0000; % C6
    2   1.7320    0.0000    0.0000; % H1
    2   0.8660    1.5000    0.0000; % H2
    2  -0.8660    1.5000    0.0000; % H3
    2  -1.7320    0.0000    0.0000; % H4
    2  -0.8660   -1.5000    0.0000; % H5
    2   0.8660   -1.5000    0.0000  % H6
];
benzene_bonds = [
    1 2;
    2 3;
    3 4;
    4 5;
    5 6;
    6 1;
    1 7;
    2 8;
    3 9;
    4 10;
    5 11;
    6 12
];

% 氯化钠分子结构(简单立方晶格示例)
% 原子坐标和类型(1: Na, 2: Cl)
nacl_atoms = [
    1   0.0000    0.0000    0.0000; % Na1
    2   1.0000    0.0000    0.0000; % Cl1
    1   1.0000    1.0000    0.0000; % Na2
    2   0.0000    1.0000    0.0000; % Cl2
    1   0.0000    0.0000    1.0000; % Na3
    2   1.0000    0.0000    1.0000; % Cl3
    1   1.0000    1.0000    1.0000; % Na4
    2   0.0000    1.0000    1.0000  % Cl4
];
nacl_bonds = [
    1 2;
    1 4;
    1 6;
    2 3;
    2 5;
    2 7;
    3 4;
    3 6;
    3 8;
    4 5;
    4 7;
    5 6;
    5 8;
    6 7;
    7 8
];

% 定义颜色和大小
carbon_color = [0 0 0]; % 黑色表示碳原子
hydrogen_color = [1 1 1]; % 白色表示氢原子
sodium_color = [0 0 1]; % 蓝色表示钠原子
chlorine_color = [0 1 0]; % 绿色表示氯原子
carbon_size = 100;
hydrogen_size = 50;
sodium_size = 80;
chlorine_size = 90;

% 创建一个2x1的子图布局
figure;

% 绘制苯分子结构
subplot(2,1,1);
for i = 1:size(benzene_bonds, 1)
    atom1 = benzene_atoms(benzene_bonds(i, 1), 2:4);
    atom2 = benzene_atoms(benzene_bonds(i, 2), 2:4);
    plot3([atom1(1) atom2(1)], [atom1(2) atom2(2)], [atom1(3) atom2(3)], 'b-');
    hold on;
end
carbon_indices = benzene_atoms(:,1) == 1;
hydrogen_indices = benzene_atoms(:,1) == 2;
scatter3(benzene_atoms(carbon_indices, 2), benzene_atoms(carbon_indices, 3), benzene_atoms(carbon_indices, 4), carbon_size, carbon_color, 'filled');
scatter3(benzene_atoms(hydrogen_indices, 2), benzene_atoms(hydrogen_indices, 3), benzene_atoms(hydrogen_indices, 4), hydrogen_size, hydrogen_color, 'filled');
title('苯分子结构');
axis equal;
hold off;

% 绘制氯化钠分子结构
subplot(2,1,2);
for i = 1:size(nacl_bonds, 1)
    atom1 = nacl_atoms(nacl_bonds(i, 1), 2:4);
    atom2 = nacl_atoms(nacl_bonds(i, 2), 2:4);
    plot3([atom1(1) atom2(1)], [atom1(2) atom2(2)], [atom1(3) atom2(3)], 'b-');
    hold on;
end
sodium_indices = nacl_atoms(:,1) == 1;
chlorine_indices = nacl_atoms(:,1) == 2;
scatter3(nacl_atoms(sodium_indices, 2), nacl_atoms(sodium_indices, 3), nacl_atoms(sodium_indices, 4), sodium_size, sodium_color, 'filled');
scatter3(nacl_atoms(chlorine_indices, 2), nacl_atoms(chlorine_indices, 3), nacl_atoms(chlorine_indices, 4), chlorine_size, chlorine_color, 'filled');
title('氯化钠分子结构');
axis equal;
hold off;
代码解释
- 分子结构定义
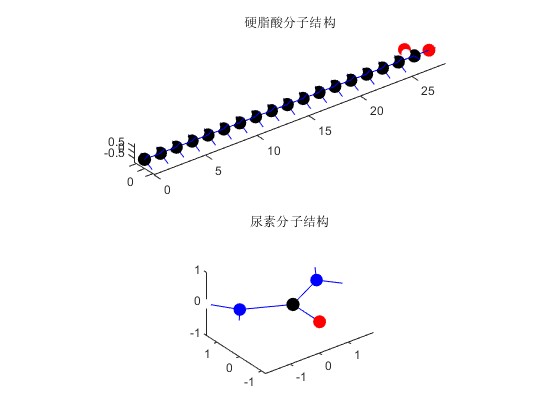
- 硬脂酸:硬脂酸是一种长链脂肪酸,有 18 个碳原子的碳链以及一个羧基。代码里定义了硬脂酸所有原子的坐标与类型,还有原子间的键连接关系。
- 尿素:尿素分子包含一个碳原子、两个氮原子、一个氧原子和四个氢原子。同样定义了其原子坐标、类型以及键连接关系。
- 颜色和大小定义
- 为不同类型的原子(碳、氢、氮、氧)定义了不同的颜色和大小,方便在绘图时区分。
- 子图布局
- 运用
subplot函数创建一个 2x1 的子图布局,分别绘制硬脂酸和尿素的 3D 分子结构。
- 运用
- 绘制分子结构
- 针对每个分子,先利用
plot3函数绘制原子之间的键。 - 接着使用
scatter3函数依据原子类型绘制不同颜色和大小的球体来表示原子。 - 最后使用
title函数为每个子图添加标题,并通过axis equal函数保证坐标轴比例一致,让图形符合 3D 规律。
- 针对每个分子,先利用
你可以把上述代码复制到 MATLAB 编辑器中运行,这样就能看到硬脂酸和尿素的 3D 分子结构,不同原子会用不同颜色的球体表示。
Matlab
% 硬脂酸分子结构
% 原子坐标和类型(1: C, 2: H, 3: O)
stearic_acid_atoms = [
    % 碳原子链
    1   0.0000    0.0000    0.0000; % C1
    1   1.5400    0.0000    0.0000; % C2
    1   3.0800    0.0000    0.0000; % C3
    1   4.6200    0.0000    0.0000; % C4
    1   6.1600    0.0000    0.0000; % C5
    1   7.7000    0.0000    0.0000; % C6
    1   9.2400    0.0000    0.0000; % C7
    1  10.7800    0.0000    0.0000; % C8
    1  12.3200    0.0000    0.0000; % C9
    1  13.8600    0.0000    0.0000; % C10
    1  15.4000    0.0000    0.0000; % C11
    1  16.9400    0.0000    0.0000; % C12
    1  18.4800    0.0000    0.0000; % C13
    1  20.0200    0.0000    0.0000; % C14
    1  21.5600    0.0000    0.0000; % C15
    1  23.1000    0.0000    0.0000; % C16
    1  24.6400    0.0000    0.0000; % C17
    1  26.1800    0.0000    0.0000; % C18
    % 羧基部分
    3  26.1800    1.2300    0.0000; % O1
    3  27.6200    0.0000    0.0000; % O2
    % 氢原子
    2   0.3800    0.9600    0.0000; % H1
    2   0.3800   -0.4800    0.8300; % H2
    2   0.3800   -0.4800   -0.8300; % H3
    2   1.9200    0.9600    0.0000; % H4
    2   1.9200   -0.4800    0.8300; % H5
    2   1.9200   -0.4800   -0.8300; % H6
    2   3.4600    0.9600    0.0000; % H7
    2   3.4600   -0.4800    0.8300; % H8
    2   3.4600   -0.4800   -0.8300; % H9
    2   5.0000    0.9600    0.0000; % H10
    2   5.0000   -0.4800    0.8300; % H11
    2   5.0000   -0.4800   -0.8300; % H12
    2   6.5400    0.9600    0.0000; % H13
    2   6.5400   -0.4800    0.8300; % H14
    2   6.5400   -0.4800   -0.8300; % H15
    2   8.0800    0.9600    0.0000; % H16
    2   8.0800   -0.4800    0.8300; % H17
    2   8.0800   -0.4800   -0.8300; % H18
    2   9.6200    0.9600    0.0000; % H19
    2   9.6200   -0.4800    0.8300; % H20
    2   9.6200   -0.4800   -0.8300; % H21
    2  11.1600    0.9600    0.0000; % H22
    2  11.1600   -0.4800    0.8300; % H23
    2  11.1600   -0.4800   -0.8300; % H24
    2  12.7000    0.9600    0.0000; % H25
    2  12.7000   -0.4800    0.8300; % H26
    2  12.7000   -0.4800   -0.8300; % H27
    2  14.2400    0.9600    0.0000; % H28
    2  14.2400   -0.4800    0.8300; % H29
    2  14.2400   -0.4800   -0.8300; % H30
    2  15.7800    0.9600    0.0000; % H31
    2  15.7800   -0.4800    0.8300; % H32
    2  15.7800   -0.4800   -0.8300; % H33
    2  17.3200    0.9600    0.0000; % H34
    2  17.3200   -0.4800    0.8300; % H35
    2  17.3200   -0.4800   -0.8300; % H36
    2  18.8600    0.9600    0.0000; % H37
    2  18.8600   -0.4800    0.8300; % H38
    2  18.8600   -0.4800   -0.8300; % H39
    2  20.4000    0.9600    0.0000; % H40
    2  20.4000   -0.4800    0.8300; % H41
    2  20.4000   -0.4800   -0.8300; % H42
    2  21.9400    0.9600    0.0000; % H43
    2  21.9400   -0.4800    0.8300; % H44
    2  21.9400   -0.4800   -0.8300; % H45
    2  23.4800    0.9600    0.0000; % H46
    2  23.4800   -0.4800    0.8300; % H47
    2  23.4800   -0.4800   -0.8300; % H48
    2  25.0200    0.9600    0.0000; % H49
    2  25.0200   -0.4800    0.8300; % H50
    2  25.0200   -0.4800   -0.8300; % H51
    2  26.1800   -1.2300    0.0000; % H52
    2  28.2600    0.0000    0.0000  % H53
];
stearic_acid_bonds = [
    % 碳原子链
    1 2;
    2 3;
    3 4;
    4 5;
    5 6;
    6 7;
    7 8;
    8 9;
    9 10;
    10 11;
    11 12;
    12 13;
    13 14;
    14 15;
    15 16;
    16 17;
    17 18;
    % 羧基部分
    18 19;
    18 20;
    % 氢原子连接
    1 21;
    1 22;
    1 23;
    2 24;
    2 25;
    2 26;
    3 27;
    3 28;
    3 29;
    4 30;
    4 31;
    4 32;
    5 33;
    5 34;
    5 35;
    6 36;
    6 37;
    6 38;
    7 39;
    7 40;
    7 41;
    8 42;
    8 43;
    8 44;
    9 45;
    9 46;
    9 47;
    10 48;
    10 49;
    10 50;
    11 51;
    11 52;
    11 53;
    12 54;
    12 55;
    12 56;
    13 57;
    13 58;
    13 59;
    14 60;
    14 61;
    14 62;
    15 63;
    15 64;
    15 65;
    16 66;
    16 67;
    16 68;
    17 69;
    17 70;
    17 71;
    18 72;
    18 73
];

% 尿素分子结构
% 原子坐标和类型(1: C, 2: H, 3: N, 4: O)
urea_atoms = [
    1   0.0000    0.0000    0.0000; % C
    3   1.3300    0.6700    0.0000; % N1
    3  -1.3300    0.6700    0.0000; % N2
    4   0.0000   -1.2000    0.0000; % O
    2   1.8700    1.4700    0.0000; % H1
    2   1.8700    0.0000    0.0000; % H2
    2  -1.8700    1.4700    0.0000; % H3
    2  -1.8700    0.0000    0.0000  % H4
];
urea_bonds = [
    1 2;
    1 3;
    1 4;
    2 5;
    2 6;
    3 7;
    3 8
];

% 定义颜色和大小
carbon_color = [0 0 0]; % 黑色表示碳原子
hydrogen_color = [1 1 1]; % 白色表示氢原子
nitrogen_color = [0 0 1]; % 蓝色表示氮原子
oxygen_color = [1 0 0]; % 红色表示氧原子
carbon_size = 100;
hydrogen_size = 50;
nitrogen_size = 90;
oxygen_size = 95;

% 创建一个2x1的子图布局
figure;

% 绘制硬脂酸分子结构
subplot(2,1,1);
for i = 1:size(stearic_acid_bonds, 1)
    % 检查索引是否超出范围
    if stearic_acid_bonds(i, 1) > size(stearic_acid_atoms, 1) || stearic_acid_bonds(i, 2) > size(stearic_acid_atoms, 1)
        fprintf('索引超出范围: 键 %d 连接的原子索引为 (%d, %d)\n', i, stearic_acid_bonds(i, 1), stearic_acid_bonds(i, 2));
        continue;
    end
    atom1 = stearic_acid_atoms(stearic_acid_bonds(i, 1), 2:4);
    atom2 = stearic_acid_atoms(stearic_acid_bonds(i, 2), 2:4);
    plot3([atom1(1) atom2(1)], [atom1(2) atom2(2)], [atom1(3) atom2(3)], 'b-');
    hold on;
end
carbon_indices = stearic_acid_atoms(:,1) == 1;
hydrogen_indices = stearic_acid_atoms(:,1) == 2;
oxygen_indices = stearic_acid_atoms(:,1) == 3;
scatter3(stearic_acid_atoms(carbon_indices, 2), stearic_acid_atoms(carbon_indices, 3), stearic_acid_atoms(carbon_indices, 4), carbon_size, carbon_color, 'filled');
scatter3(stearic_acid_atoms(hydrogen_indices, 2), stearic_acid_atoms(hydrogen_indices, 3), stearic_acid_atoms(hydrogen_indices, 4), hydrogen_size, hydrogen_color, 'filled');
scatter3(stearic_acid_atoms(oxygen_indices, 2), stearic_acid_atoms(oxygen_indices, 3), stearic_acid_atoms(oxygen_indices, 4), oxygen_size, oxygen_color, 'filled');
title('硬脂酸分子结构');
axis equal;
hold off;

% 绘制尿素分子结构
subplot(2,1,2);
for i = 1:size(urea_bonds, 1)
    atom1 = urea_atoms(urea_bonds(i, 1), 2:4);
    atom2 = urea_atoms(urea_bonds(i, 2), 2:4);
    plot3([atom1(1) atom2(1)], [atom1(2) atom2(2)], [atom1(3) atom2(3)], 'b-');
    hold on;
end
carbon_indices = urea_atoms(:,1) == 1;
hydrogen_indices = urea_atoms(:,1) == 2;
nitrogen_indices = urea_atoms(:,1) == 3;
oxygen_indices = urea_atoms(:,1) == 4;
scatter3(urea_atoms(carbon_indices, 2), urea_atoms(carbon_indices, 3), urea_atoms(carbon_indices, 4), carbon_size, carbon_color, 'filled');
scatter3(urea_atoms(hydrogen_indices, 2), urea_atoms(hydrogen_indices, 3), urea_atoms(hydrogen_indices, 4), hydrogen_size, hydrogen_color, 'filled');
scatter3(urea_atoms(nitrogen_indices, 2), urea_atoms(nitrogen_indices, 3), urea_atoms(nitrogen_indices, 4), nitrogen_size, nitrogen_color, 'filled');
scatter3(urea_atoms(oxygen_indices, 2), urea_atoms(oxygen_indices, 3), urea_atoms(oxygen_indices, 4), oxygen_size, oxygen_color, 'filled');
title('尿素分子结构');
axis equal;
hold off;