文章目录
-
- [1 批量替换代替追加](#1 批量替换代替追加)
-
- [1.1 测试1](#1.1 测试1)
- [1.2 测试2](#1.2 测试2)
- [1.3 测试3](#1.3 测试3)
- [2 开启OpenGL](#2 开启OpenGL)
-
- [2.1 测试1](#2.1 测试1)
- [2.2 测试2](#2.2 测试2)
- [2.3 测试3](#2.3 测试3)
- [2.4 测试4](#2.4 测试4)
| 更多精彩内容 |
|---|
| 👉内容导航 👈 |
| 👉Qt开发 👈 |
| 👉QtCharts绘图 👈 |
| 👉python开发 👈 |
1 批量替换代替追加
| 环境 | 说明 |
|---|---|
| 系统 | windows10 |
| python | 3.13 |
| pyside6 | 6.8.3 |
| 性能分析工具 | line_profiler_pycharm |
-
如下所示,使用
replace添加数据和使用append添加数据性能对比,单次添加数据越多,replace性能比append越强。 -
示例代码
pythonimport random # 导入random模块,用于生成随机数 import sys from PySide6.QtCharts import QChart, QChartView, QLineSeries, QValueAxis # 导入QtCharts模块,用于创建图表和轴 from PySide6.QtCore import QTimer # 导入QTimer,用于定时更新图表 from PySide6.QtCore import Qt # 导入Qt核心模块,用于设置对齐方式等 from PySide6.QtGui import QPainter # 导入QPainter,用于设置图表的渲染提示 from PySide6.QtWidgets import QApplication, QMainWindow # 导入PySide6的QApplication和QMainWindow类 from line_profiler_pycharm import profile from PySide6.QtCore import QPointF class MainWindow(QMainWindow): # 定义MainWindow类,继承自QMainWindow def __init__(self): super().__init__() # 调用父类的构造函数 self.setWindowTitle("PySide6 折线图示例") # 设置窗口标题 self.setGeometry(100, 100, 800, 600) # 设置窗口的位置和大小 self.timer = QTimer() # 创建一个定时器 self.timer.timeout.connect(self.update_chart) # 连接定时器超时信号到update_chart方法 self.timer.start(10) # 设置定时器间隔为10毫秒,并启动定时器 # print(help(QChart)) # 这行代码可以用于打印QChart类的帮助信息,目前被注释掉了 self.chart_view = None # 初始化图表视图为None self.series1 = QLineSeries() # 创建一个折线序列对象 self.series2 = QLineSeries() # 创建一个折线序列对象 # self.series1.setUseOpenGL(True) # 设置折线序列使用OpenGL渲染 # self.series2.setUseOpenGL(True) # 设置折线序列使用OpenGL渲染 self.init_chart() # 调用初始化图表的方法 def init_chart(self): # 定义初始化图表的方法 # 设置名称 self.series1.setName("series1") # 设置折线的名称 self.series2.setName("series2") # 设置折线的名称 # 创建图表 chart = QChart() # 创建一个图表对象 chart.addSeries(self.series1) # 将折线序列添加到图表中 chart.addSeries(self.series2) # 将折线序列添加到图表中 chart.setTitle("简单的折线图") # 设置图表的标题 # chart.setAnimationOptions(QChart.AnimationOption.SeriesAnimations) # 设置图表不使用动画 # 创建x轴和y轴 axis_x = QValueAxis() # 创建一个数值型x轴 axis_y = QValueAxis() # 创建一个数值型y轴 chart.addAxis(axis_x, Qt.AlignmentFlag.AlignBottom) # 将x轴添加到图表底部 chart.addAxis(axis_y, Qt.AlignmentFlag.AlignLeft) # 将y轴添加到图表左侧 self.series1.attachAxis(axis_x) # 将折线序列附着到x轴 self.series1.attachAxis(axis_y) # 将折线序列附着到y轴 self.series2.attachAxis(axis_x) # 将折线序列附着到x轴 self.series2.attachAxis(axis_y) # 将折线序列附着到y轴 # 创建图表视图 self.chart_view = QChartView(chart) # 创建一个图表视图对象,并将图表添加进去 self.chart_view.setRenderHint(QPainter.RenderHint.Antialiasing) # 设置图表视图的渲染提示为抗锯齿 # 设置主窗口的中心部件 self.setCentralWidget(self.chart_view) # 设置主窗口的中心部件为图表视图 @profile def update_chart1(self): # 定义更新图表的方法 """ 使用append方法更新折线序列 :return: """ for i in range(10): # 循环10次 random_integer = random.randint(1, 100) # 生成一个1到100之间的随机整数 self.series1.append(self.series1.count(), random_integer) # 将新的点添加到折线序列中 chart = self.chart_view.chart() # 获取图表视图中的图表对象 axis_x = chart.axes(Qt.Orientation.Horizontal)[0] # 获取图表中的x轴对象 axis_y = chart.axes(Qt.Orientation.Vertical)[0] # 获取图表中的y轴对象 axis_x.setRange(0, self.series1.count()) # 设置x轴的范围,使其从0到当前折线序列点的数量 axis_y.setRange(0, 100) # 设置y轴的范围,使其从0到100 @profile def update_chart2(self): """ 使用replace方法更新折线序列 :return: """ data = self.series2.points() for i in range(10): # 循环10次 random_integer = random.randint(1, 100) # 生成一个1到100之间的随机整数 data.append(QPointF(len(data), random_integer)) # 将新的点添加到折线序列中 self.series2.replace(data) # 替换折线序列中的点 chart = self.chart_view.chart() # 获取图表视图中的图表对象 axis_x = chart.axes(Qt.Orientation.Horizontal)[0] # 获取图表中的x轴对象 axis_y = chart.axes(Qt.Orientation.Vertical)[0] # 获取图表中的y轴对象 axis_x.setRange(0, self.series2.count()) # 设置x轴的范围,使其从0到当前折线序列点的数量 axis_y.setRange(0, 100) # 设置y轴的范围,使其从0到100 @profile def update_chart(self): # 定义更新图表的方法 self.update_chart1() # 调用更新图表的方法 self.update_chart2() # 调用更新图表的方法 if __name__ == "__main__": # 确保只有在直接运行此脚本时才会执行下面的代码 app = QApplication(sys.argv) # 创建一个QApplication对象 window = MainWindow() # 创建一个MainWindow对象 window.show() # 显示主窗口 sys.exit(app.exec()) # 进入应用程序的主循环,并等待退出
1.1 测试1
- 测试方法:定时器1秒刷新1次,每次在循环中添加10个点数据;
- 测试结果:
- 从整个函数看
update_chart1耗时是update_chart2的6.5倍; - 从单行代码看
append耗时是replace的11.3倍;
- 从整个函数看
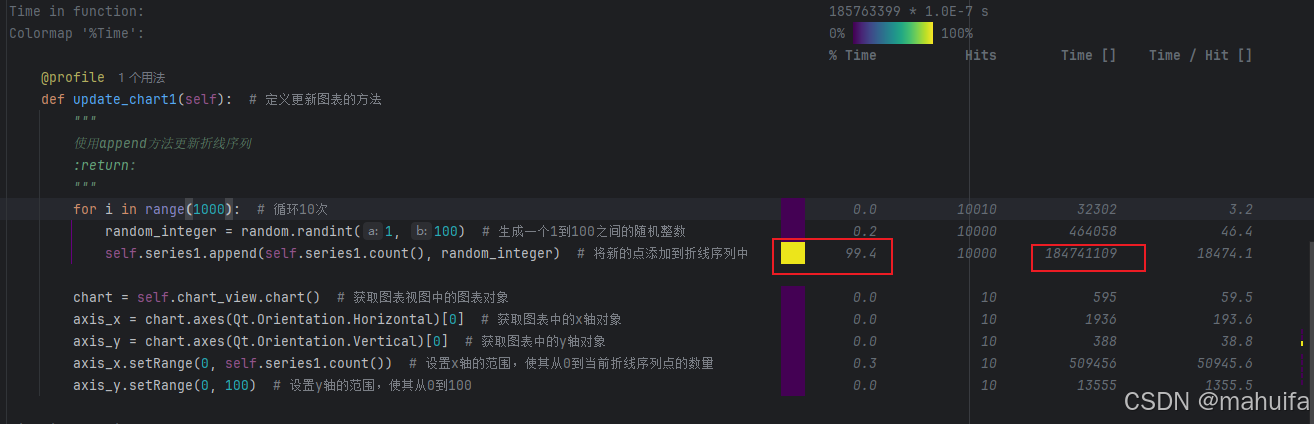
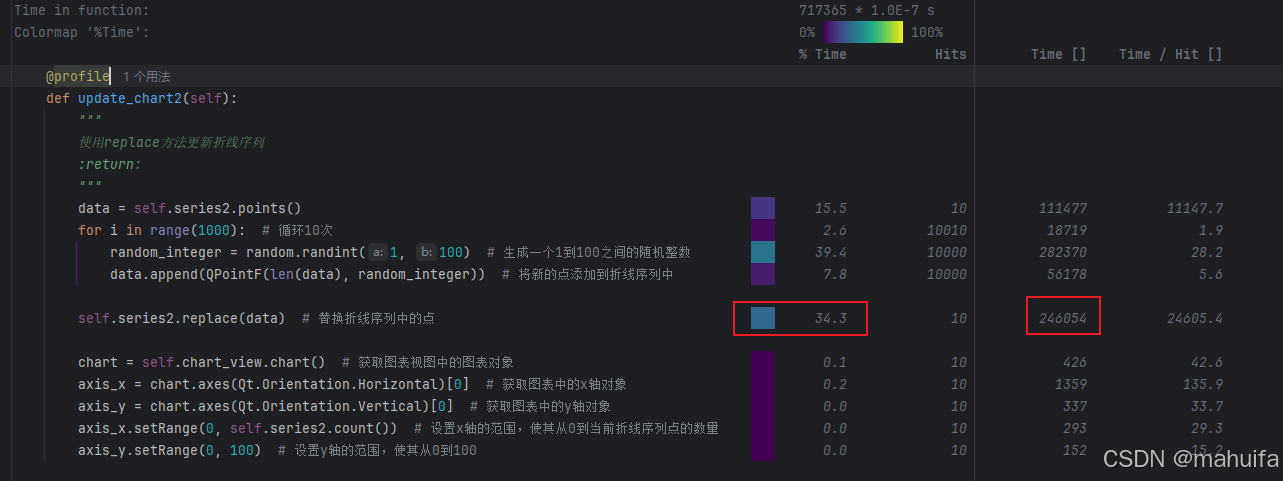
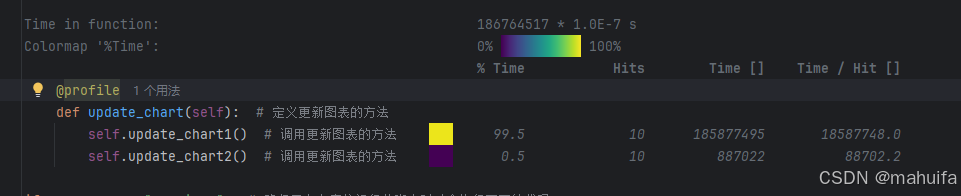
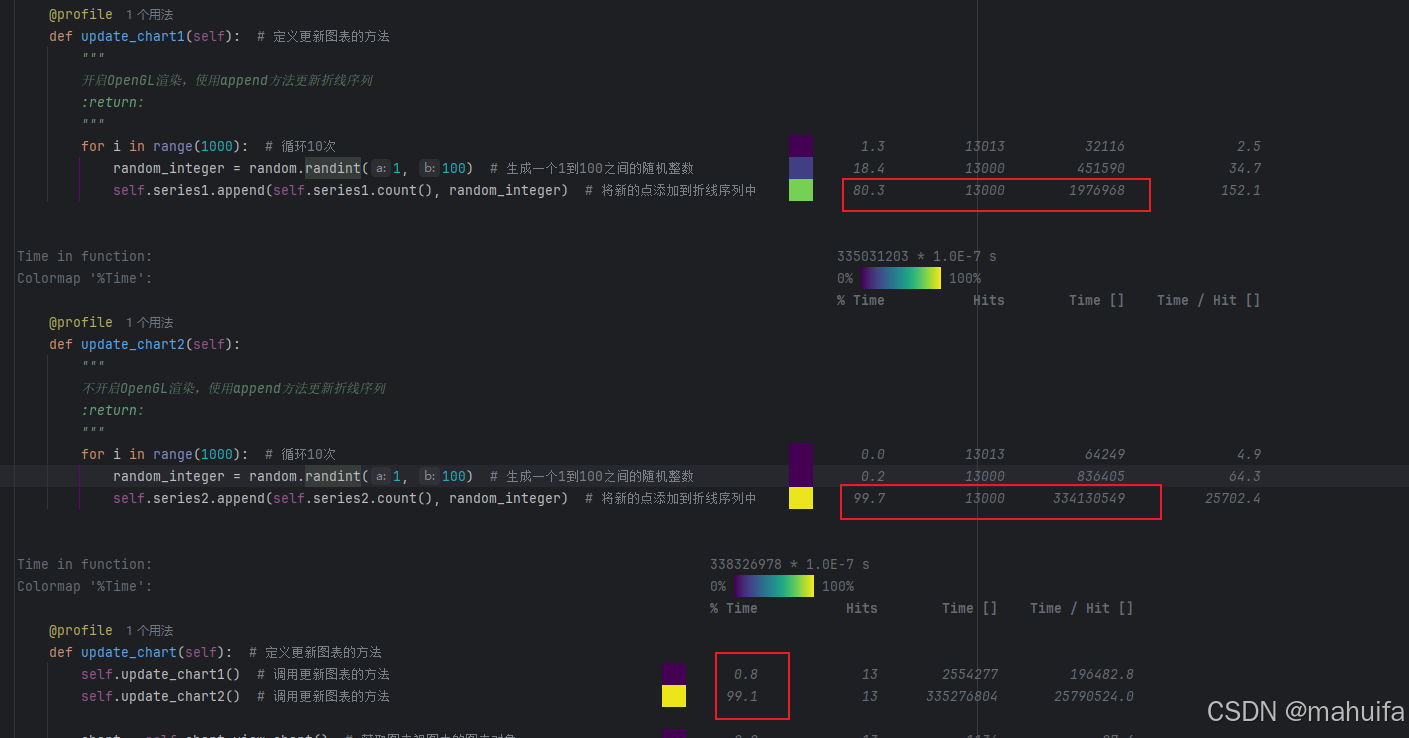
1.2 测试2
- 测试方法:定时器1秒刷新1次,每次在循环中添加1000个点数据;
- 测试结果:
- 从整个函数看
update_chart1耗时是update_chart2的199倍; - 从单行代码看
append耗时是replace的750倍;
- 从整个函数看
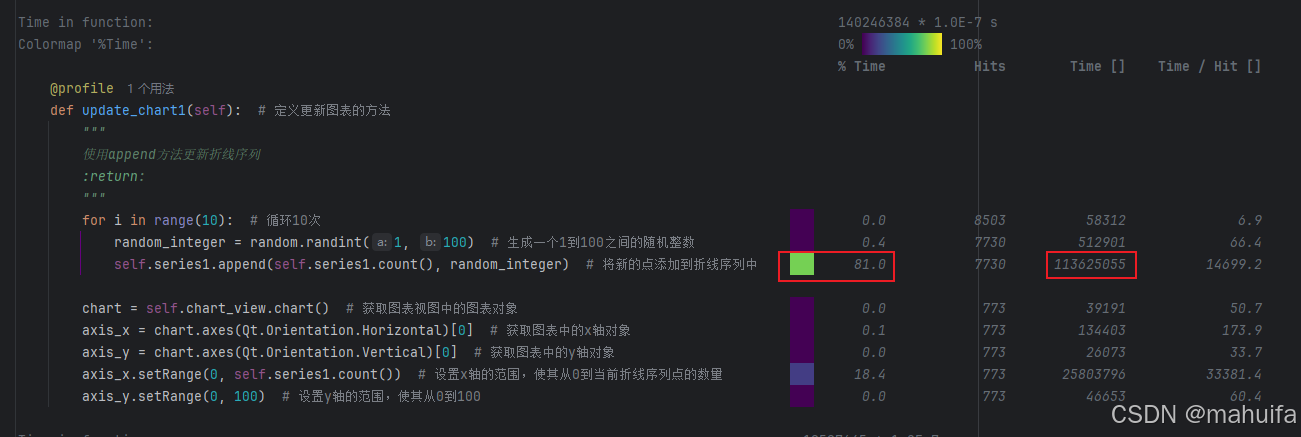
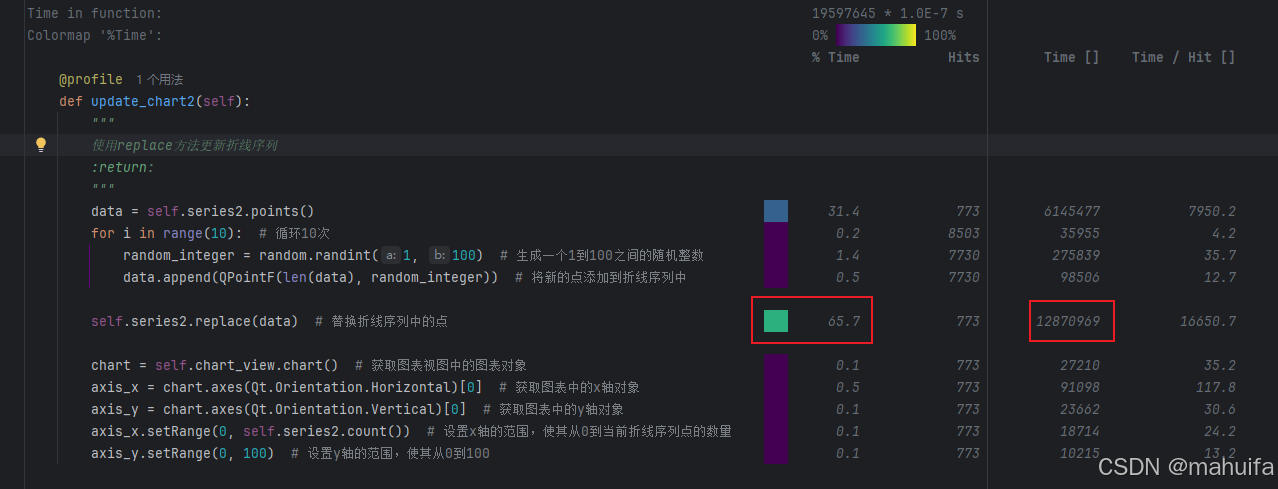
1.3 测试3
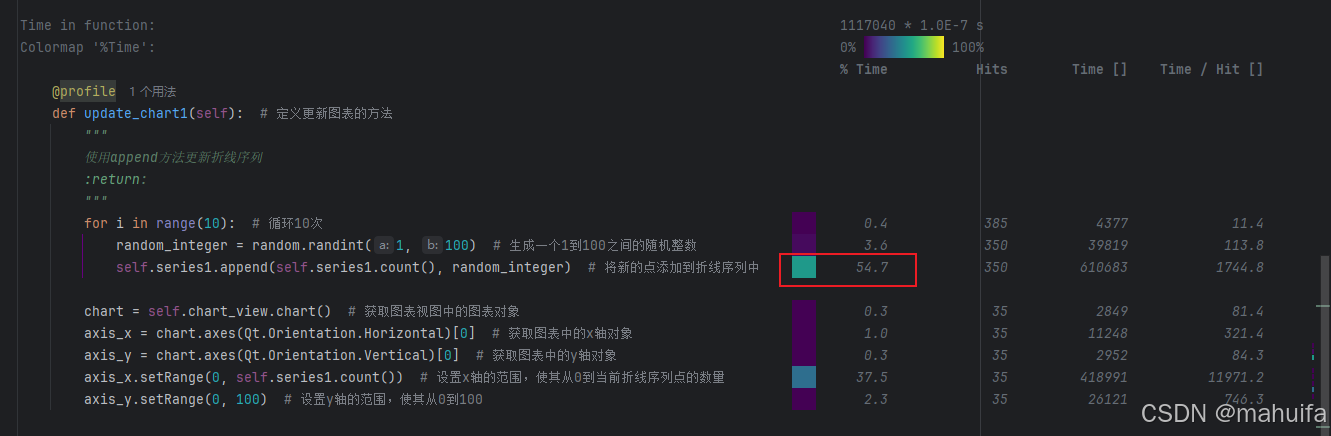
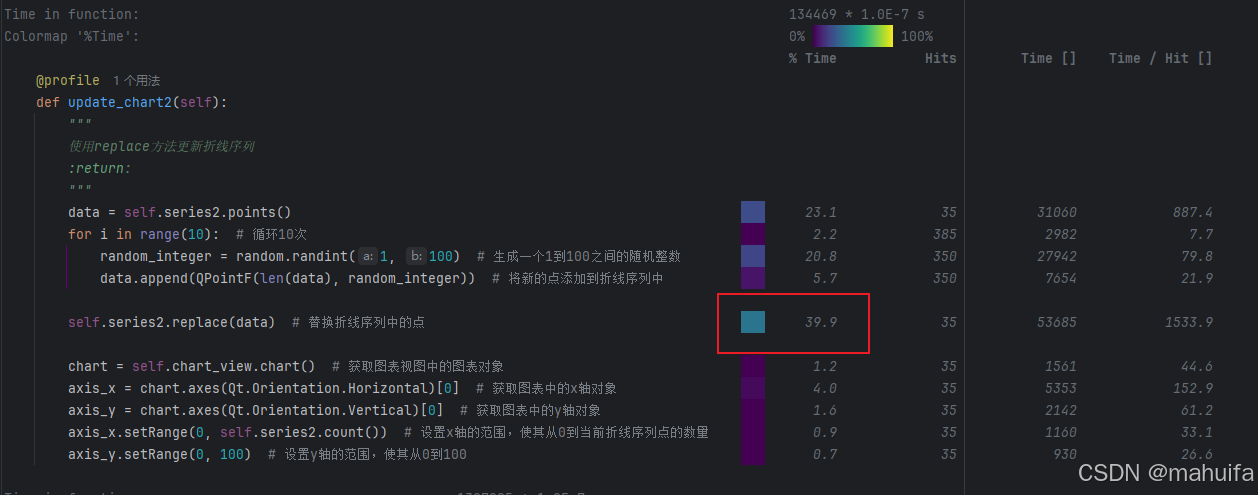
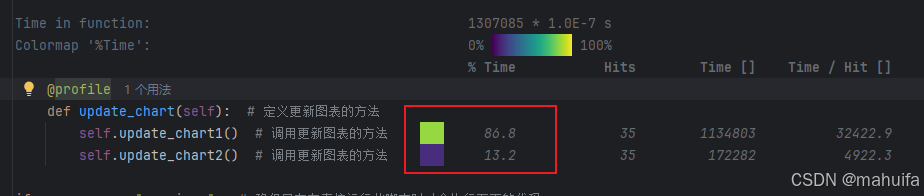
- 测试方法:定时器10毫秒刷新1次,每次在循环中添加10个点数据;
- 测试结果:
- 从整个函数看
update_chart1耗时是update_chart2的5.57倍; - 从单行代码看
append耗时是replace的8.82倍;
- 从整个函数看

2 开启OpenGL
| 环境 | 说明 |
|---|---|
| 系统 | windows10 |
| python | 3.13 |
| pyside6 | 6.8.3 |
| 性能分析工具 | line_profiler_pycharm |
-
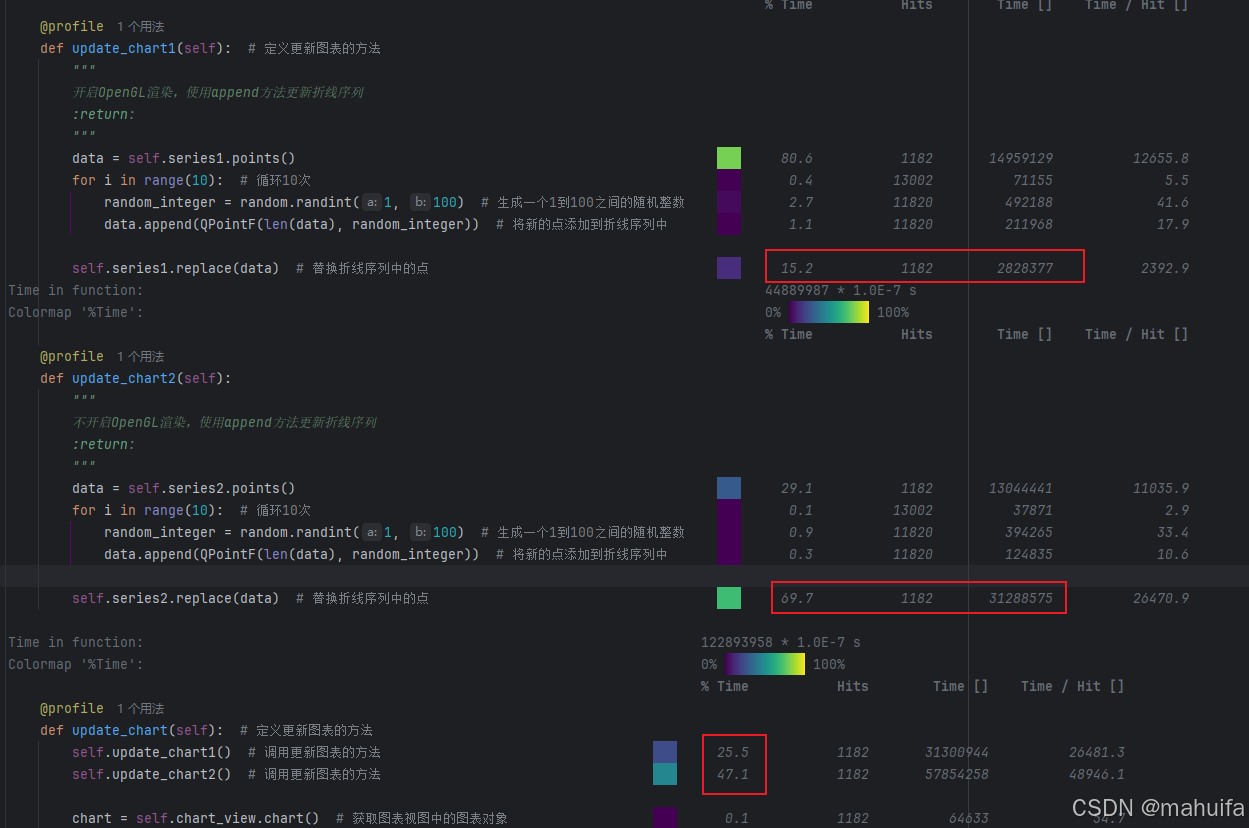
如下所示,对比开启OpenGL和开启OpenGL的性能区别;当使用appeng添加数据时,开启opengl和不开opengl的区别最大;
-
示例代码:
pythonimport random # 导入random模块,用于生成随机数 import sys from PySide6.QtCharts import QChart, QChartView, QLineSeries, QValueAxis # 导入QtCharts模块,用于创建图表和轴 from PySide6.QtCore import QTimer # 导入QTimer,用于定时更新图表 from PySide6.QtCore import Qt # 导入Qt核心模块,用于设置对齐方式等 from PySide6.QtGui import QPainter # 导入QPainter,用于设置图表的渲染提示 from PySide6.QtWidgets import QApplication, QMainWindow # 导入PySide6的QApplication和QMainWindow类 from line_profiler_pycharm import profile from PySide6.QtCore import QPointF class MainWindow(QMainWindow): # 定义MainWindow类,继承自QMainWindow def __init__(self): super().__init__() # 调用父类的构造函数 self.setWindowTitle("PySide6 折线图示例") # 设置窗口标题 self.setGeometry(100, 100, 800, 600) # 设置窗口的位置和大小 self.timer = QTimer() # 创建一个定时器 self.timer.timeout.connect(self.update_chart) # 连接定时器超时信号到update_chart方法 self.timer.start(1000) # 设置定时器间隔为10毫秒,并启动定时器 self.chart_view = None # 初始化图表视图为None self.series1 = QLineSeries() # 创建一个折线序列对象 self.series2 = QLineSeries() # 创建一个折线序列对象 self.series1.setUseOpenGL(True) # 设置折线序列使用OpenGL渲染 # self.series2.setUseOpenGL(True) # 设置折线序列使用OpenGL渲染 self.init_chart() # 调用初始化图表的方法 def init_chart(self): # 定义初始化图表的方法 # 设置名称 self.series1.setName("series1") # 设置折线的名称 self.series2.setName("series2") # 设置折线的名称 # 创建图表 chart = QChart() # 创建一个图表对象 chart.addSeries(self.series1) # 将折线序列添加到图表中 chart.addSeries(self.series2) # 将折线序列添加到图表中 chart.setTitle("简单的折线图") # 设置图表的标题 # chart.setAnimationOptions(QChart.AnimationOption.SeriesAnimations) # 设置图表不使用动画 # 创建x轴和y轴 axis_x = QValueAxis() # 创建一个数值型x轴 axis_y = QValueAxis() # 创建一个数值型y轴 axis_y.setRange(0, 100) # 设置y轴的范围,使其从0到100 chart.addAxis(axis_x, Qt.AlignmentFlag.AlignBottom) # 将x轴添加到图表底部 chart.addAxis(axis_y, Qt.AlignmentFlag.AlignLeft) # 将y轴添加到图表左侧 self.series1.attachAxis(axis_x) # 将折线序列附着到x轴 self.series1.attachAxis(axis_y) # 将折线序列附着到y轴 self.series2.attachAxis(axis_x) # 将折线序列附着到x轴 self.series2.attachAxis(axis_y) # 将折线序列附着到y轴 # 创建图表视图 self.chart_view = QChartView(chart) # 创建一个图表视图对象,并将图表添加进去 self.chart_view.setRenderHint(QPainter.RenderHint.Antialiasing) # 设置图表视图的渲染提示为抗锯齿 # 设置主窗口的中心部件 self.setCentralWidget(self.chart_view) # 设置主窗口的中心部件为图表视图 @profile def update_chart1(self): # 定义更新图表的方法 """ 开启OpenGL渲染,使用append方法更新折线序列 :return: """ for i in range(10): # 循环10次 random_integer = random.randint(1, 100) # 生成一个1到100之间的随机整数 self.series1.append(self.series1.count(), random_integer) # 将新的点添加到折线序列中 @profile def update_chart2(self): """ 不开启OpenGL渲染,使用append方法更新折线序列 :return: """ for i in range(10): # 循环10次 random_integer = random.randint(1, 100) # 生成一个1到100之间的随机整数 self.series2.append(self.series2.count(), random_integer) # 将新的点添加到折线序列中 @profile def update_chart(self): # 定义更新图表的方法 self.update_chart1() # 调用更新图表的方法 self.update_chart2() # 调用更新图表的方法 chart = self.chart_view.chart() # 获取图表视图中的图表对象 axis_x = chart.axes(Qt.Orientation.Horizontal)[0] # 获取图表中的x轴对象 max_x = self.series2.count() axis_x.setRange(0, max_x) # 设置x轴的范围,使其从0到当前折线序列点的数量 if __name__ == "__main__": # 确保只有在直接运行此脚本时才会执行下面的代码 app = QApplication(sys.argv) # 创建一个QApplication对象 window = MainWindow() # 创建一个MainWindow对象 window.show() # 显示主窗口 sys.exit(app.exec()) # 进入应用程序的主循环,并等待退出
2.1 测试1
- 测试方法:定时器1秒刷新1次,每次在循环中添加10个点数据;
- 测试结果:
- 从整个函数看
update_chart2耗时是update_chart1的9.7倍; - 从单行代码看
append添加数据不开启opengl耗时是开启opengl的21.3倍;
- 从整个函数看

2.2 测试2
- 测试方法:定时器1秒刷新1次,每次在循环中添加1000个点数据;
- 测试结果:
- 从整个函数看
update_chart2耗时是update_chart1的123倍; - 从单行代码看
append添加数据不开启opengl耗时是开启opengl的169倍;
- 从整个函数看
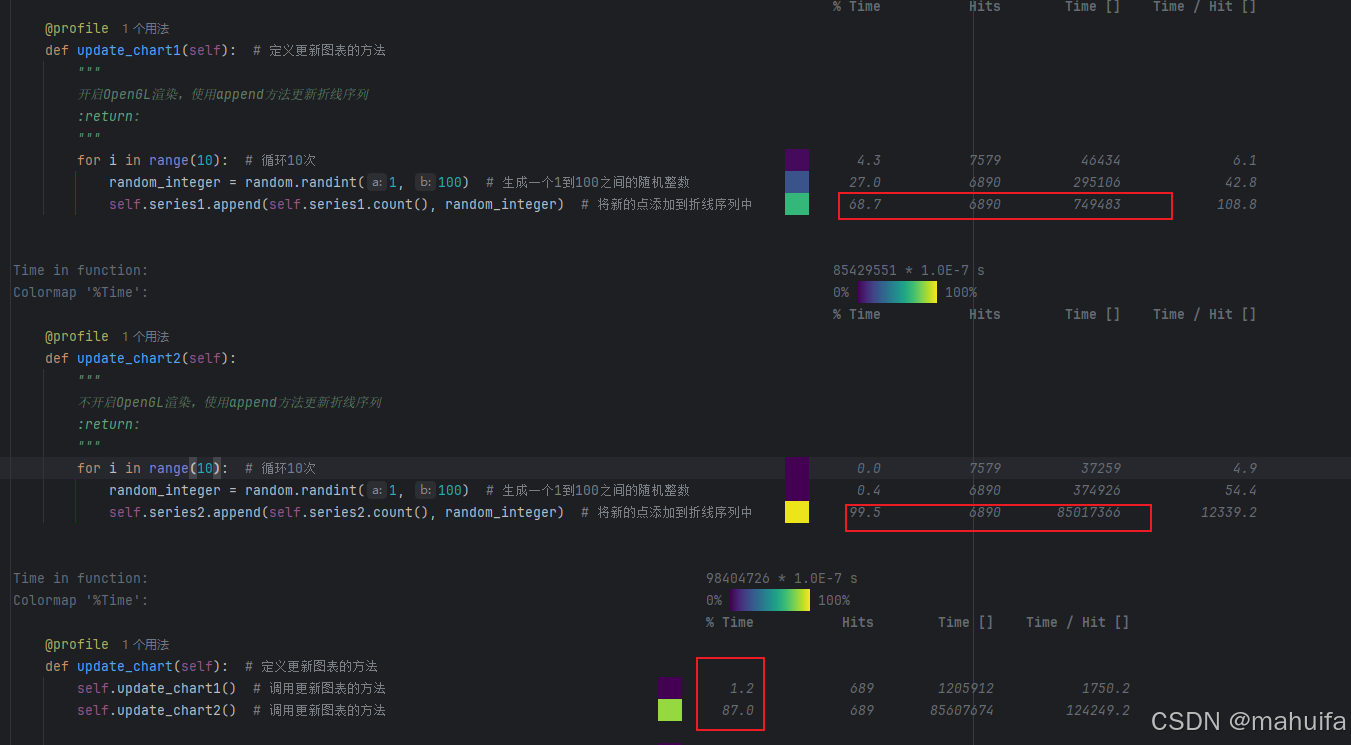
2.3 测试3
- 测试方法:定时器10毫秒刷新1次,每次在循环中添加10个点数据;
- 测试结果:
- 从整个函数看
update_chart2耗时是update_chart1的72.5倍; - 从单行代码看
append添加数据不开启opengl耗时是开启opengl的113倍;
- 从整个函数看
2.4 测试4
-
测试方法:将使用append添加数据改为使用replace添加数据,定时器10毫秒刷新1次,每次在循环中添加10个点数据;
-
测试结果:
- 从整个函数看
update_chart2耗时是update_chart1的1.84倍; - 从单行代码看
replace添加数据不开启opengl耗时是开启opengl的11倍;
- 从整个函数看
-
测试代码:
python@profile def update_chart1(self): # 定义更新图表的方法 """ 开启OpenGL渲染,使用append方法更新折线序列 :return: """ data = self.series1.points() for i in range(10): # 循环10次 random_integer = random.randint(1, 100) # 生成一个1到100之间的随机整数 data.append(QPointF(len(data), random_integer)) # 将新的点添加到折线序列中 self.series1.replace(data) # 替换折线序列中的点 @profile def update_chart2(self): """ 不开启OpenGL渲染,使用append方法更新折线序列 :return: """ data = self.series2.points() for i in range(10): # 循环10次 random_integer = random.randint(1, 100) # 生成一个1到100之间的随机整数 data.append(QPointF(len(data), random_integer)) # 将新的点添加到折线序列中 self.series2.replace(data) # 替换折线序列中的点