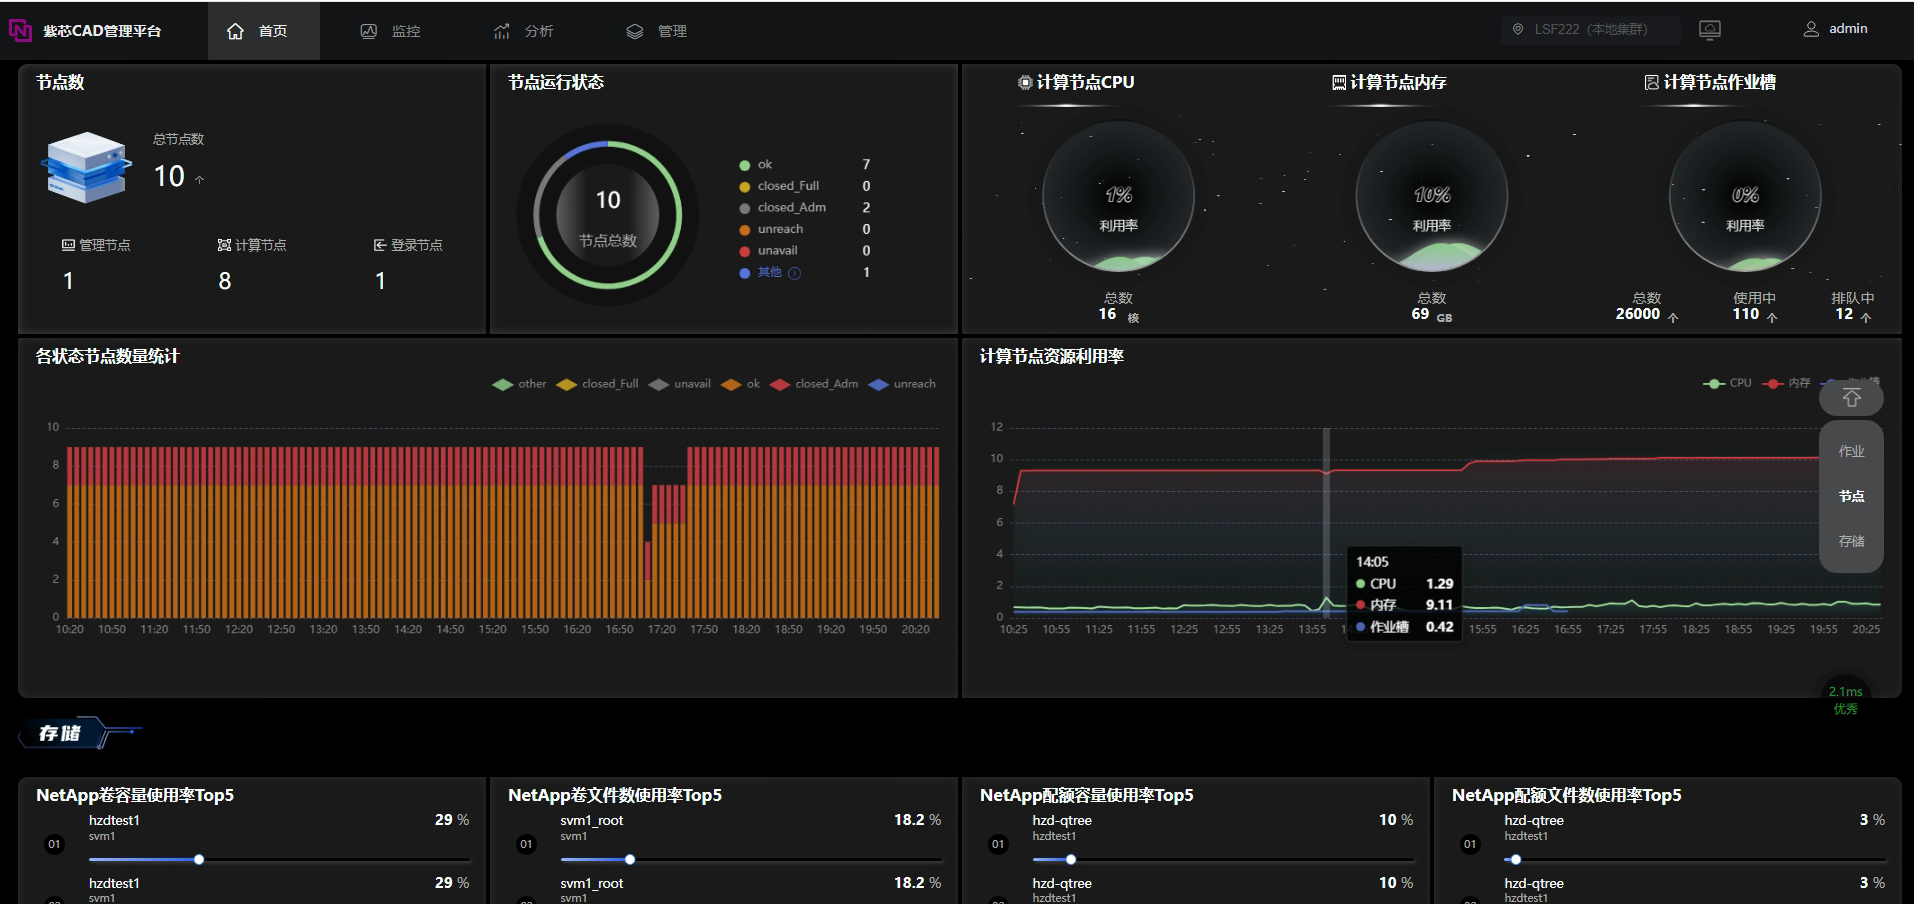
javascript
<template>
<div class="water-balloon">
<div ref="barChart" style="height: 210px; width: calc(50vw - 22px)"></div>
</div>
</template>
<script>
import * as echarts from 'echarts';
import 'echarts-liquidfill';
import ChartResizeMixin from '../mixins/chartResize';
export default {
mixins: [ChartResizeMixin],
name: 'WaterBalloon',
props: { data: null },
watch: {
data(newVal) {
// 数据更新时的处理
this.initBarChart();
}
},
data() {
return {
chart: "",
targetX: 0,
targetY: 0,
targetz: 0,
};
},
mounted() {
this.initBarChart();
// ...existing code...
//window.addEventListener('resize', this.resizeHandler);
},
methods: {
getColorByValue(value) {
// if (typeof value !== 'number') {
// throw new Error('输入值必须是数字');
// }
if (value < 33) {
return '#89CE87'; // 33以下:黄色
} else if (value >= 33 && value <= 66) {
return '#5170DE'; // 33-66:蓝色
} else {
return '#D24343'; // 66以上:红色
}
},
calculateTarget(position) {
const containerWidth = this.$refs.barChart.offsetWidth;
switch (position) {
case 'X':
return containerWidth / 6 - 26; // 计算 targetX
case 'Y':
return containerWidth / 2 - 26; // 计算 targetY
case 'Z':
return (containerWidth / 6) * 5 - 26; // 计算 targetZ
default:
return 0;
}
},
generateTitleConfig() {
const positions = ['X', 'Y', 'Z'];
return positions.map((position) => ({
text: '利用率',
x: this.calculateTarget(position),
y: '60%',
textStyle: {
fontSize: 14,
fontWeight: '100',
color: '#ffffff',
lineHeight: 16,
textAlign: 'center',
},
}));
},
handleResize() {
if (this.chart) {
this.chart.resize();
}
this.chart.setOption({
title: this.generateTitleConfig(),
});
},
chartslabel() {
return {
normal: {
textStyle: {
fontSize: 20, // 字体大小
color: '#000', // 字体颜色
fontWeight: 'bold', // 字体粗细
fontFamily: 'Arial', // 字体族
fontStyle: 'italic', // 字体样式(italic/normal)
textBorderColor: '#BBB', // 文字描边颜色
textBorderWidth: 2 // 文字描边宽度
},
formatter: function (params) {
return (Math.floor(params.value * 10000) / 100) + "%"; //(params.value * 100).toFixed(2) *1 +"%";
},
position: 'inside', // 位置:inside(内部)/outside(外部)/top(顶部)等
},
}
},
initBarChart() {
const usageKeys = ['cpuUsage', 'memoryUsage', 'jobSlotUsage'];
// 遍历 keys,统一处理数据初始化
usageKeys.forEach((key) => {
if (this.data[key] == null || this.data[key] === '-') {
this.data[key] = 0;
}
});
// this.data.cpuUsage = 50;
this.chart = echarts.init(this.$refs.barChart);
let value1 = (this.data.cpuUsage / 100);
let value2 = (this.data.memoryUsage / 100);
let value3 = (this.data.jobSlotUsage / 100);
let colorStops1 = this.getColorByValue(this.data.cpuUsage);
let colorStops2 = this.getColorByValue(this.data.memoryUsage);
let colorStops3 = this.getColorByValue(this.data.jobSlotUsage);
let that = this;
let option = {
title: this.generateTitleConfig(),
series: [
{
type: 'liquidFill',
radius: '80%',
center: ['16.66666%', '50%'],
itemStyle: {
normal: {
shadowBlur: 15,
shadowColor: 'rgba(255, 255, 255, 0.5)'
}
},
color: [
{
type: 'linear',
x: 0,
y: 0,
x2: 0,
y2: 1,
colorStops: [
{
offset: 0,
color: colorStops1,
},
{
offset: 1,
color: '#ADB3CD',
},
],
globalCoord: false,
},
],
data: [value1, value1, value1], // data个数代表波浪数
backgroundStyle: {
color: {
type: 'radial', // 径向渐变
x: 0.5, // 圆心坐标(中心)
y: 0.5,
r: 1,
colorStops: [
{
offset: 1,
color: 'rgba(75,84,97,0.5)',
},
{
offset: 0,
color: 'rgba(0, 0, 0,1)',
},
],
globalCoord: false,
},
},
// label: {
// normal: {
// textStyle: {
// fontSize: 20,
// color: '#fff',
// },
// },
// },
label: that.chartslabel(),
outline: {
// show: false
borderDistance: 0,
itemStyle: {
borderWidth: 2,
borderColor: {
type: 'linear', // 线性渐变
x: 0, y: 0, x2: 0, y2: 1, // 从左到右
colorStops: [
{ offset: 0, color: 'rgba(0, 0, 0, 0.4)' }, // 起始颜色
{ offset: 1, color: 'rgba(255, 255, 255, 0.6)' } // 结束颜色
],
global: false // 非全局坐标系
},
},
},
},
{ //第二个球的填充
type: 'liquidFill',
radius: '80%',
center: ['50%', '50%'],
itemStyle: {
normal: {
shadowBlur: 15,
shadowColor: 'rgba(255, 255, 255, 0.5)'
}
},
color: [
{
type: 'linear',
x: 0,
y: 0,
x2: 0,
y2: 1,
colorStops: [
{
offset: 0,
color: colorStops2,
},
{
offset: 1,
color: '#AFB2CB',
},
],
globalCoord: false,
},
],
data: [value2, value2], // data个数代表波浪数
backgroundStyle: {
color: {
type: 'radial', // 径向渐变
x: 0.5, // 圆心坐标(中心)
y: 0.5,
r: 1,
colorStops: [
{
offset: 1,
color: 'rgba(75,84,97,0.5)',
},
{
offset: 0,
color: 'rgba(0, 0, 0,1)',
},
],
globalCoord: false,
},
},
// label: {
// normal: {
// textStyle: {
// fontSize: 20,
// color: '#fff',
// },
// },
// },
label: that.chartslabel(),
outline: {
// show: false
borderDistance: 0,
itemStyle: {
borderWidth: 2,
borderColor: {
type: 'linear', // 线性渐变
x: 0, y: 0, x2: 0, y2: 1, // 从左到右
colorStops: [
{ offset: 0, color: 'rgba(0, 0, 0, 0.4)' }, // 起始颜色
{ offset: 1, color: 'rgba(255, 255, 255, 0.6)' } // 结束颜色
],
global: false // 非全局坐标系
},
},
},
},
{ //第三个球的填充
type: 'liquidFill',
radius: '80%',
center: ['83.33333%', '50%'],
itemStyle: {
normal: {
shadowBlur: 15,
shadowColor: 'rgba(255, 255, 255, 0.5)'
}
},
color: [
{
type: 'linear',
x: 0,
y: 0,
x2: 0,
y2: 1,
colorStops: [
{
offset: 0,
color: colorStops3,
},
{
offset: 1,
color: '#CDB1B3',
},
],
globalCoord: false,
},
],
data: [value3, value3], // data个数代表波浪数
backgroundStyle: {
color: {
type: 'radial', // 径向渐变
x: 0.5, // 圆心坐标(中心)
y: 0.5,
r: 1,
colorStops: [
{
offset: 1,
color: 'rgba(75,84,97,0.5)',
},
{
offset: 0,
color: 'rgba(0, 0, 0,1)',
},
],
globalCoord: false,
},
},
label: that.chartslabel(),
outline: {
// show: false
borderDistance: 0,
itemStyle: {
borderWidth: 2,
borderColor: {
type: 'linear', // 线性渐变
x: 0, y: 0, x2: 0, y2: 1, // 从左到右
colorStops: [
{ offset: 0, color: 'rgba(0, 0, 0, 0.4)' }, // 起始颜色
{ offset: 1, color: 'rgba(255, 255, 255, 0.6)' } // 结束颜色
],
global: false // 非全局坐标系
},
},
},
},
],
};
this.chart.setOption(option);
},
// ...existing code...
},
};
</script>
<style scoped></style>