悄悄说句题外话,MATLAB 官方入驻知乎啦,趁着还小快去欺负~

本期推送大概讲一下各种各样的三角热图咋画,众所周知,顶刊中很喜欢用这些花里胡哨的热图,例如:
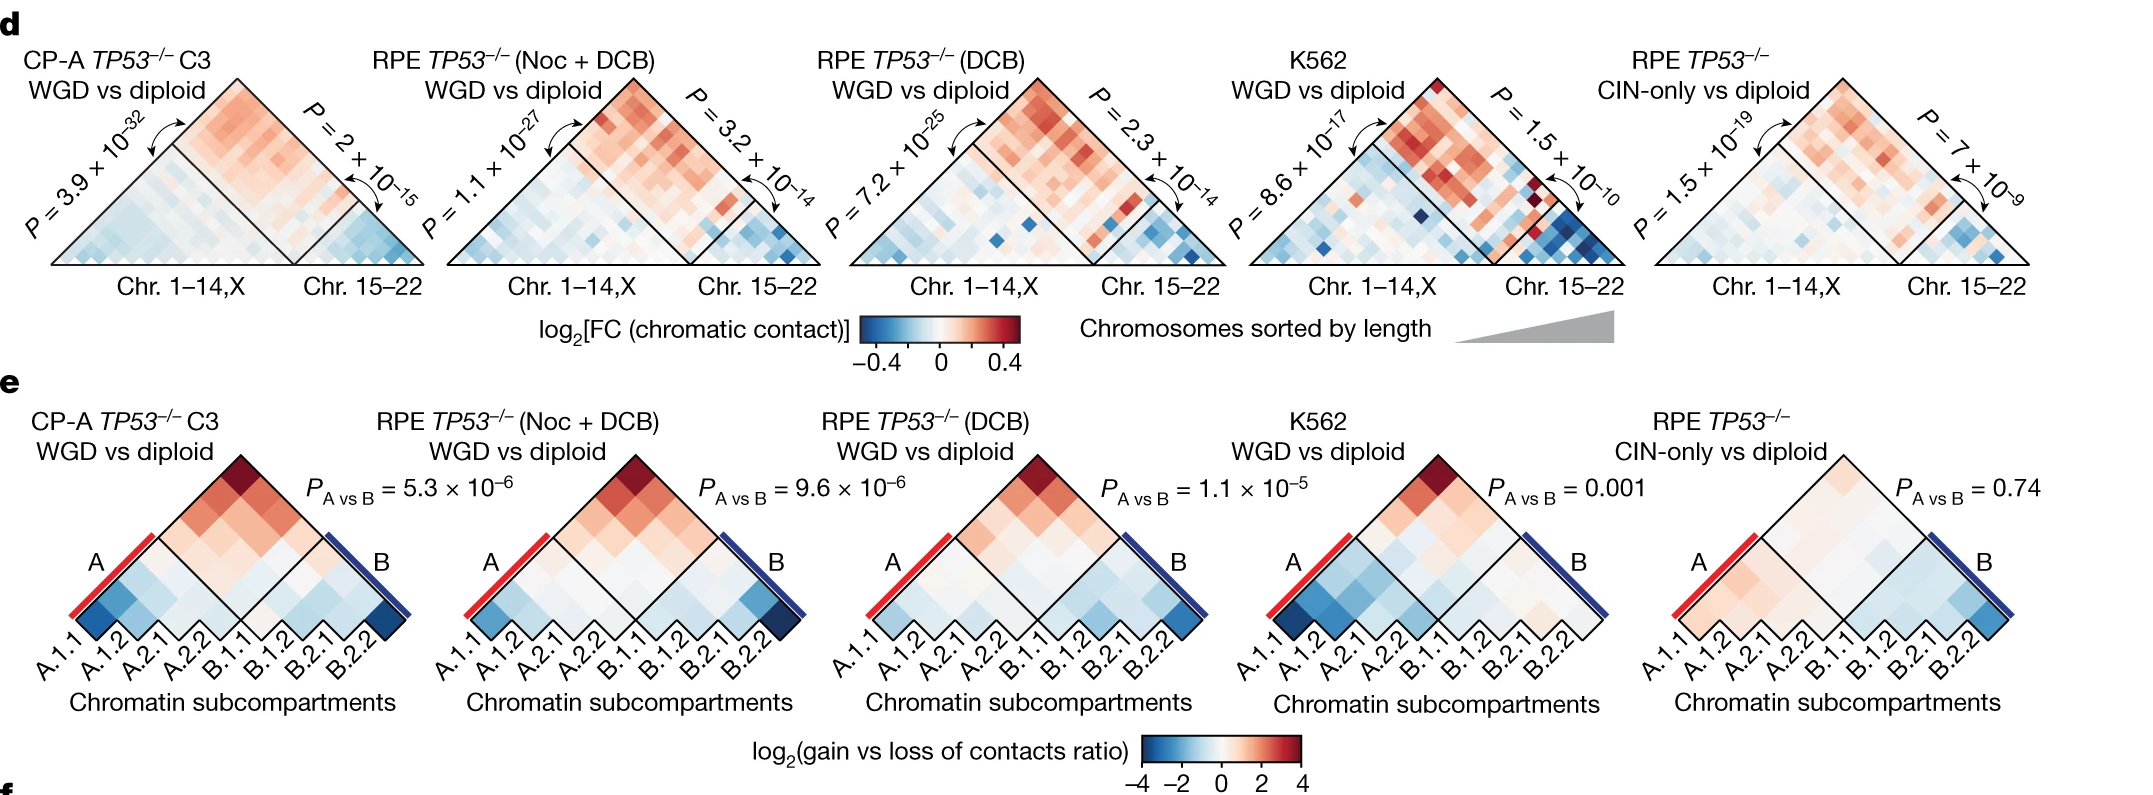
- Lambuta, R.A., Nanni, L., Liu, Y. et al. Whole-genome doubling drives oncogenic loss of chromatin segregation. Nature 615, 925--933 (2023). https://doi.org/10.1038/s41586-023-05794-2
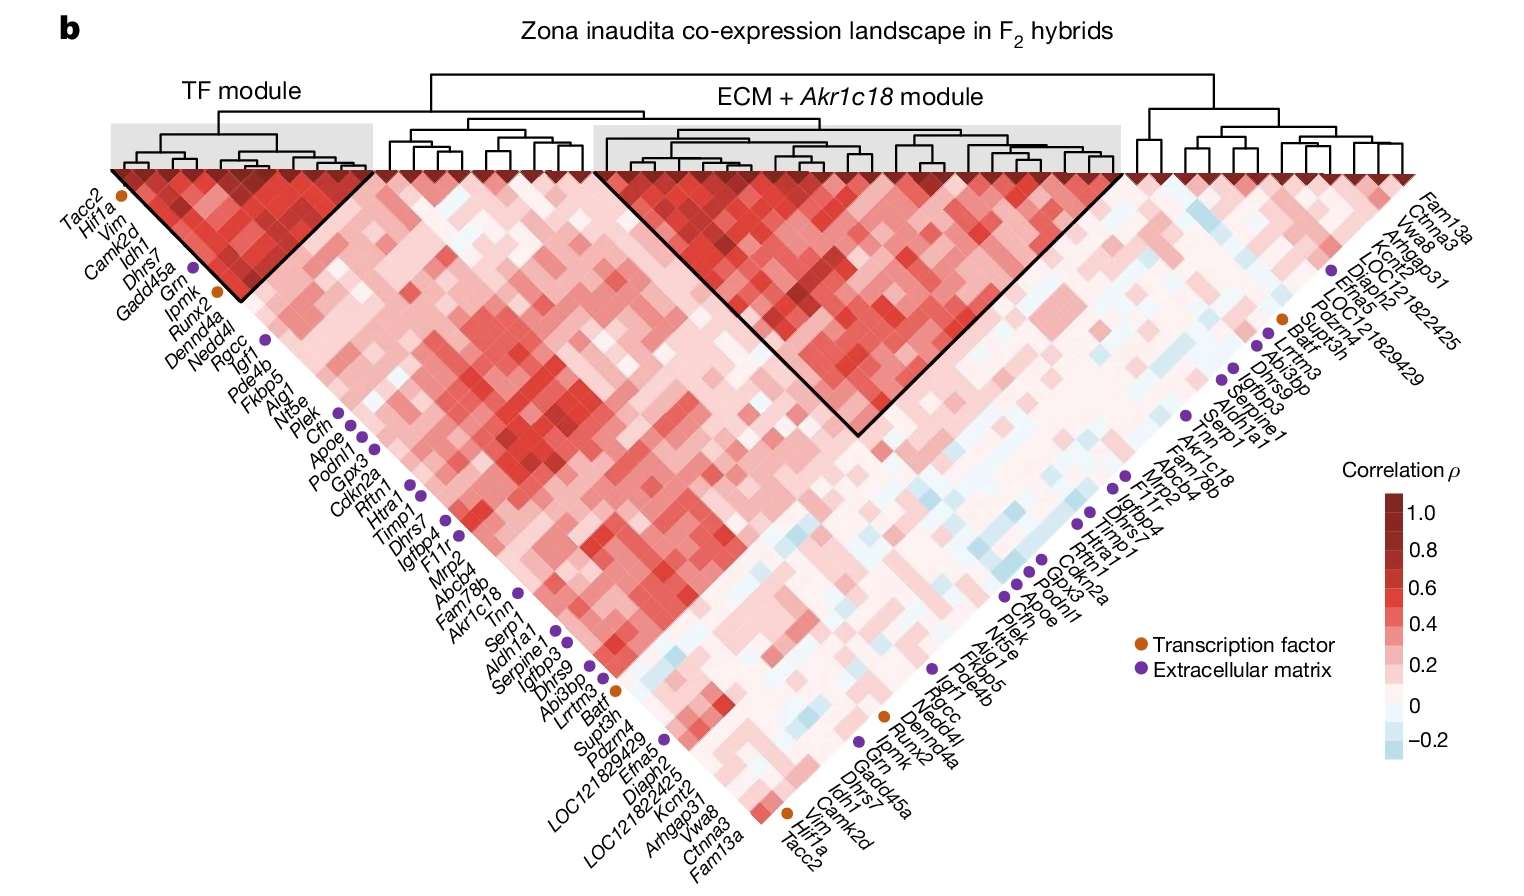
- Niepoth, N., Merritt, J.R., Uminski, M. et al. Evolution of a novel adrenal cell type that promotes parental care. Nature 629, 1082--1090 (2024). https://doi.org/10.1038/s41586-024-07423-y
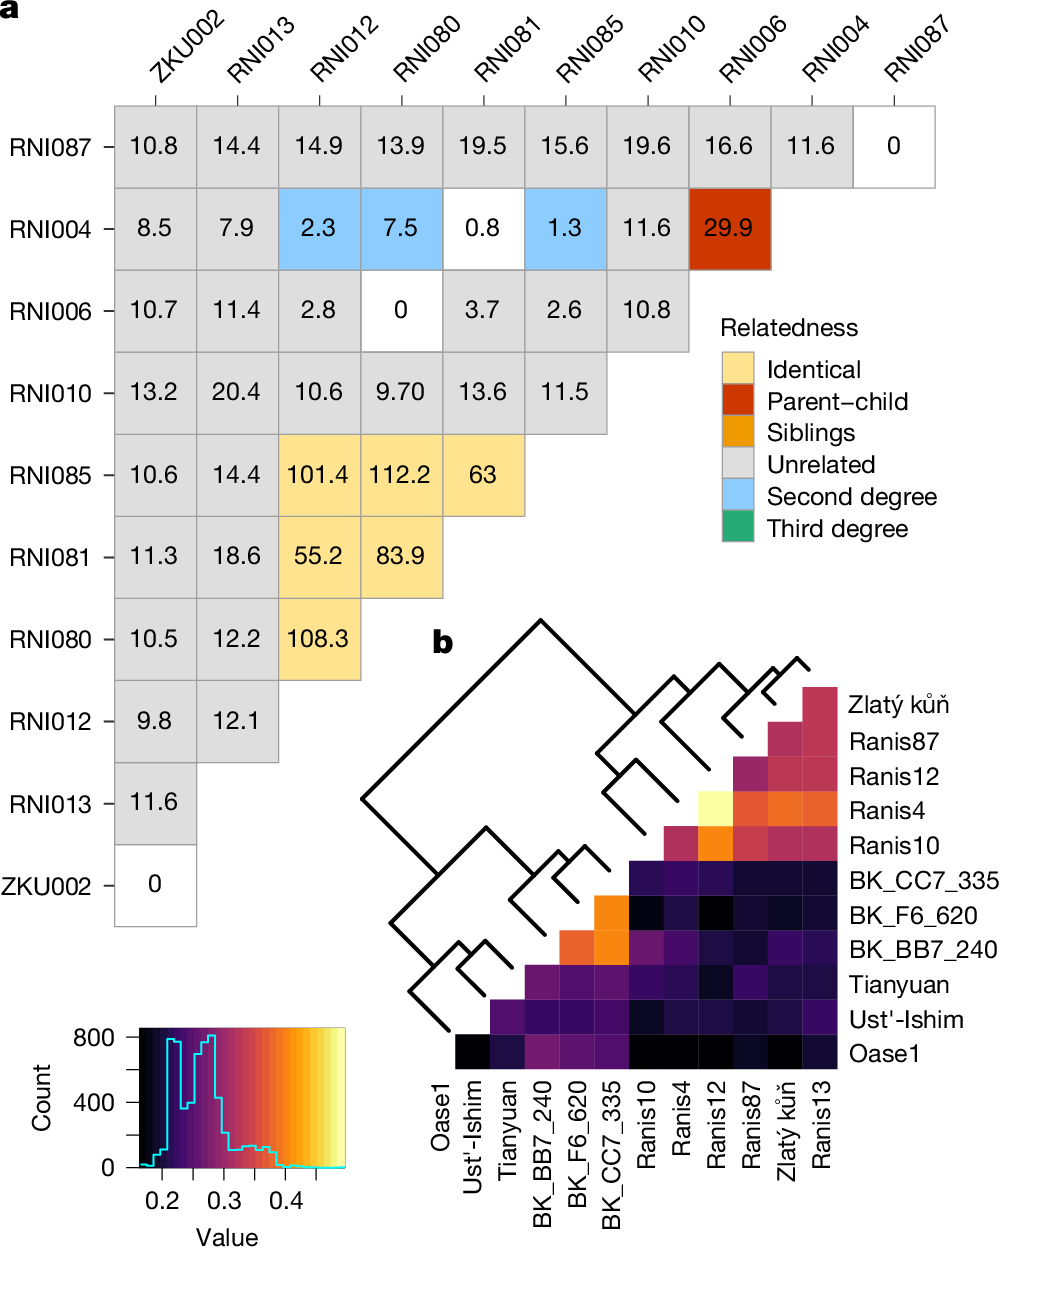
- Sümer, A.P., Rougier, H., Villalba-Mouco, V. et al. Earliest modern human genomes constrain timing of Neanderthal admixture. Nature 638, 711--717 (2025). https://doi.org/10.1038/s41586-024-08420-x
绘图工具
这里使用我开发的树状图绘制工具,虽然在这个工具里各种角度各种旋转的热图只是附属工具,但还是够用了,使用教程及代码仓库请见:
- https://blog.csdn.net/slandarer/article/details/136266059
- https://gitee.com/slandarer/matlab-stree-dendrogram
- https://www.mathworks.com/matlabcentral/fileexchange/160048-stree-dendrogram
当然我会在文末把需要用到的代码和示例放在一起,可以直接找文末链接。
正文
我就直接给模板代码了,注释做的还算比较清晰:大体就是走的创建热图->旋转->隐藏上半或者下半部分的方式来进行的实现。配色可以直接使用colormap函数修改。
涉及要画树状图或者要分组的情况,就需要先使用树状图绘制工具进行分组,然后把数据传入热图绘制工具:
matlab
SM.RowOrder = ST.order;
SM.RowClass = ST.class;
SM.ColOrder = ST.order;
SM.ColClass = ST.class;
倒三角热图
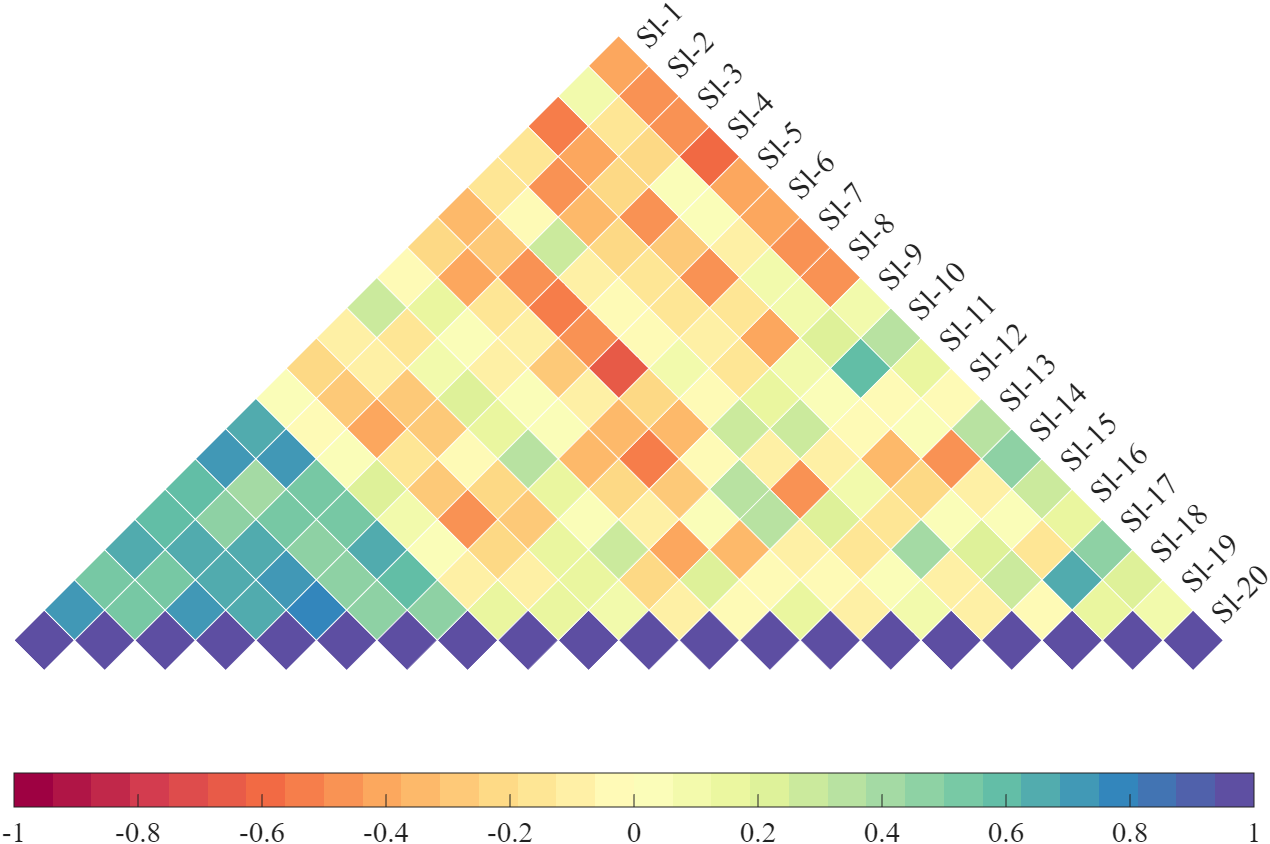
matlab
% 随机生成数据
X = randn(20,20)+[(linspace(-1,2.5,20)').*ones(1,8),(linspace(.5,-.7,20)').*ones(1,5),(linspace(.9,-.2,20)').*ones(1,7)];
Data = corr(X);
% 变量名列表
NameList = compose('Sl-%d',1:20);

fig = figure('Units', 'normalized', 'Position', [.05,.1,.6,.8], 'Color', 'w');
%% ========================================================================
% 创建热图对象 -- create heatmap object
SM = SMatrix(Data);
SM.ColName = NameList;
% 设置文本和字体 -- Set Text and Font
SM.LeftLabel = 'off';
SM.BottomLabel = 'off';
SM.TopLabel = 'on';
SM.TopLabelFont = {'FontSize', 15, 'FontName', 'Times New Roman', 'Rotation', 45};
% 设置位置 -- set position
SM.XLim = [0,1];
SM.YLim = [0,1];
SM.TLim = [-pi/4,-pi/4];
SM.draw()
%% ========================================================================
% 修饰句柄 -- decorate handles
% 清除热图下半部分 -- Clear the bottom half of the heatmap
tData = triu(ones(size(Data)),1);
tInd = find(tData(:) == 1);
for i = 1:length(tInd)
    set(SM.heatmapHdl{tInd(i)}, 'Visible', 'off')
end
% 修饰坐标区域 -- decorate axes
set(gca, 'XColor', 'none', 'YColor', 'none',...
    'DataAspectRatio', [1,1,1],'XLim', [0,1.45]);
CB = colorbar();
set(CB,'Location','southoutside','FontName','Times New Roman','FontSize',14);
带分组树状图倒三角热图
matlab
% 随机生成数据
X=randn(20,20)+[(linspace(-1,2.5,20)').*ones(1,8),(linspace(.5,-.7,20)').*ones(1,5),(linspace(.9,-.2,20)').*ones(1,7)];
Data = corr(X);
% 变量名列表
NameList = compose('Sl-%d',1:20);
% 分类配色 -- Color schemes for each clust
CList = [0.1490    0.4039    0.4980
         0.3882    0.3608    0.4471
         0.5373    0.2157    0.3098
         0.7686    0.4353    0.2431];

fig = figure('Units', 'normalized', 'Position', [.05,.1,.6,.8], 'Color', 'w');
%% ========================================================================
% 创建聚类树状图对象 -- create tree(dendrogram) object
% 左侧聚类树状图 -- left Cluster Tree
Z1 = linkage(Data, 'average');
ST = STree(Z1, 'MaxClust', 3); % 聚类数量,如果大于4请给CList多设置几个颜色
ST.Orientation = 'left';
ST.XLim = [-.25,-.05];
ST.YLim = [0,1];
ST.TLim = [-pi/4,-pi/4];
ST.Label = 'off';
ST.BranchColor = 'on';
ST.BranchHighlight = 'on';
ST.ClassHighlight = 'on';
ST.RTick = [0,1,1.2,0];
ST.CData = CList;
% 每个类之间加入间隙 -- insert gap between each clust
ST.ClustGap = 'on';
ST.draw()
%% ========================================================================
% 创建热图对象 -- create heatmap object
SM = SMatrix(Data);
% 添加分组信息 -- Add grouping information
SM.ColName = NameList;
SM.RowOrder = ST.order;
SM.RowClass = ST.class;
SM.ColOrder = ST.order;
SM.ColClass = ST.class;
% 设置文本和字体 -- Set Text and Font
SM.LeftLabel = 'off';
SM.BottomLabel = 'off';
SM.TopLabel = 'on';
SM.TopLabelFont = {'FontSize', 15, 'FontName', 'Times New Roman', 'Rotation', 45};
% 每个类之间加入间隙 -- insert gap between each clust
SM.ClustGap = 'on';
% 设置位置 -- set position
SM.XLim = [0,1];
SM.YLim = [0,1];
SM.TLim = [-pi/4,-pi/4];
SM.draw()
%% ========================================================================
% 修饰句柄 -- decorate handles
% 清除热图下半部分 -- Clear the bottom half of the heatmap
tData = triu(ones(size(Data)),1);
tInd = find(tData(:) == 1);
for i = 1:length(tInd)
    set(SM.heatmapHdl{tInd(i)}, 'Visible', 'off')
end
% 修饰坐标区域 -- decorate axes
set(gca, 'XColor', 'none', 'YColor', 'none',...
    'DataAspectRatio', [1,1,1],'XLim', [-.15,1.45]);
CB = colorbar();
set(CB,'Location','southoutside','FontName','Times New Roman','FontSize',14);
带倾斜树状图的三角热图
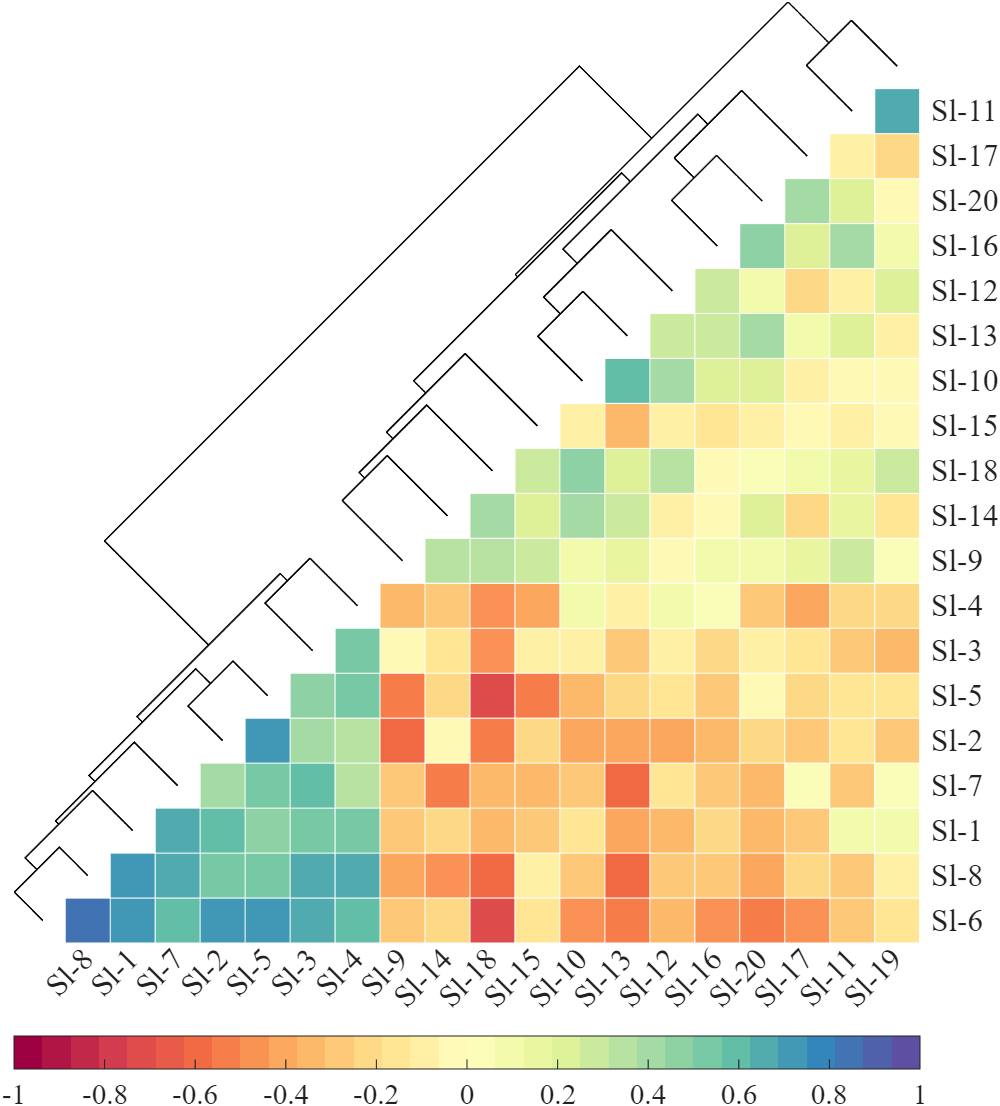
matlab
% 随机生成数据
X = randn(20,20)+[(linspace(-1,2.5,20)').*ones(1,8),(linspace(.5,-.7,20)').*ones(1,5),(linspace(.9,-.2,20)').*ones(1,7)];
Data = corr(X);
% 变量名列表
NameList = compose('Sl-%d',1:20);

fig = figure('Units', 'normalized', 'Position', [.05,.1,.6,.8], 'Color', 'w');
%% ========================================================================
% 创建聚类树状图对象 -- create tree(dendrogram) object
% 左侧聚类树状图 -- left Cluster Tree
Z1 = linkage(Data, 'average');
ST = STree(Z1, 'MaxClust', 3); % 聚类数量,如果大于4请给CList多设置几个颜色
ST.Orientation = 'left';
ST.XLim = [-.25,0];
ST.YLim = [0,sqrt(2)];
ST.TLim = [-pi/4,-pi/4];
ST.Label = 'off';
ST.draw()
%% ========================================================================
% 创建热图对象 -- create heatmap object
SM = SMatrix(Data);
% 添加分组信息 -- Add grouping information
SM.RowOrder = ST.order;
SM.ColOrder = ST.order;
SM.ColName = NameList; SM.ColName{ST.order(1)} = '';
SM.RowName = NameList; SM.RowName{ST.order(end)} = '';
% 设置文本和字体 -- Set Text and Font
SM.RightLabel = 'on';
SM.LeftLabel = 'off';
SM.RightLabelFont = {'FontSize', 15, 'FontName', 'Times New Roman'};
SM.BottomLabelFont = {'FontSize', 15, 'FontName', 'Times New Roman'};
% 设置位置 -- set position
SM.XLim = [0,1];
SM.YLim = [0,1];
SM.TLim = [0,0];
SM.draw()
%% ========================================================================
% 修饰句柄 -- decorate handles
% 清除热图左上部分 -- Clear the bottom half of the heatlmap
tData = tril(ones(size(Data)), 0);
tInd = find(tData(:) == 1);
for i = 1:length(tInd)
    set(SM.heatmapHdl{tInd(i)}, 'Visible', 'off')
end
% 修饰坐标区域 -- decorate axes
set(gca, 'XColor', 'none', 'YColor', 'none',...
    'DataAspectRatio', [1,1,1], 'YLim',get(gca,'YLim')-[.05,0]);
CB = colorbar();
set(CB,'Location','southoutside','FontName','Times New Roman','FontSize',14);
带高亮框的分组倒三角热图
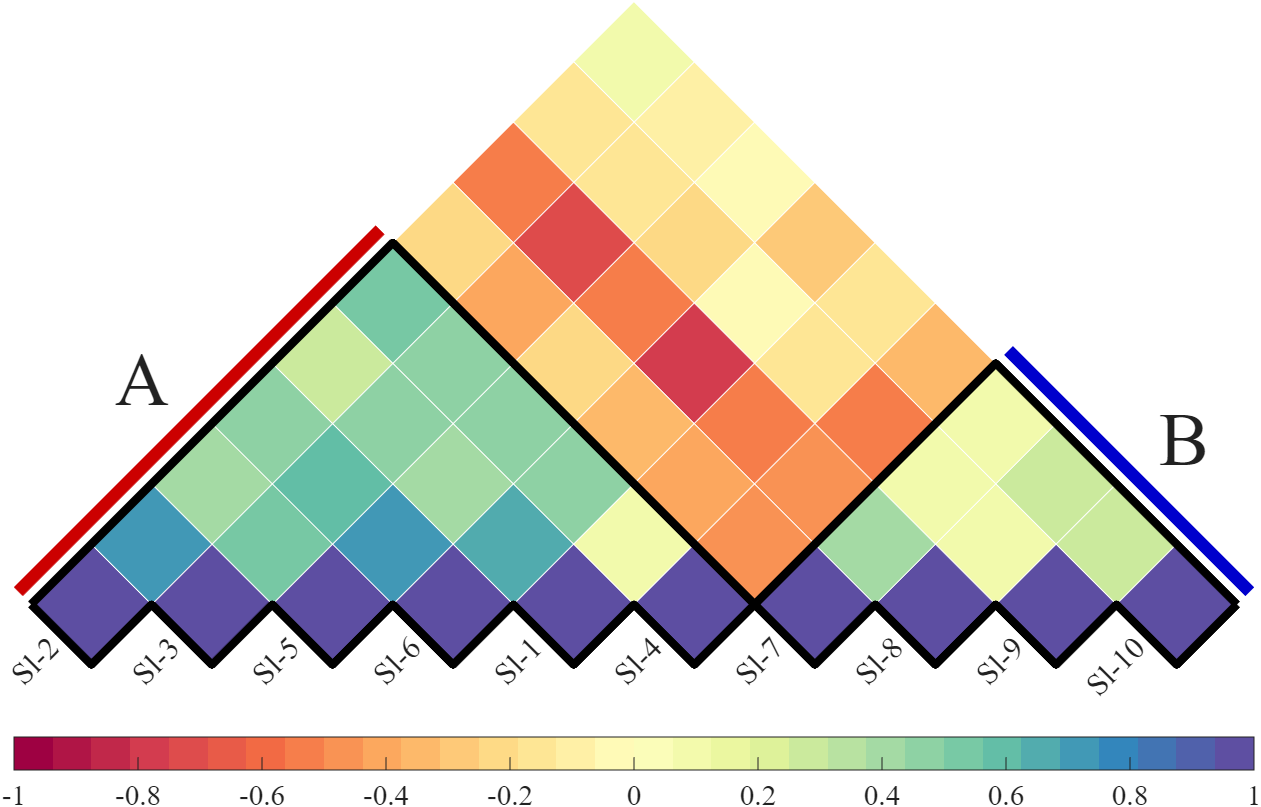
matlab
% 随机生成数据
X = randn(20,10)+[(linspace(-1,2.5,20)').*ones(1,6),(linspace(.5,-.7,20)').*ones(1,4)];
Data = corr(X);
% 变量名列表
NameList = compose('Sl-%d',1:10);
% 通过树状图工具进行分类和数值计算(毕竟这个热图工具是树状图工具的附属)
Z1 = linkage(Data, 'average');
ST = STree(Z1, 'MaxClust', 2);
ST.draw(); close all
fig = figure('Units', 'normalized', 'Position', [.05,.1,.6,.8], 'Color', 'w');
%% ========================================================================
% 创建热图对象 -- create heatmap object
SM = SMatrix(Data);
% 添加分组信息 -- Add grouping information
SM.RowOrder = ST.order;
SM.RowClass = ST.class;
SM.RowName = NameList;
SM.ColOrder = ST.order;
SM.ColClass = ST.class;
SM.ColName = NameList;
% 设置文本和字体 -- Set Text and Font
SM.LeftLabel = 'off';
SM.BottomLabelFont = {'FontSize', 15, 'FontName', 'Times New Roman', ...
'Rotation',45, 'HorizontalAlignment','right', 'VerticalAlignment','baseline'};
% 设置位置 -- set position
SM.XLim = [0,1];
SM.YLim = [0,1];
SM.TLim = [-pi/4,-pi/4];
SM.draw()
%% ========================================================================
% 修饰句柄 -- decorate handles
% 清除热图下半部分 -- Clear the bottom half of the heatmap
tData = triu(ones(size(Data)),1);
tInd = find(tData(:) == 1);
for i = 1:length(tInd)
set(SM.heatmapHdl{tInd(i)}, 'Visible', 'off')
end
% 移动标签位置
txtHdl = findobj(gca,'Type','text');
for i = 1:length(txtHdl)
txtHdl(i).Position(2) = txtHdl(1).Position(2);
txtHdl(i).Position(1) = txtHdl(i).Position(1).*sqrt(2).*sqrt(2);
end
% 修饰坐标区域 -- decorate axes
set(gca, 'XColor', 'none', 'YColor', 'none',...
'DataAspectRatio', [1,1,1],'XLim', [-.02,sqrt(2) + .02]);
CB = colorbar();
set(CB,'Location','southoutside','FontName','Times New Roman','FontSize',14);
%% 绘制分组黑线 ============================================================
numN = length(ST.class);
numA = sum(ST.class == ST.class(1));
numB = sum(ST.class == ST.class(end));
plot([0,sqrt(2)/2,sqrt(2)].*numA./numN, [0,sqrt(2)/2,0].*numA./numN, 'Color','k', 'LineWidth',4)
plot(sqrt(2) - [0,sqrt(2)/2,sqrt(2)].*numB./numN, [0,sqrt(2)/2,0].*numB./numN, 'Color','k', 'LineWidth',4)
xx = linspace(0,sqrt(2), 2*numN + 1);
yy = -sqrt(2)/numN./2.*mod(0:2*numN, 2);
plot(xx,yy, 'Color','k', 'LineWidth',4)
plot([0,sqrt(2)/2].*numA./numN - .15/numN, [0,sqrt(2)/2].*numA./numN + .15/numN, 'Color',[.8,0,0], 'LineWidth',6)
plot(sqrt(2) - [0,sqrt(2)/2].*numB./numN + .15/numN, [0,sqrt(2)/2].*numB./numN + .15/numN, 'Color',[0,0,.8], 'LineWidth',6)
% 在这里改分类名称
text(sqrt(2)/4.*numA./numN - .5/numN, sqrt(2)/4.*numA./numN + .5/numN, 'A',...
'FontSize',36, 'FontName','Times New Roman','HorizontalAlignment','right')
text(sqrt(2) - sqrt(2)/4.*numB./numN + .5/numN, sqrt(2)/4.*numB./numN + .5/numN, 'B',...
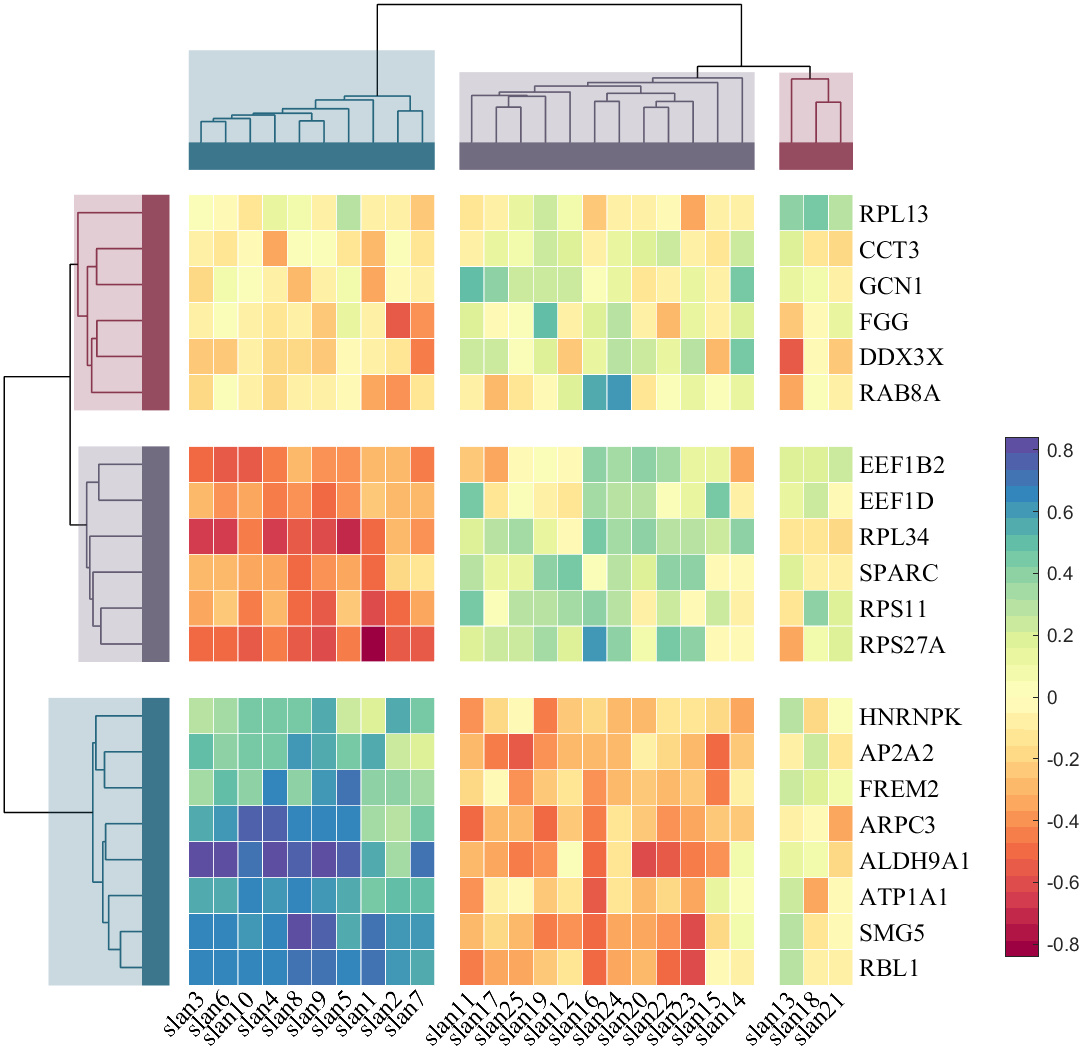
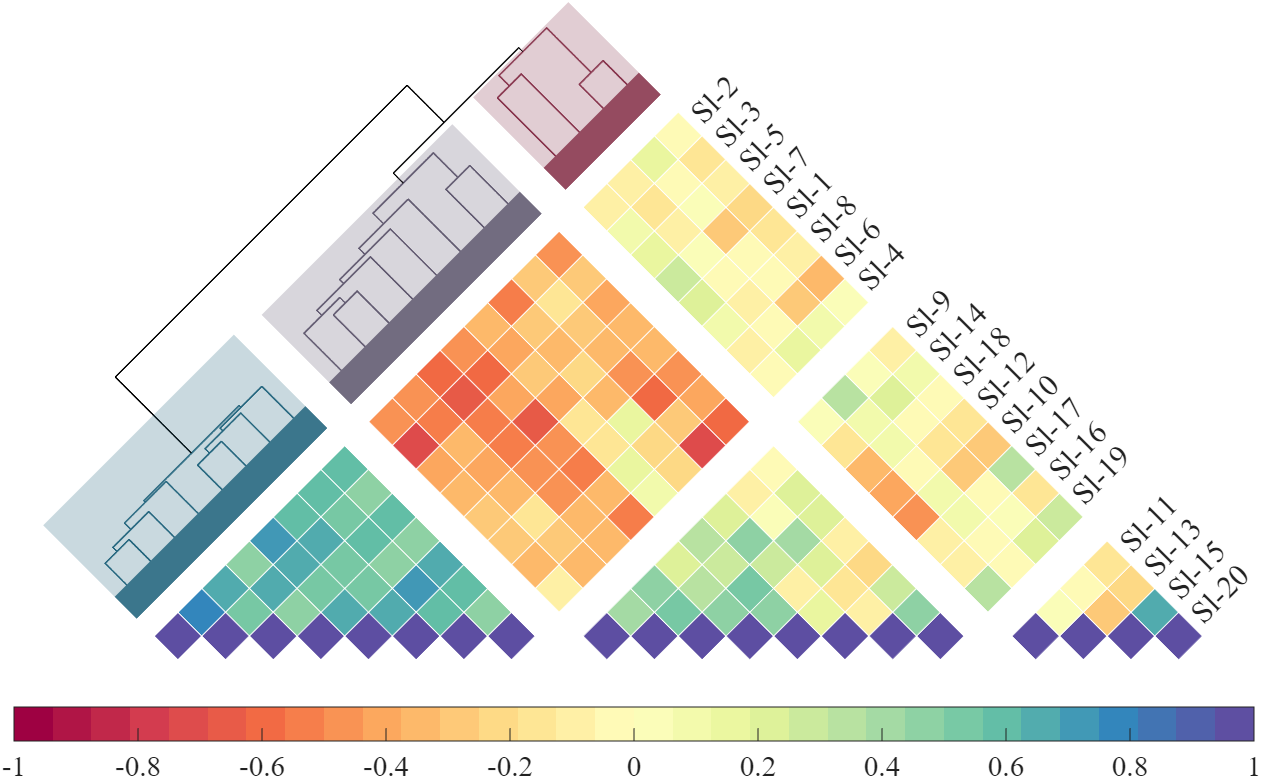
'FontSize',36, 'FontName','Times New Roman')树状图在上方的倒三角热图
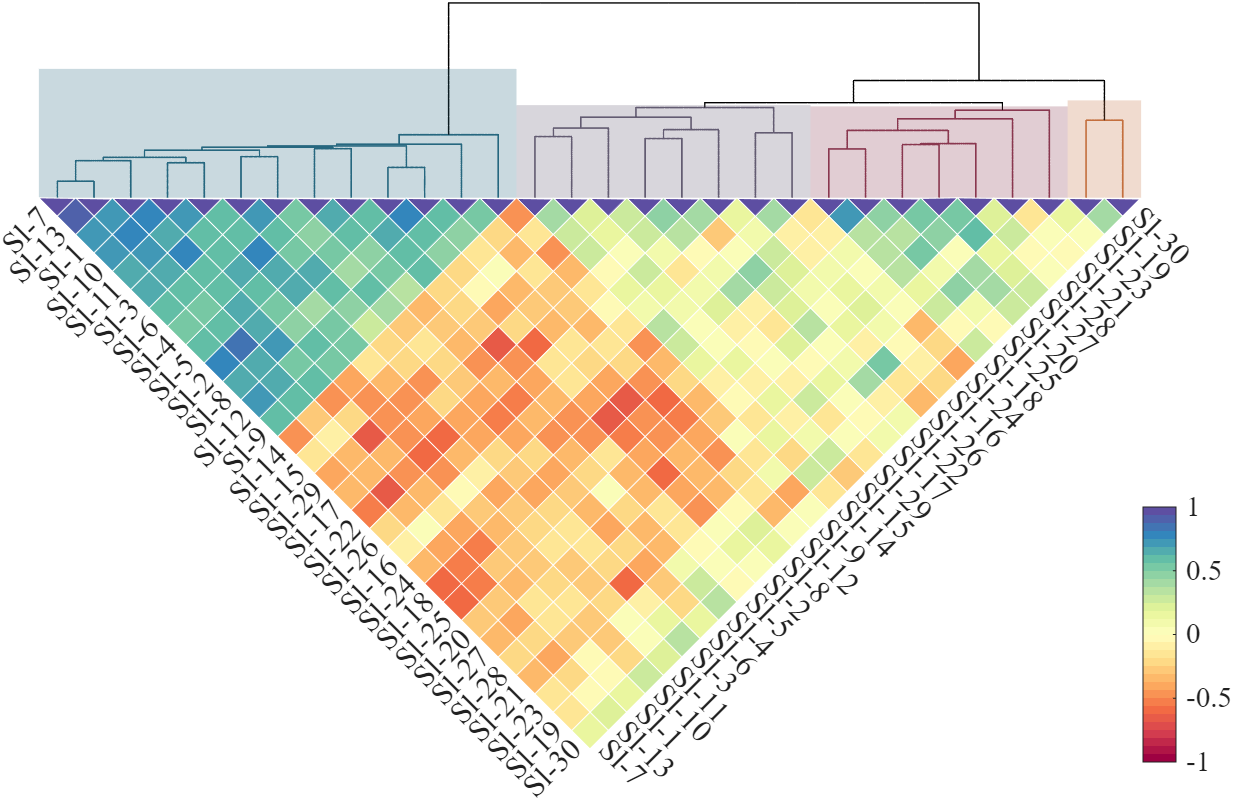
matlab
% 随机生成数据
X=randn(20,30)+[(linspace(-1,2.5,20)').*ones(1,8),(linspace(-3,1,20)').*ones(1,5),(linspace(.5,-.7,20)').*ones(1,10),(linspace(.9,-.2,20)').*ones(1,7)];
Data = corr(X);
% 变量名列表
NameList = compose('Sl-%d',1:30);
% 分类配色 -- Color schemes for each clust
CList = [0.1490    0.4039    0.4980
         0.3882    0.3608    0.4471
         0.5373    0.2157    0.3098
         0.7686    0.4353    0.2431];


% 创建聚类树状图对象 -- create tree(dendrogram) object
% 左侧聚类树状图 -- left Cluster Tree
Z1 = linkage(Data, 'average');
ST = STree(Z1, 'MaxClust', 4); % 聚类数量,如果大于4请给CList多设置几个颜色
ST.Orientation = 'top';
ST.XLim = [0,sqrt(2)];
ST.YLim = [0,.25];
ST.Label = 'off';
ST.BranchColor = 'on';
ST.BranchHighlight = 'on';
ST.RTick = [0,1,1.2,0];
ST.CData = CList;
ST.draw();
%% ========================================================================
% 创建热图对象 -- create heatmap object
SM = SMatrix(Data);
% 添加分组信息 -- Add grouping information
SM.RowName = NameList;
SM.ColName = NameList;
SM.RowOrder = ST.order;
SM.RowClass = ST.class;
SM.ColOrder = ST.order;
SM.ColClass = ST.class;
% 设置文本和字体 -- Set Text and Font
SM.LeftLabel = 'off';
SM.RightLabel = 'on';
SM.BottomLabelFont = {'FontSize', 15, 'FontName', 'Times New Roman', 'Rotation', 45};
SM.RightLabelFont = {'FontSize', 15, 'FontName', 'Times New Roman'};
% 设置位置 -- set position
SM.XLim = [0,1];
SM.YLim = [0,1];
SM.TLim = [-pi/4,-pi/4];
SM.draw()
%% ========================================================================
% 修饰句柄 -- decorate handles
% 清除热图上半部分 -- Clear the bottom half of the heatmap
tData = tril(ones(size(Data)),-1);
tInd = find(tData(:) == 1);
for i = 1:length(tInd)
    set(SM.heatmapHdl{tInd(i)}, 'Visible', 'off')
end
tData = eye(size(Data));
tInd = find(tData(:) == 1);
for i = 1:length(tInd)
    SM.heatmapHdl{tInd(i)}.XData(SM.heatmapHdl{tInd(i)}.YData > 0) = [];
    SM.heatmapHdl{tInd(i)}.YData(SM.heatmapHdl{tInd(i)}.YData > 0) = [];
end
% 修饰坐标区域 -- decorate axes
set(gca, 'XColor', 'none', 'YColor', 'none',...
    'DataAspectRatio', [1,1,1],'XLim', [-.15,1.5], 'YLim', [-1.45/2, .26]);
CB = colorbar();
set(CB,'FontName','Times New Roman','FontSize',14);
CB.Position(4) = CB.Position(4)/3;
完
以上已经绘图部分代码,工具和绘图部分完整代码可在下方gitee仓库复刻二十二部分找到: