一、Basic plotting
1.plot()
plot(x,y) :x图片中点的横坐标,y图片中点的纵坐标
plot(y) :y图片中点的纵坐标,x图片中点的横坐标默认为1,2,3,4,5........
Matlab
plot(cos(0:pi/20:2*pi))y ---纵坐标的范围是0~2,每个间隔
/ 20
2. hold on / off
① 无 hold on / off
Matlab
plot(cos(0:pi/20:2*pi));
plot(sin(0:pi/20:2*pi));只画,不画
,因为
将
的图片覆盖
② 有 hold on / off
Matlab
hold on
plot(cos(0:pi/20:2*pi));
plot(sin(0:pi/20:2*pi));
hold off
和
的图像叠加
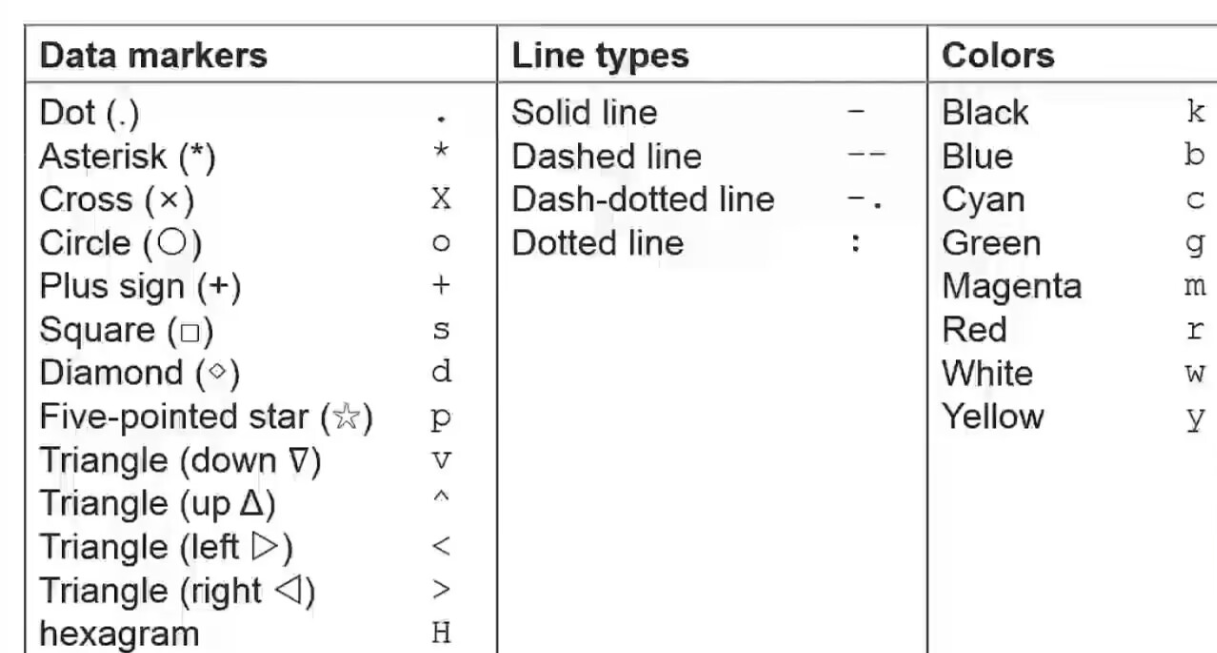
3. Plot Style
plot(x,y, ' str ')
Matlab
hold on
plot(cos(0:pi/20:2*pi),'or--');
plot(sin(0:pi/20:2*pi),'xg:');
hold off
str 可以是以下三种类型,' str '里面填写每列右边一列
linsepec()可以查找更多
4. legend()
Matlab
hold on
x = 0:0.5:4*pi;
y = sin(x); h = cos(x); w = 1./(1+exp(-x));
g = (1/(2*pi*2)^0.5).*exp((-1.*(x-2*pi).^2)./(2*2^2));
plot(x,y,'or--',x,h,'xg:',x,w,'bd-',x,g,'c^-');
% plot(cos(0:pi/20:2*pi),'or--');
% plot(sin(0:pi/20:2*pi),'xg:');
% 上面两条线可以联合写成下面这种形式
% plot(x,cos(0:pi/20:2*pi),'or--',x,sin(0:pi/20:2*pi),'xg:');
legend('sin(x)','cos(x)','Sigmoid','Gauss function');
hold off
5. title()and ?label()
title()、xlabel()、ylabel()、zlabel()
Matlab
hold on
x = 0:0.5:4*pi;
y = sin(x); h = exp(-x);
plot(x,y,'or--',x,h,'xg:');
% plot(cos(0:pi/20:2*pi),'or--');
% plot(sin(0:pi/20:2*pi),'xg:');
% 上面两条线可以联合写成下面这种形式
% plot(x,cos(0:pi/20:2*pi),'or--',x,sin(0:pi/20:2*pi),'xg:');
title('Fuction Plots of sin(t) and e^{-x}');
xlabel('x =  0 to 4\pi');
ylabel('value of sin(x) and e^{-x}');
legend('sin(x)','e^{-x}');
hold off
在 图片x轴,y轴和标题上显示公式时需要 LaTex 语言
6. text()and annotation()
① line( 2,2 , 0,2\^2\^sin(2) )
两点确定一条直线, 2 , 2 两点的横坐标, 0 , 2\^2\^sin(2) 两点的纵坐标
② text(0.25,2.5,str,'Interpreter','latex');
图片中显示的标题使用LaTex语言
③ annotation('arrow','X',0.32,0.5,'Y',0.6,0.4);
添加箭头,箭头的两个点横坐标分别占图幅的0.32和0.5,纵坐标分别占图幅的0.6和0.4
Matlab
x = linspace(0,3);
y = x.^ 2.* sin(x);
plot(x,y);
line([2,2],[0,2^2*sin(2)]);
str = '$$ \int_{0}^{2} x^2\sin{x} dx $$';
text(0.25,2.5,str,'Interpreter','latex');
annotation('arrow','X',[0.32,0.5],'Y',[0.6,0.4]);
7. Fiegure Adjustment
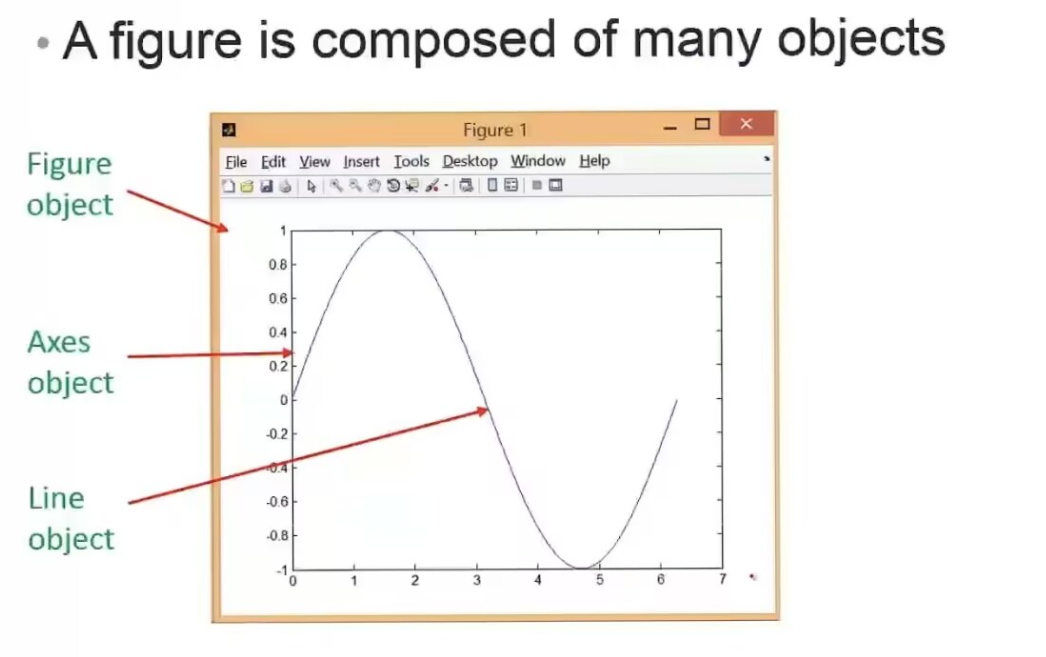 set( gcf,' Color ',1,1,1 )
gcf 是 Figure object 的句柄,设置Figure object 的颜色为黑色:'Color',1,1,1
Matlab
x = linspace(0,2*pi,1000);
y = sin(x);
plot(x,y);
set(gcf,'Color',[1,1,1]);
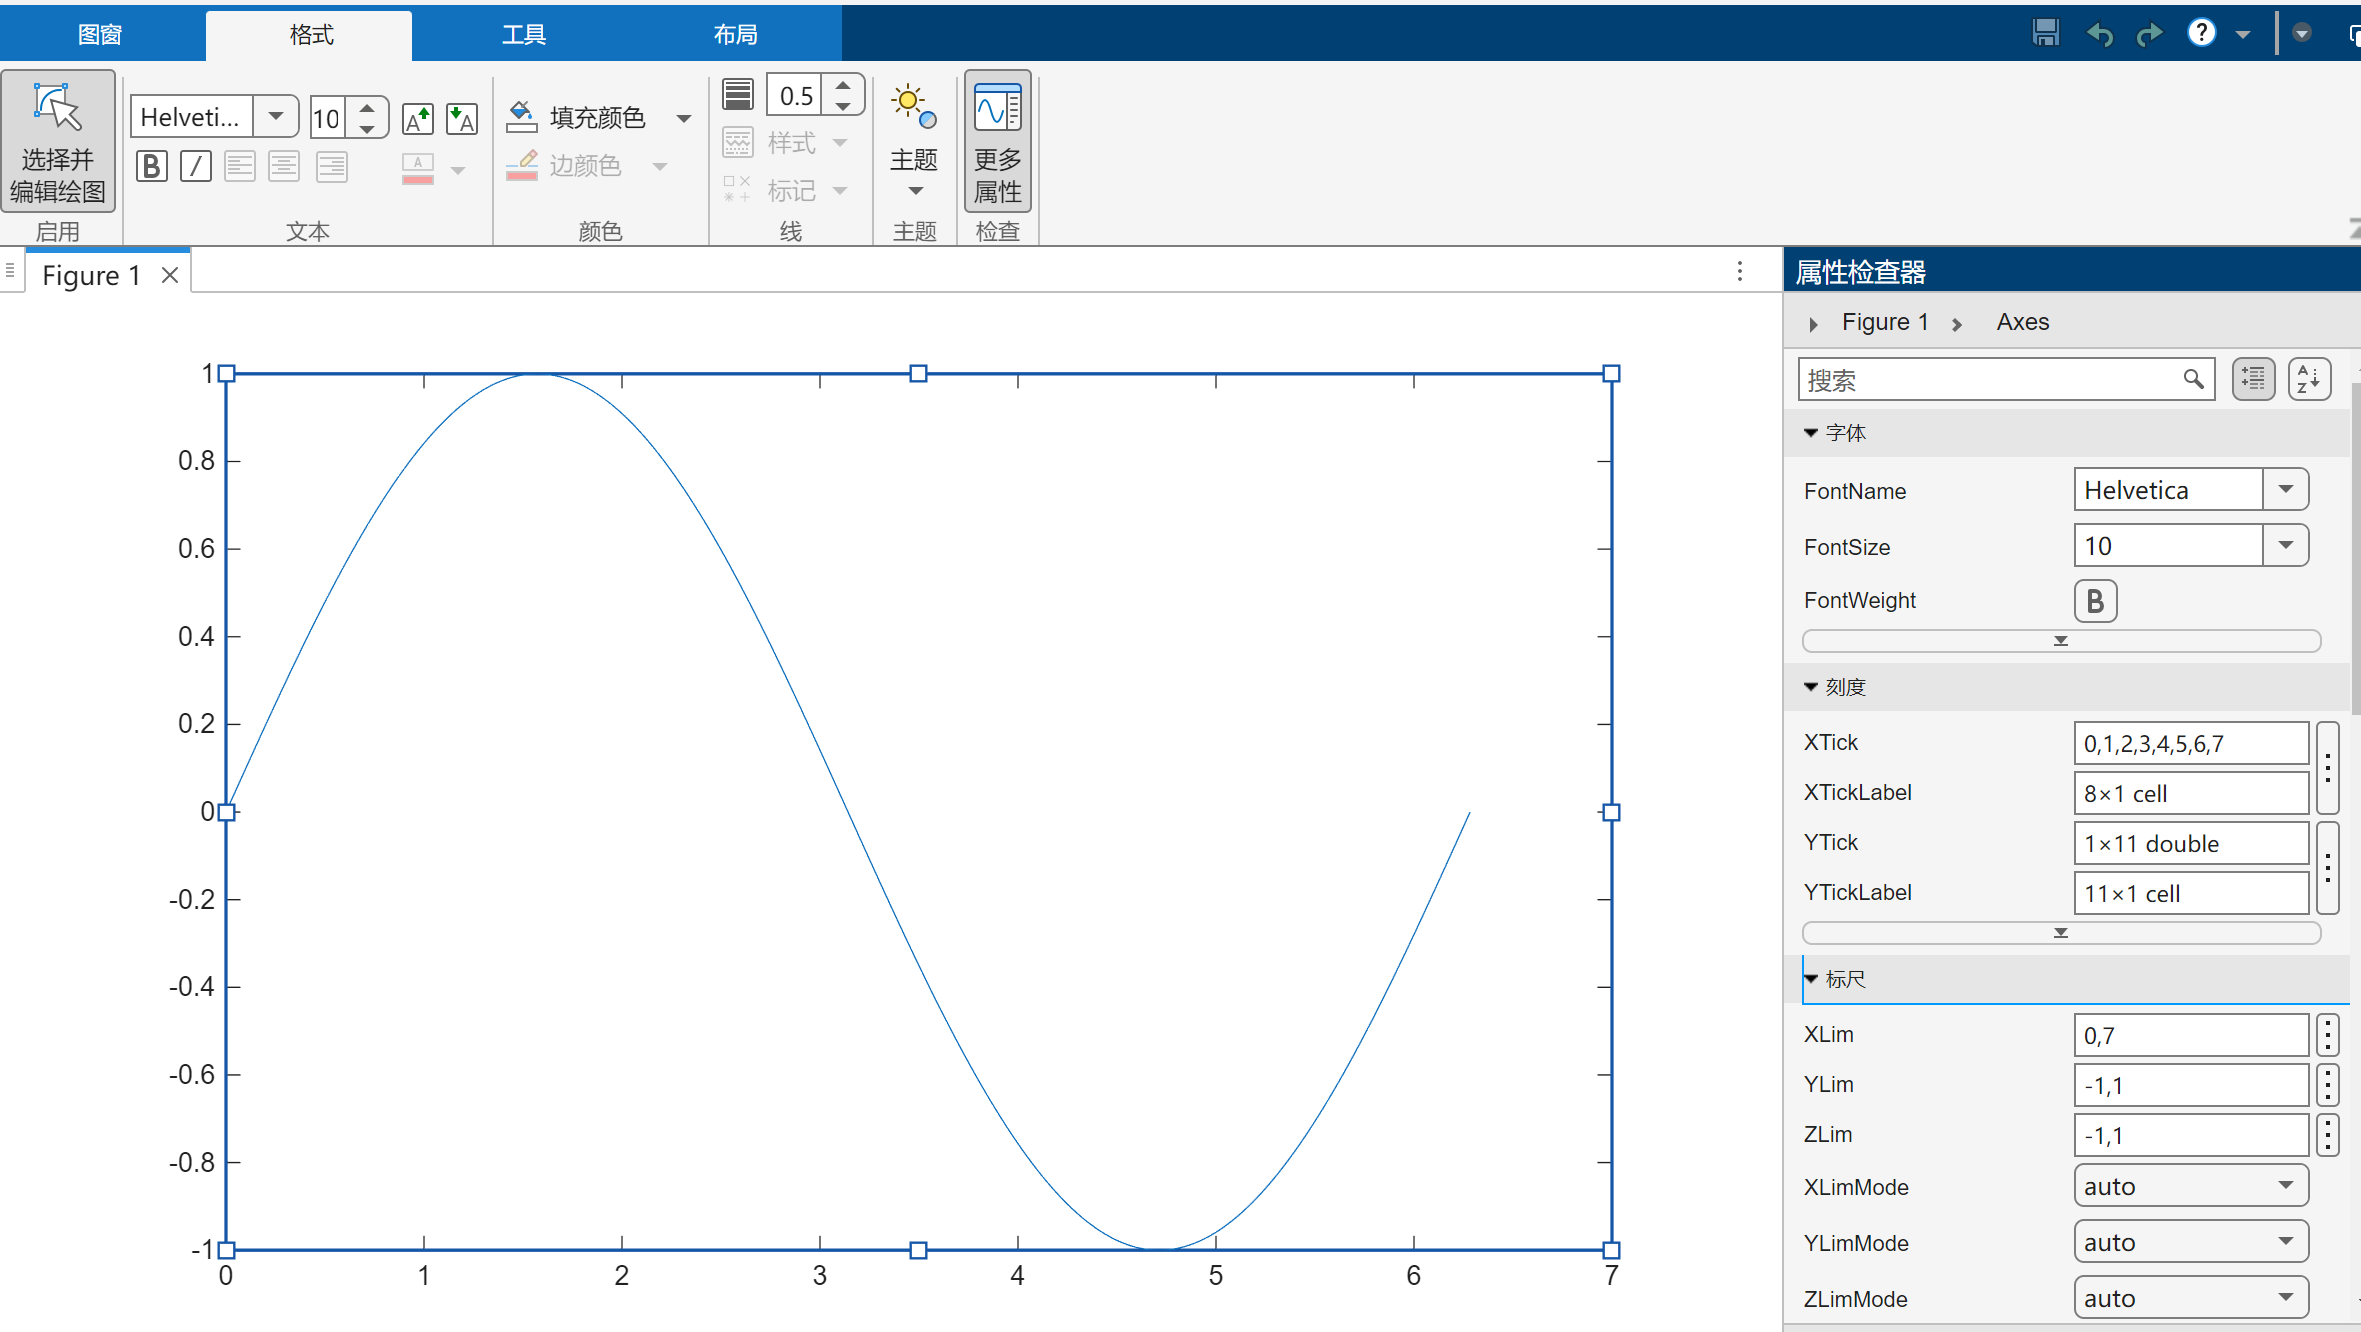
8. Figure Properties
9. Handle of An Object
figure 的句柄是关键字 gcf ,Axes 的句柄是 gca,
获得Line句柄的语句是 h = plot(x,y);
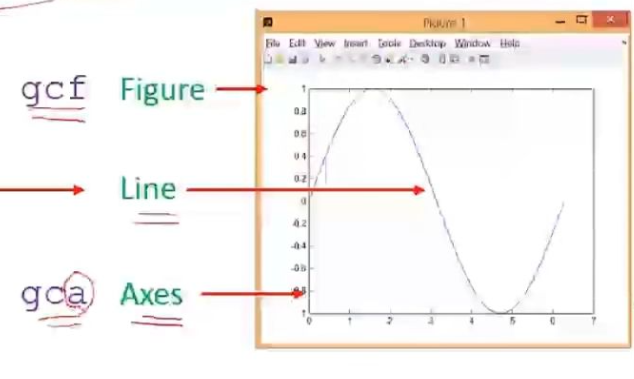
其他句柄列表如下
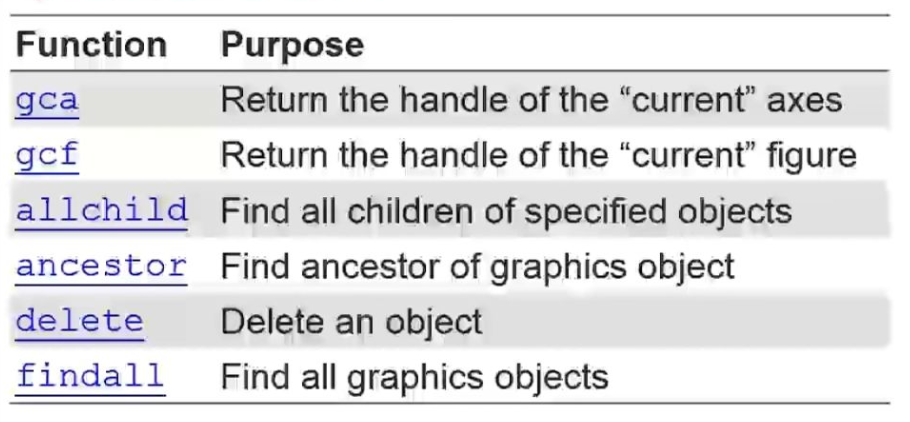
10. Fetching and Modifying Properties
得到设置属性get()和设置属性set()
Matlab
x = linspace(0,2*pi,1000);
y = sin(x);
h = plot(x,y);
get(h)  #得到Line(h)的句柄,可通过查看变量h来看
set(gcf,'Color',[1,1,1]);
二、Getting Object Properties
get(gca);get(gcf);h = plot(x,y),get(h)
1. Setting Axes Limits
Matlab
set(gca,'XLim',[0,2*pi]);
set(gca,'YLim',[-1.2,1.2]);
XLim设置的是 x 轴的范围 0 ~ 2,YLim设置的是 y 轴的范围 -1.2 ~ 1.2
或者也可以用下面这种写法
Matlab
xlim([0,2*pi]);
ylim([-1.2,1.2]);
2. Setting Font and Tick of Axes
Matlab
x = linspace(0,2*pi,1000);
y = sin(x);
h = plot(x,y);
get(h)
set(gcf,'Color',[1,1,1]);
set(gca,'XLim',[0,2*pi]);
set(gca,'YLim',[-1.2,1.2]);
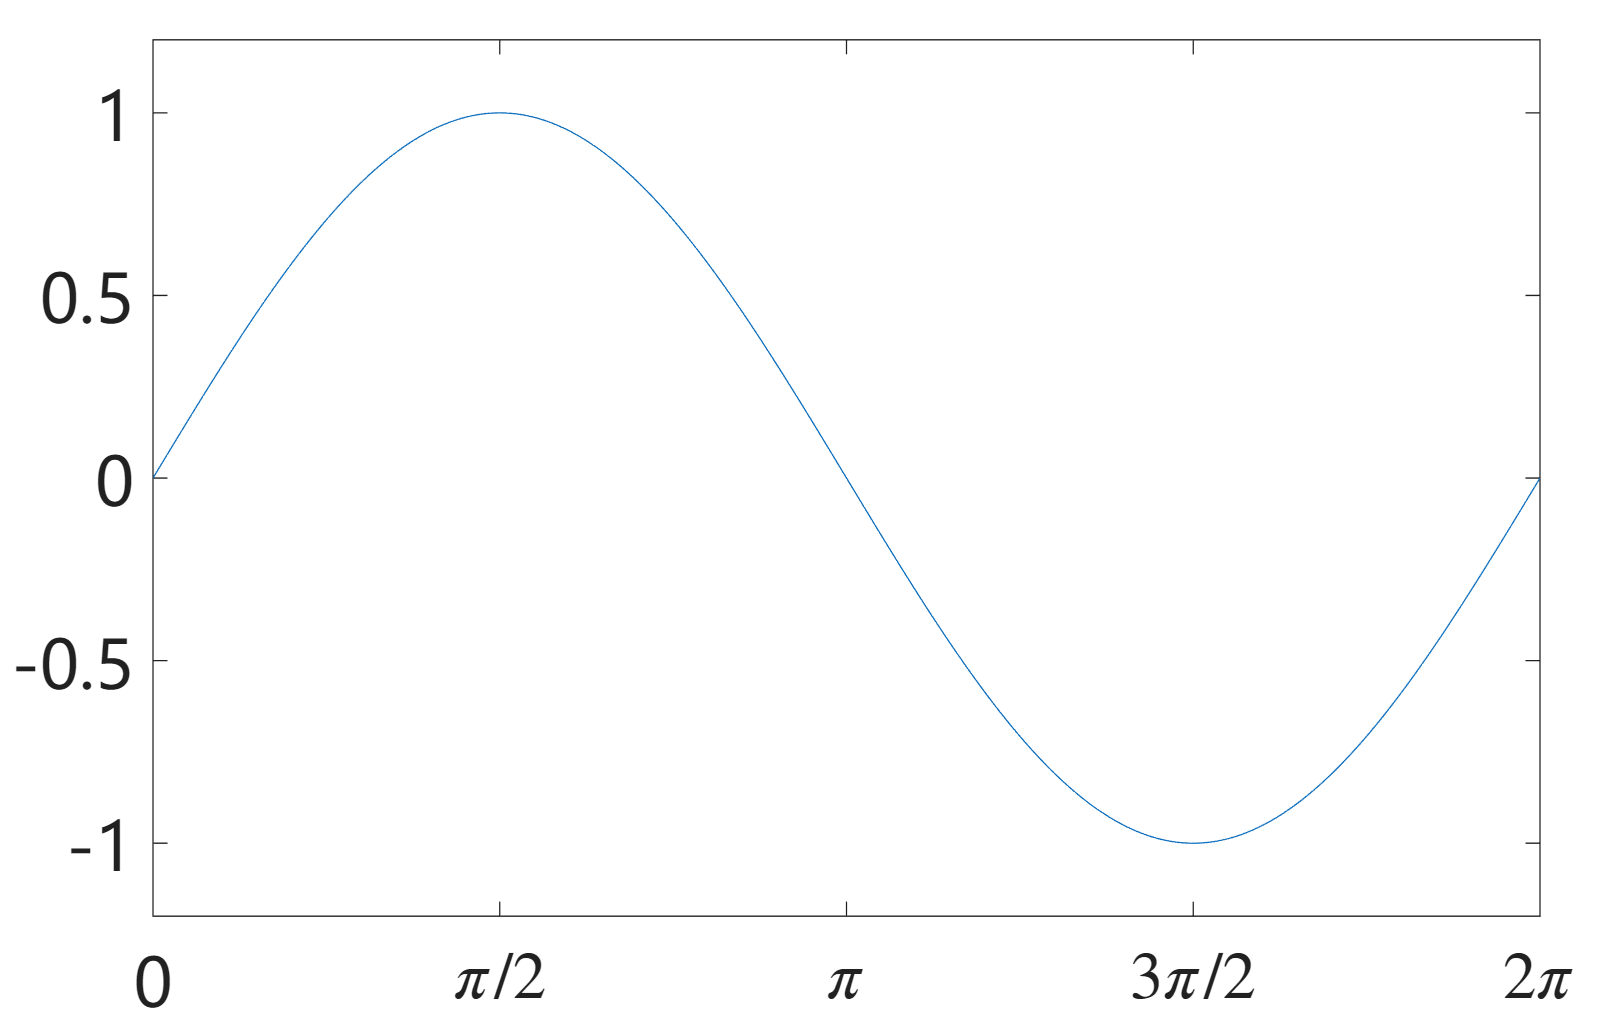
set(gca,'FontSize',25);
set(gca,'XTick',0:pi/2:2*pi);
set(gca,'XTickLabel',0:90:360);
set(gca,'FontName','Latex');
set(gca,'XTickLabel',{'0','\pi/2','\pi','3\pi/2','2\pi'});
set(gca,'FontSize',25); 设置坐标轴字体大小为25
set(gca,'XTick',0:pi/2:2*pi); 设置坐标轴范围是0~2,间隔是
/2.
set(gca,'XTickLabel',0:90:360); 设置坐标轴等间隔下的表示数字
set(gca,'FontName','Latex'); 设置坐标轴字体格式是Latex语言
set(gca,'XTickLabel',{'0','\pi/2','\pi','3\pi/2','2\pi'}); 设置坐标轴输出内容 0 ~ 2
3. Line Specification
Matlab
x = linspace(0,2*pi,1000);
y = sin(x);
h = plot(x,y);
get(h)
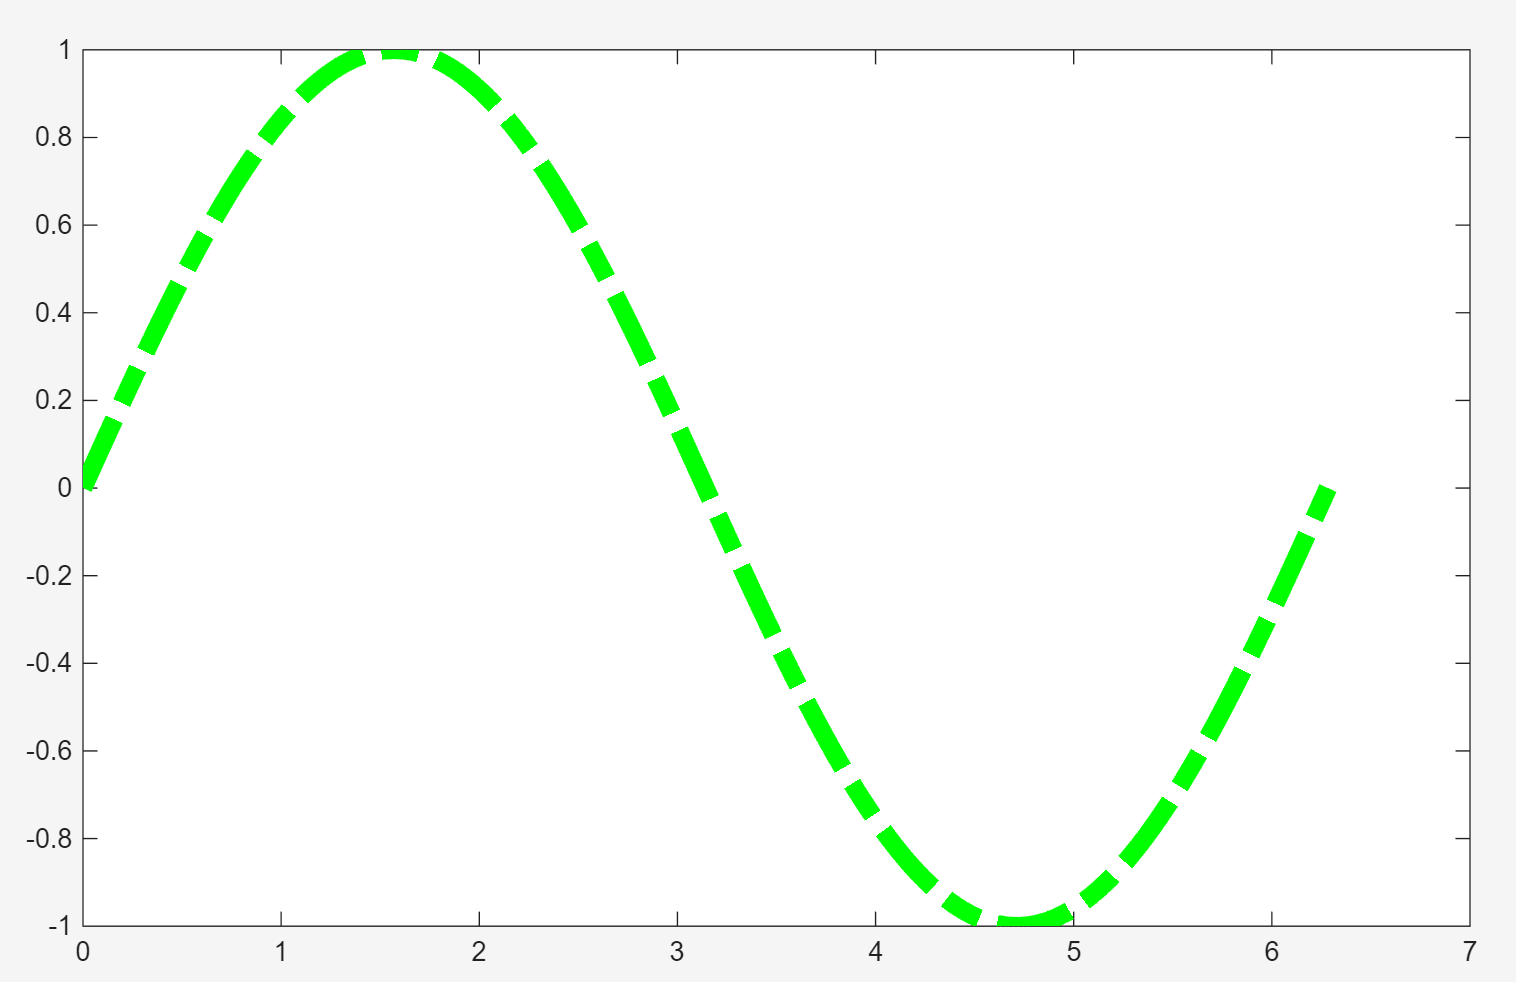
set(h,'LineStyle','-.', ...
    'LineWidth',7.0,'Color','g');
set(h,'LineStyle','-.', 'LineWidth',7.0,'Color','g');
设置LineStyle是:' -. ' 虚实线
设置LineWidth是:0.7,虚实线的粗细是0.7
设置Color虚实线的颜色是:绿色
4. Maker Sepecifiction
坐标轴下面的字体大小 FontSize设置为18;
线宽LineWidth是2,图形标记边缘颜色MarkerEdgeColor是黑色,图形标记内部颜色MarkerFaceColor是绿色,图形标记MarkerSize的大小是10。
Matlab
x = rand(20,1);
set(gca,'FontSize',18);
plot(x,'-md','LineWidth',2,'MarkerEdgeColor','k','MarkerFaceColor','g','MarkerSize',10);
xlim([1,20]);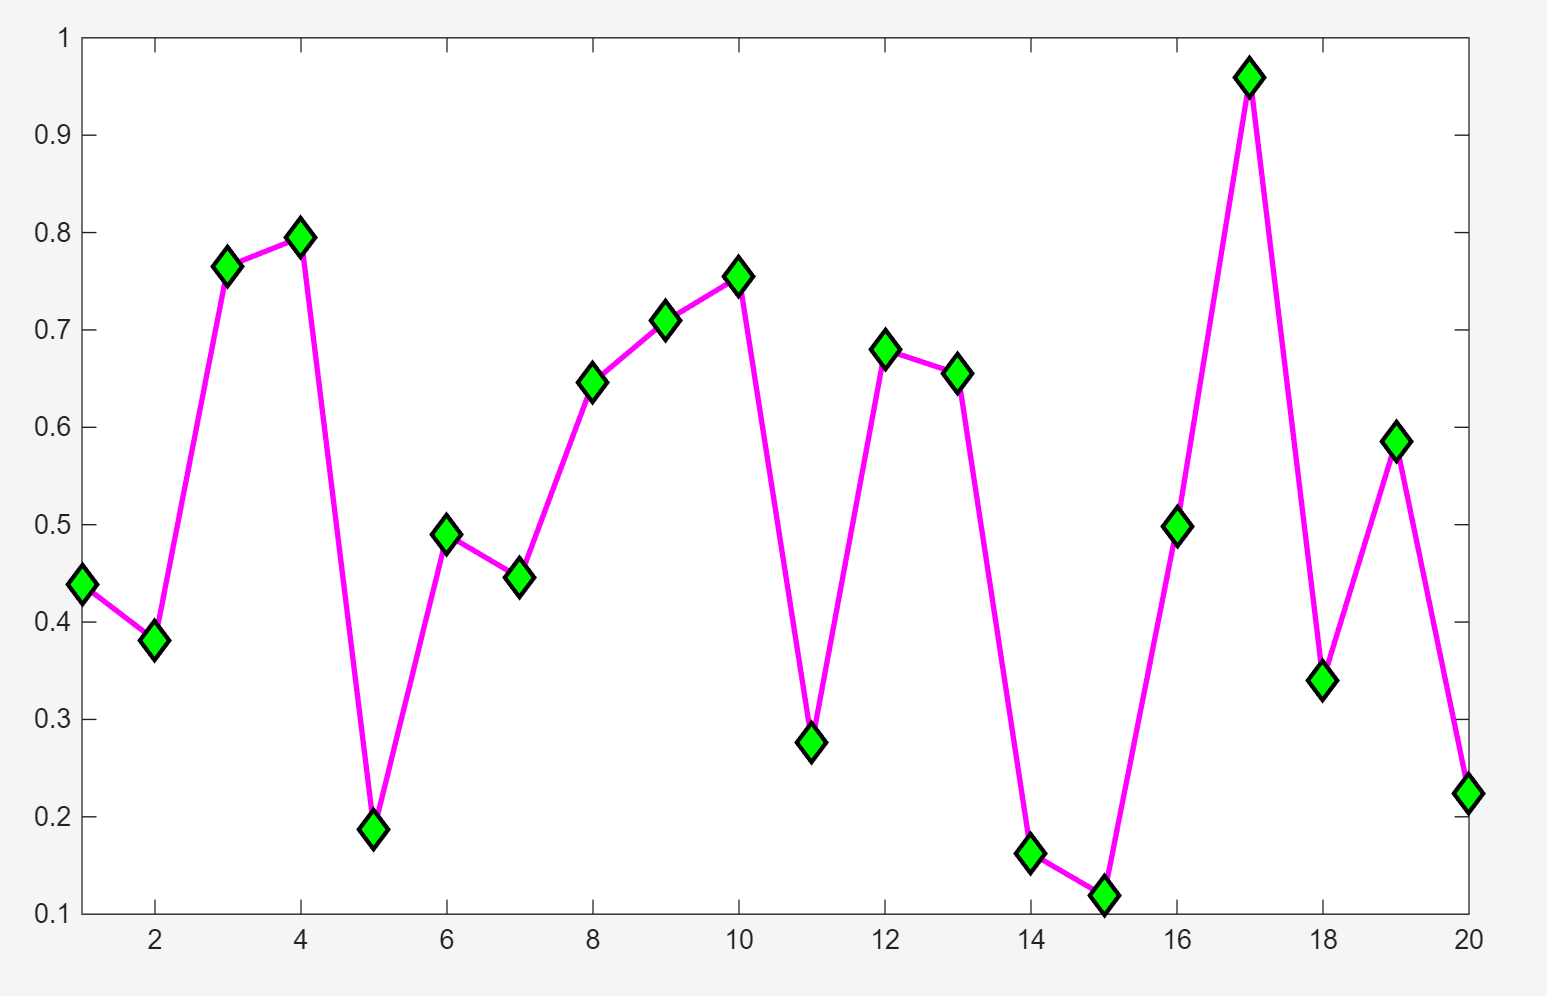
practise
Matlab
hold on
x = linspace(1,2);
f = x .* x;
g = sin(2 * pi .* x);
plot(x,f,'-k','LineWidth',2);
plot(x,g,'or','MarkerFaceColor','m');
xlabel('Time(ms)');
ylabel('f(t)');
title('Mini Assignment #1');
legend('t^{2}','sin(2\pit)');
hold off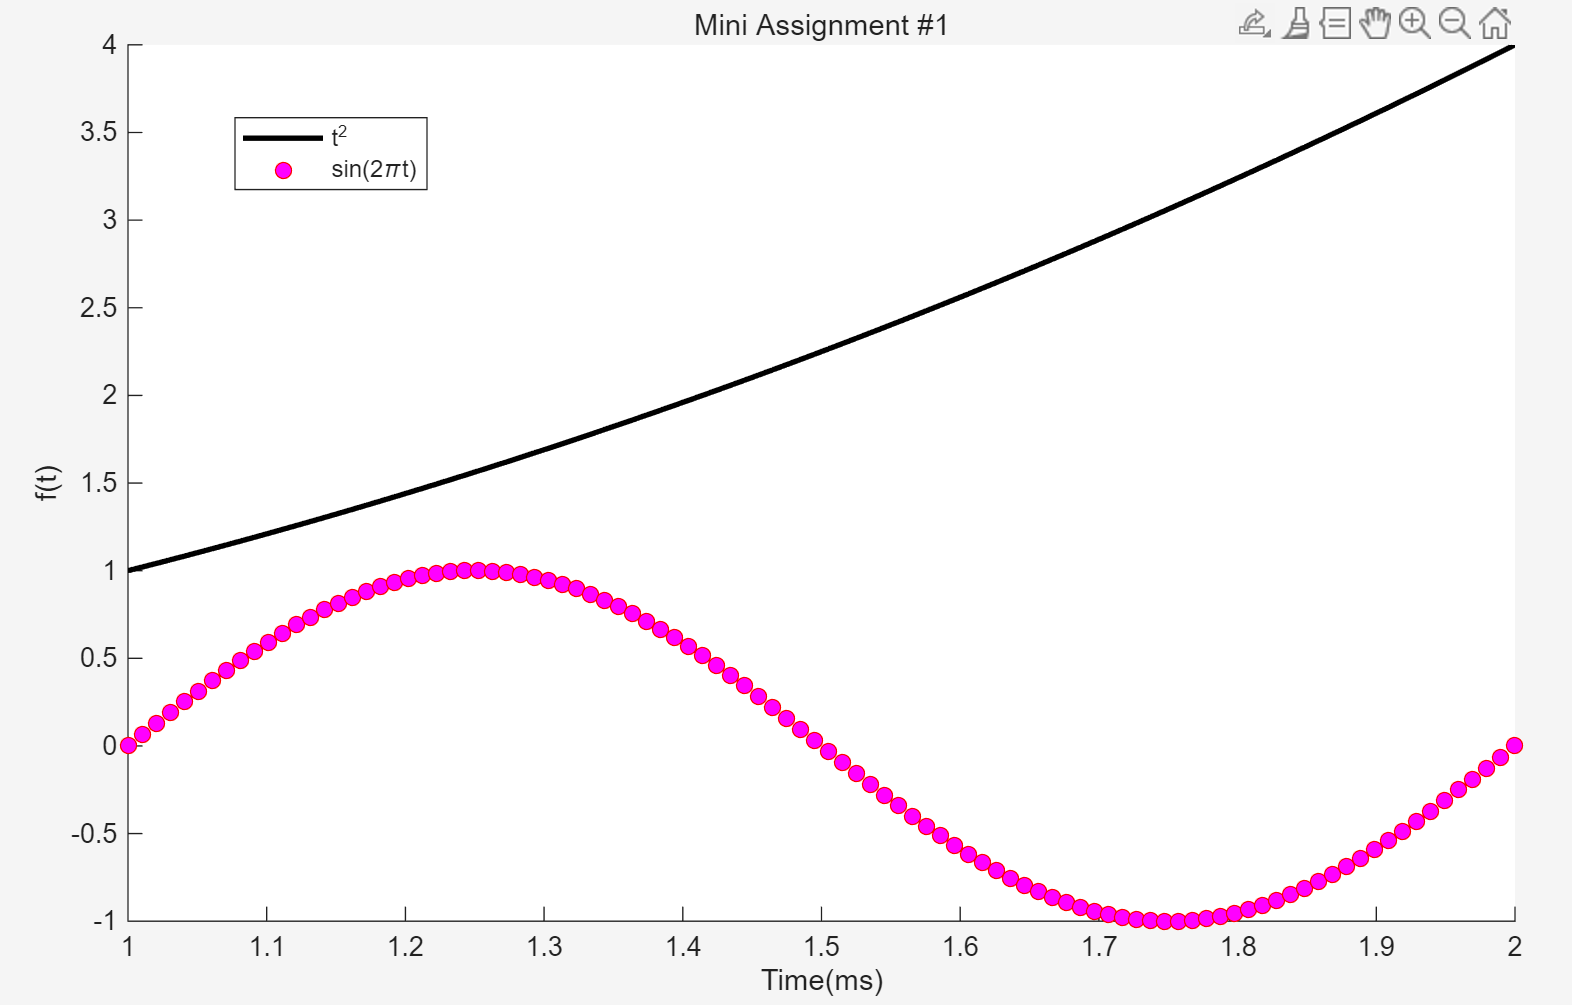
5. Multiple Figures
figure,plot(x,y1); 画图,该语句需要使用两次,以免新画的图覆盖原来画的图
Matlab
x = -10:0.1:10;
y1 =  x .* 2 -8;
y2 = exp(x);
figure,plot(x,y1);
figure,plot(x,y2);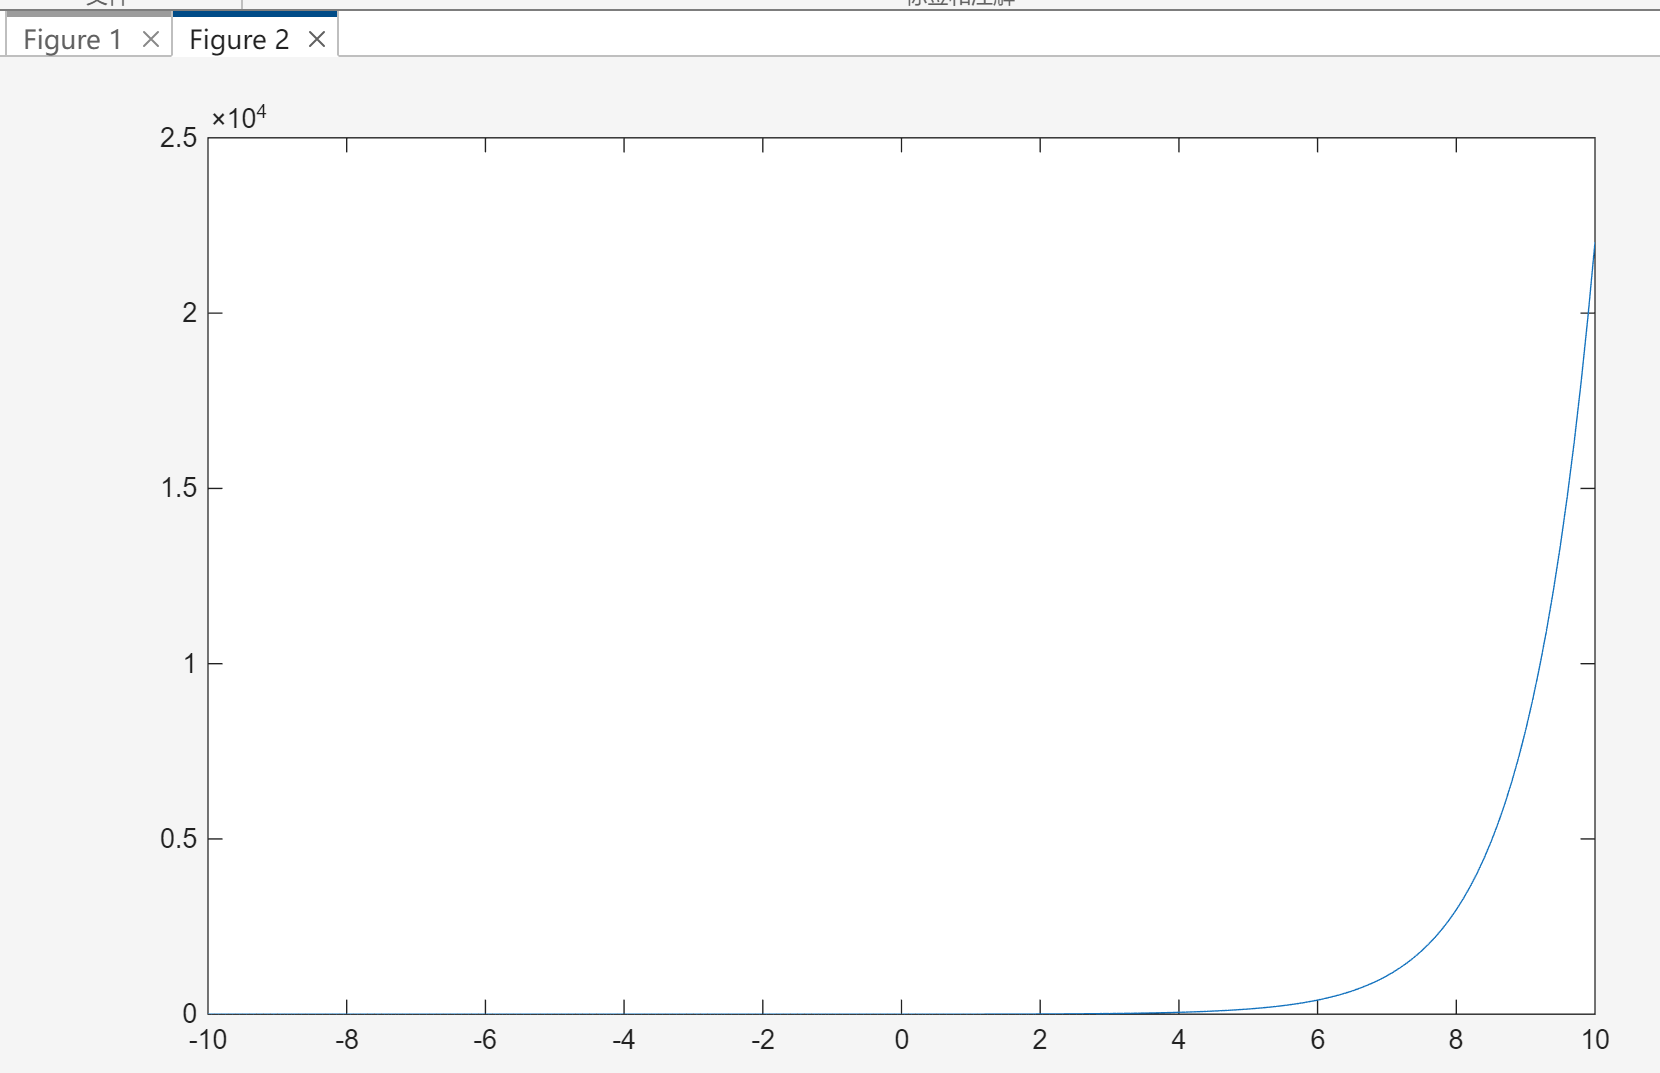
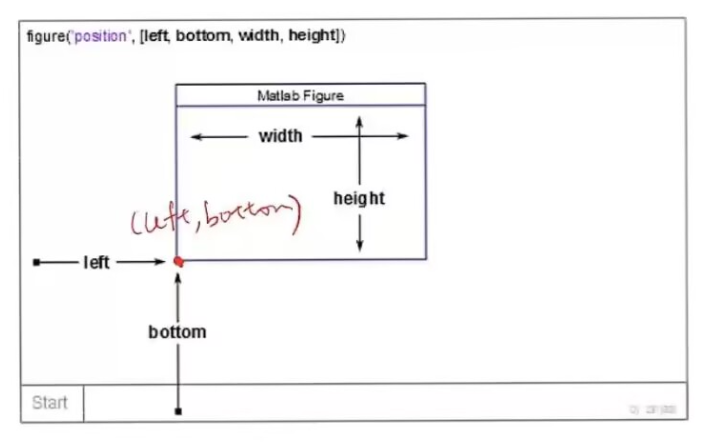
6. Figure Position and Size
figure(' Position ', left,bottom,width,height );
7. Several Plots in One Figure
subplot(m,n,1);
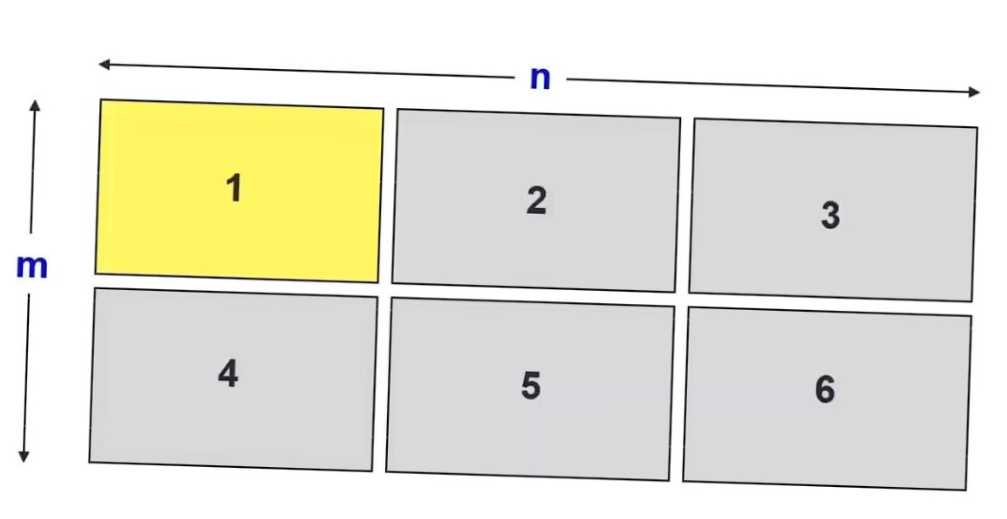
8. subplot()
Matlab
t = 0:0.1:2*pi;
x = 3*cos(t);
y = sin(t);
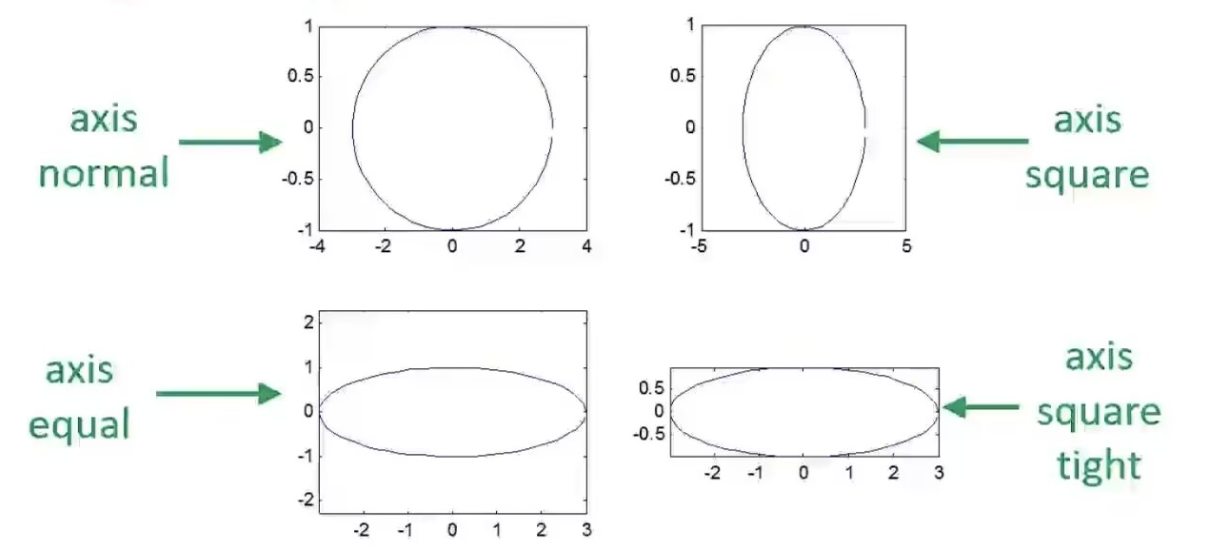
subplot(2,2,1);plot(x,y);axis normal;
subplot(2,2,2);plot(x,y);axis square;
subplot(2,2,3);plot(x,y);axis equal;
subplot(2,2,4);plot(x,y);axis equal tight;
nomal 横纵坐标轴的比例恢复默认的自动调整模式
square 画出来的图片是方形的;
equal 画出来的图片横纵坐标比例是一样的;
equal tight 画出来的图片是横纵比例一样,且无多余留白的;
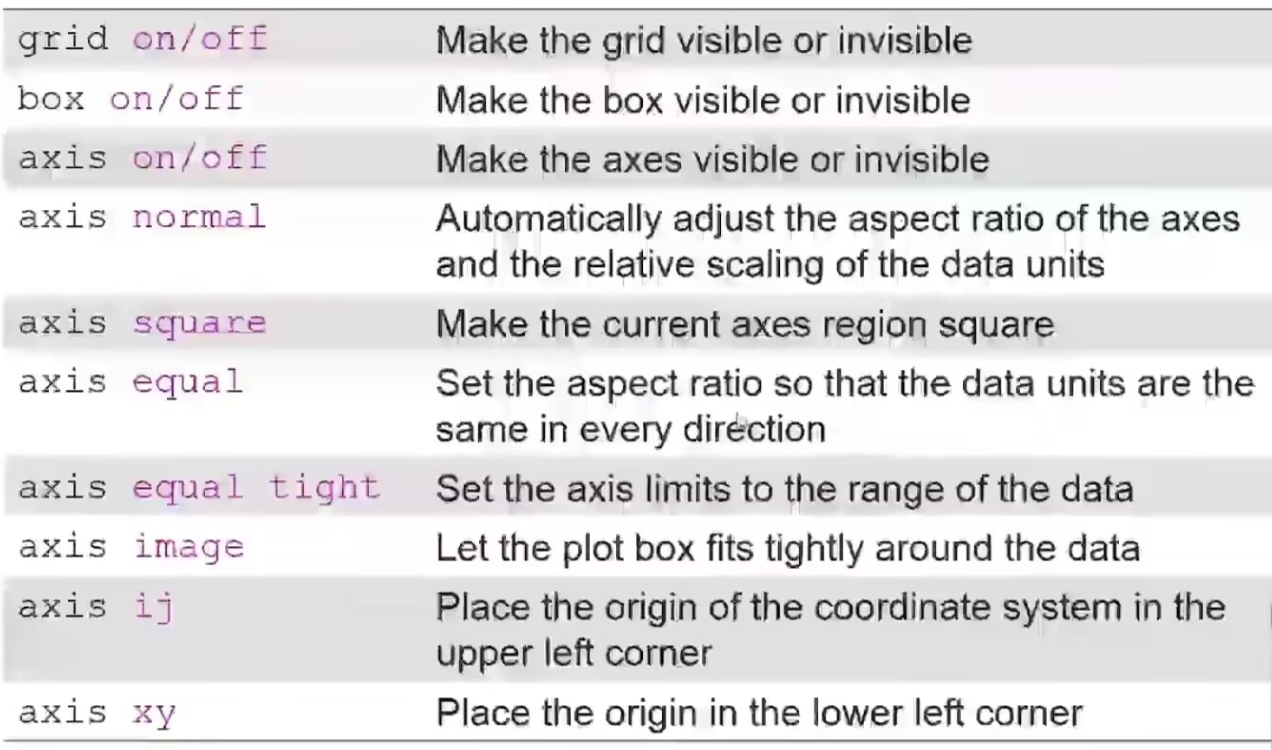
9. Control of Grid,Box,and Axis
grid on/off 画图背景是否有表格
box on/off 画图背景图片是否有边框
axis on/off 画图背景是否有坐标轴
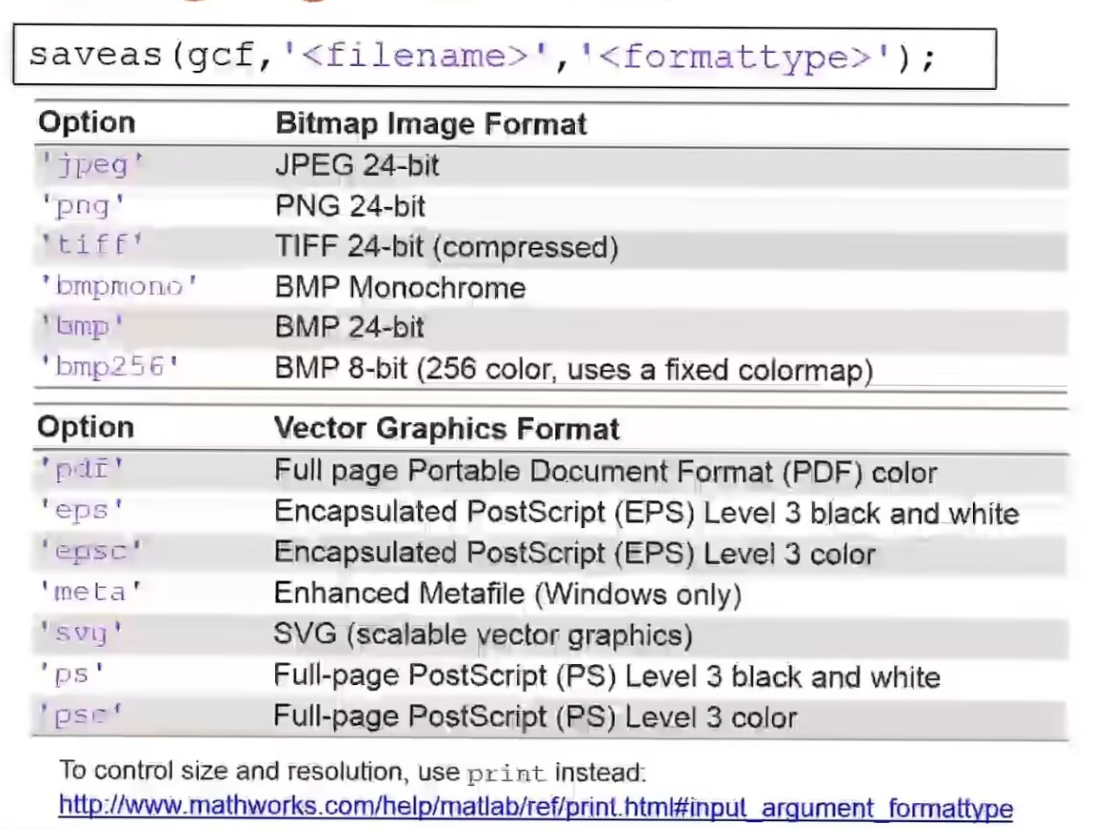
10. saving Figure into Files
Matlab
saveas(gcf,'filename','jgp')