使用Python,OpenCV计算跑图的图像彩色度
这篇博客将介绍如何计算跑图里最鲜艳的top25图片和最灰暗的top25图片并显示色彩彩色度值展示。
效果图
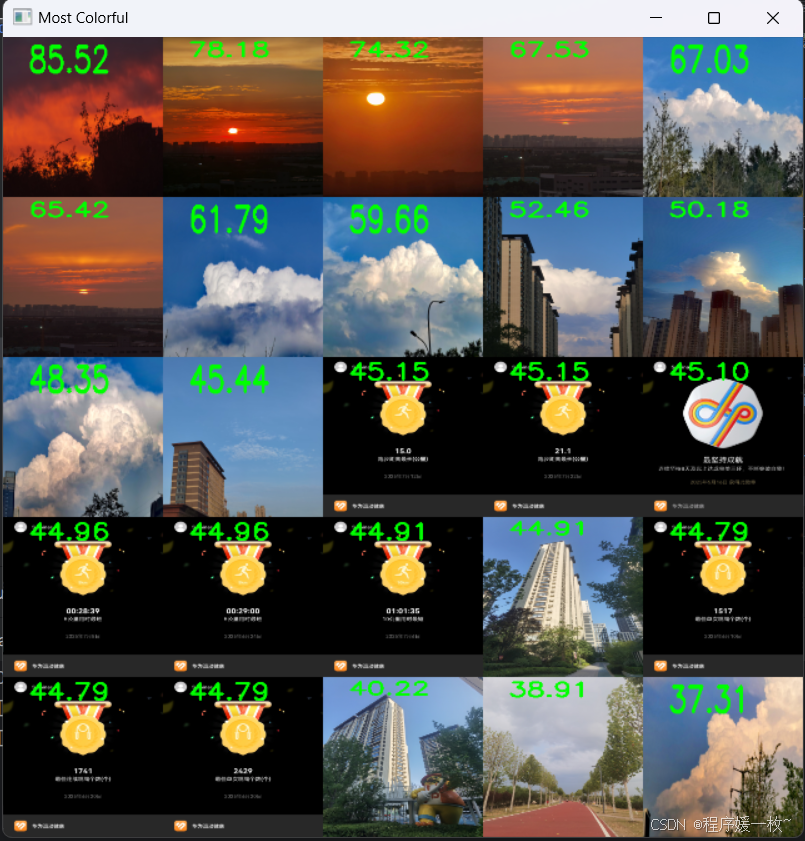
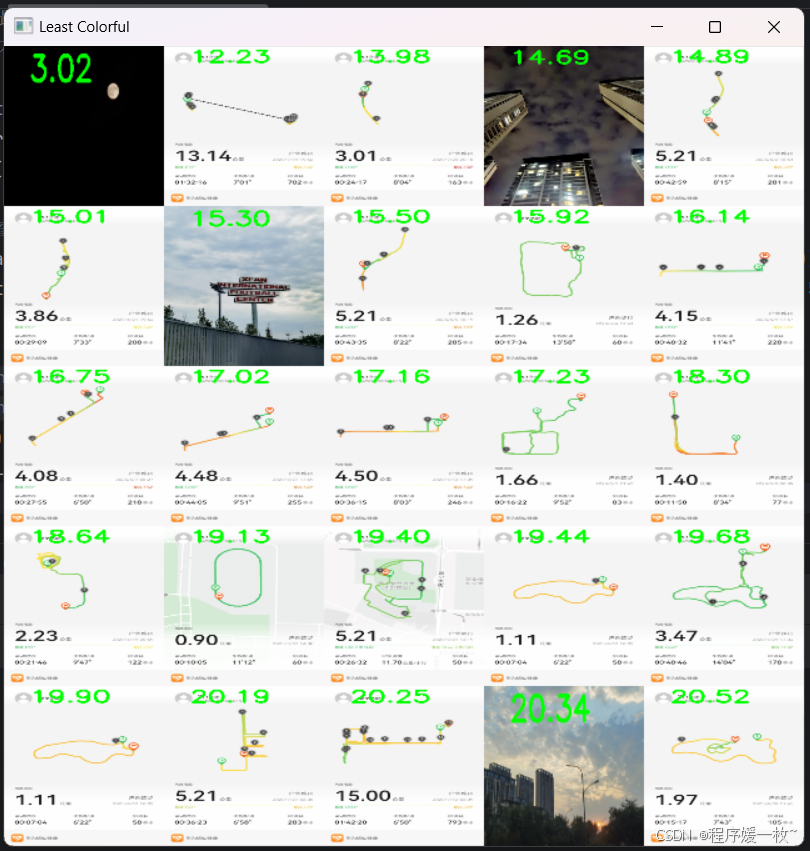
以下分别是最鲜艳top25和最灰暗top25对比效果图:
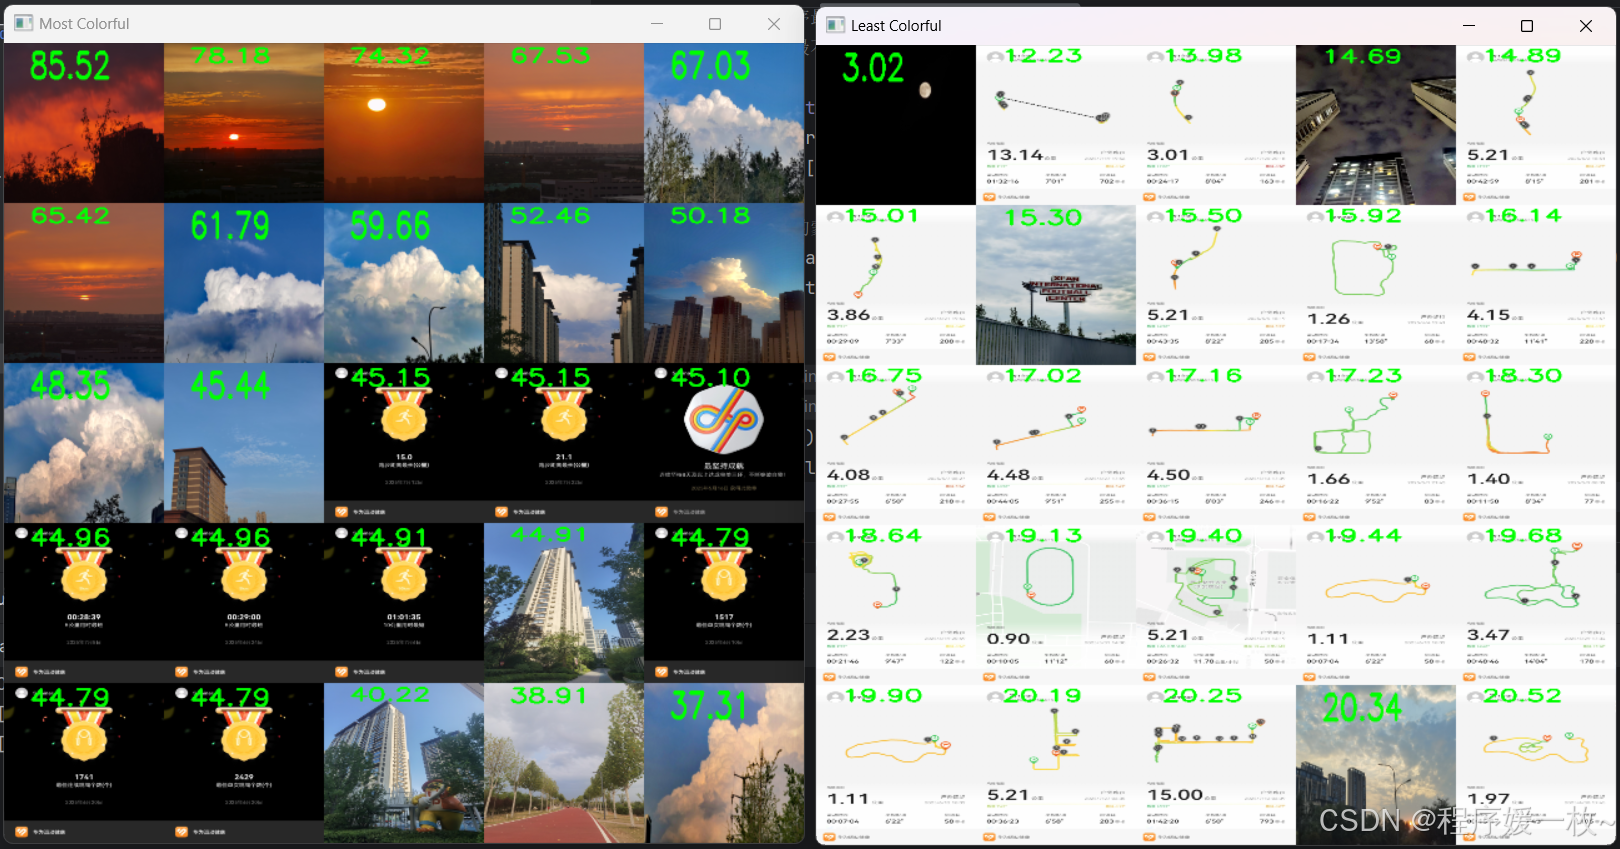
最鲜艳top25效果图:
最灰暗top25效果图如下:
源码见如下链接
https://blog.csdn.net/qq_40985985/article/details/115014533
python
# USAGE
# python colorfulness.py --images E:\personal\images

# 导入必要的包
from imutils import build_montages
from imutils import paths
import numpy as np
import argparse
import imutils
import cv2


# 图像彩色度计算方法
def image_colorfulness(image):
    # 分离照片为三通道RGB值
    (B, G, R) = cv2.split(image.astype("float"))

    # 计算 rg = R - G 红绿对手颜色空间
    rg = np.absolute(R - G)

    # 计算 yb = 0.5 * (R + G) - B  黄蓝对手颜色空间
    yb = np.absolute(0.5 * (R + G) - B)

    # 计算`rg` and `yb` 的标准方差和均值
    (rgMean, rgStd) = (np.mean(rg), np.std(rg))
    (ybMean, ybStd) = (np.mean(yb), np.std(yb))

    # 将标准方差和均值合并
    stdRoot = np.sqrt((rgStd ** 2) + (ybStd ** 2))
    meanRoot = np.sqrt((rgMean ** 2) + (ybMean ** 2))

    # 获得图像彩色度量值,并返回
    return stdRoot + (0.3 * meanRoot)


# 构建命令行参数,并解析
# --image 输入图片文件夹路径
ap = argparse.ArgumentParser()
ap.add_argument("-i", "--images", required=False,default='bm_sports/sports/',
                help="path to input directory of images")
args = vars(ap.parse_args())

# 初始化结果list
print("[INFO] computing colorfulness metric for dataset...")
# 通常情况下存储图像id:图像炫彩度量值,在这里介于图像数据量小且为了后续展示方便,存储图像:图像炫彩度量值
results = []

# 遍历图片路径
for imagePath in paths.list_images(args["images"]):
    # 加载图像,保持宽高比的缩放以加快处理速度,计算图像彩色度度量
    image = cv2.imread(imagePath)
    image = imutils.resize(image, width=250)
    C = image_colorfulness(image)

    # 显示图像的彩色度分数
    cv2.putText(image, "{:.2f}".format(C), (40, 40),
                cv2.FONT_HERSHEY_SIMPLEX, 1.4, (0, 255, 0), 3)

    # 添加图像的炫彩度量到结果list
    results.append((image, C))

# 对结果进行排序最炫彩图像靠前;
# 选出最炫彩、最不炫彩的25个图像
print("[INFO] displaying results...")
results = sorted(results, key=lambda x: x[1], reverse=True)
mostColor = [r[0] for r in results[:25]]
leastColor = [r[0] for r in results[-25:]][::-1]

# 构建俩组图像的蒙太奇效果
mostColorMontage = build_montages(mostColor, (128, 128), (5, 5))
leastColorMontage = build_montages(leastColor, (128, 128), (5, 5))

# 显示图像结果
cv2.imshow("Most Colorful", mostColorMontage[0])
cv2.imshow("Least Colorful", leastColorMontage[0])
cv2.waitKey(0)
cv2.destroyAllWindows()