Title
题目
Navigating the landscape of multimodal AI in medicine: A scoping review ontechnical challenges and clinical applications
探索医学领域多模态人工智能的发展图景:技术挑战与临床应用的范围综述
01
文献速递介绍
医疗健康领域正快速发展,这得益于以数据为中心的患者护理和决策方法的兴起(Shilo等人,2020)。这一转变还伴随着数字病理学(Niazi等人,2019)、生物传感器(Sempionatto等人,2022)和下一代测序(Steyaert等人,2023)等技术的出现,这些技术为临床医生在多个领域提供了新的见解。这些不同模态生成的数据通常具有互补性,每种模态都为患者状况提供独特的信息。有些模态能提供宏观层面的全面概述,而另一些则可提供单细胞分辨率的详细信息(Steyaert等人,2023)。除了近年来数据量的增长,可用治疗方案的质量和多样性也在同步提升。因此,选择最优治疗方案变得日益复杂,可能需要进一步采用以数据为中心的治疗选择方法。 将不同数据模态的信息整合到单一决策中的传统方式体现在多学科诊疗团队中,每位专科临床医生就特定模态或信息发表见解,以达成共识(Mano等人,2022)。尽管这些团队的建立改善了疾病评估和患者管理方案(Mano等人,2022),但此类团队的可扩展性存在可预见的限制。如果数据量和多样性持续增长,将需要大量领域专家才能有效整合这些不同的信息流。幸运的是,另一项在医疗领域站稳脚跟的技术进步是人工智能(AI)。尽管已发表的研究绝大多数聚焦于AI的单模态应用,但已有多位学者强调了AI系统整合多信息流(即所谓的多模态AI)用于决策的潜力(Steyaert等人,2023;Acosta等人,2022;Lipkova等人,2022)。这些多模态AI模型经过训练,能够有效处理不同的多模态数据流,利用信息的互补性,并基于更广泛的患者状况背景做出有依据的预测。然而,尽管成果喜人,研究多模态AI模型的文献相对匮乏,单模态模型的开发仍是实际应用中的主流。 多模态AI模型发展滞后可归因于多项挑战。首先,多模态AI开发的跨部门性质带来了实际挑战。由于不同数据模态可能来自不同的医疗科室,有效整合数据可能需要咨询不同的医学领域专家。此外,各医疗科室在数据存储、检索和处理方面的经验参差不齐,这限制了多模态AI的开发可能性。例如,若放射科拥有全数字化工作流程,而对应的病理科却没有,那么将全切片图像与放射影像数据相结合的多模态AI研究实际上就无法开展。 不同数据模态的特征可能存在巨大差异,例如维度或色彩空间,这通常需要为这些模态量身定制不同的AI模型架构,从而增加了模型设计的复杂性。例如,卷积神经网络(CNN)最初是为结构化数据(如2D和3D图像)设计的,但无法直接应用于非结构化数据。相反,Transformer是适用于多种数据模态的可靠、灵活的编码器,但"一刀切"的架构能否有效捕捉各种医疗数据模态的特征仍不明确。在实际应用中,多模态数据整合通常通过不同(中间)模型输出实现。训练多个领域特定的AI模型(即编码器)并将其有效整合到单一预测中,是多模态AI开发特有的挑战。 最后,多模态数据集中每位患者的所有模态可用性不一致,这进一步增加了复杂性。不同疾病轨迹的患者会有不同的可用模态,导致数据集部分不完整。这可能大幅缩减需要完整多模态数据生成预测的AI模型的训练数据集规模。此外,这些问题也会影响模型落地应用:若部分模态缺失,从可用于决策的数据减少以及可能引入人群选择偏差的角度来看,模型性能会受到何种影响可能并不明确(Acosta等人,2022)。简而言之,与单模态AI开发相比,多模态AI模型的开发面临多项新挑战。 尽管存在这些挑战,过去已有多项关于多模态AI应用的研究,这类研究通常涉及手工设计的特征。此类方法的一个关键问题是,对特定领域专业知识的需求成倍增加,因为专家临床医生还需参与特征设计阶段(Vaidya等人,2020;Tortora等人,2023)。Kline等人(2022)发表了一篇关于多模态AI应用的精彩综述,指出这些模型的AUC(曲线下面积)较单模态模型平均提升6.4%。 近年来,医疗任务中多模态AI的开发兴趣加速增长(Salvi等人,2024),因为无监督学习和深度神经网络作为编码器的应用大大简化了特征提取步骤。在本综述中,我们全面总结了多模态AI在医疗任务中的最新发展,并探究多模态数据整合在多大程度上实现了其宣称的优势。与以往聚焦于特定疾病、预测任务或模态组合的综述不同(Acosta等人,2022;Salvi等人,2024;Krones等人,2025),我们的分析涵盖了整个医疗领域。具体而言,本综述旨在阐明:(I)不同医学学科和任务中多模态AI模型的发展进展;(II)多模态AI开发固有的技术挑战,包括模型架构、融合方法和缺失数据处理;(III)多模态AI模型走向临床的可预见路径,涉及监管审批和技术落地挑战等方面;(IV)推动多模态AI发展的因素及促进该领域进一步成熟的潜在策略。最后,基于对过去六年(2018--2024年)发表的432篇论文的仔细分析,我们将对多模态AI的未来发展前景进行展望。
Aastract
摘要
Recent technological advances in healthcare have led to unprecedented growth in patient data quantity anddiversity. While artificial intelligence (AI) models have shown promising results in analyzing individual datamodalities, there is increasing recognition that models integrating multiple complementary data sources, socalled multimodal AI, could enhance clinical decision-making. This scoping review examines the landscape ofdeep learning-based multimodal AI applications across the medical domain, analyzing 432 papers publishedbetween 2018 and 2024. We provide an extensive overview of multimodal AI development across differentmedical disciplines, examining various architectural approaches, fusion strategies, and common applicationareas. Our analysis reveals that multimodal AI models consistently outperform their unimodal counterparts,with an average improvement of 6.2 percentage points in AUC. However, several challenges persist, includingcross-departmental coordination, heterogeneous data characteristics, and incomplete datasets. We criticallyassess the technical and practical challenges in developing multimodal AI systems and discuss potentialstrategies for their clinical implementation, including a brief overview of commercially available multimodal AImodels for clinical decision-making. Additionally, we identify key factors driving multimodal AI developmentand propose recommendations to accelerate the field's maturation. This review provides researchers andclinicians with a thorough understanding of the current state, challenges, and future directions of multimodalAI in medicine.
近年来医疗领域的技术进步使得患者数据的数量和多样性实现了前所未有的增长。尽管人工智能(AI)模型在分析单一数据模态方面已展现出良好前景,但人们日益认识到,整合多种互补数据源的模型------即所谓的多模态人工智能------有望提升临床决策水平。本范围综述考察了基于深度学习的多模态人工智能在整个医学领域的应用图景,分析了2018至2024年间发表的432篇论文。 我们全面概述了多模态人工智能在不同医学学科中的发展情况,考察了各类架构方法、融合策略及常见应用领域。分析表明,多模态人工智能模型的性能始终优于单模态模型,在AUC(曲线下面积)指标上平均提升6.2个百分点。然而,多项挑战依然存在,包括跨部门协作问题、数据异构性以及数据集不完整等。 我们深入评估了多模态人工智能系统开发中的技术和实践挑战,并探讨了其临床落地的潜在策略,包括对商业化临床决策多模态人工智能模型的简要概述。此外,我们明确了推动多模态人工智能发展的关键因素,并提出了加速该领域成熟的建议。本综述为研究人员和临床医生提供了对医学领域多模态人工智能现状、挑战及未来方向的全面认识。
Method
方法
4.1. Importance of public data
As stated in the introduction, data availability is a key challengefor the development of multimodal medical AI. This is why we see astrong correlation between the number of models for a specific organsystem/modality combination and the availability of public data (seeFig. 3c). The utilization of publicly shared datasets in multimodal AIresearch for medical applications is widespread, with 61% of the datasources used in the model development coming from public data portalssuch as The Cancer Genome Atlas (TCGA, 14%), Alzheimer's DiseaseNeuroimaging Initiative (ADNI, 8%), Medical Information Mart forIntensive Care (MIMIC, 5%) and The Cancer Imaging Archive (TCIA,2%), 15% from data shared publicly through other means (e.g. GitHub,publisher's website), and 24% from private datasets which were notshared publicly. We grouped all other data portals used by less than tenreviewed papers into ''other data portals'' (20%). A detailed breakdownof these public data sources can be viewed in the supplementarymaterials.
4.1. 公共数据的重要性* 如引言所述,数据可用性是多模态医疗人工智能发展的关键挑战。这也是为什么我们发现针对特定器官系统/模态组合的模型数量与公共数据的可获得性之间存在强相关性(见图3c)。在医疗应用的多模态人工智能研究中,公开共享数据集的使用十分普遍------模型开发中使用的数据源有61%来自公共数据平台,例如癌症基因组图谱(TCGA,占14%)、阿尔茨海默病神经影像倡议(ADNI,占8%)、重症监护医疗信息集市(MIMIC,占5%)和癌症影像档案(TCIA,占2%);有15%来自通过其他方式公开共享的数据(如GitHub、出版商网站);另有24%来自未公开共享的私有数据集。我们将所有被少于10篇综述论文使用的其他数据平台归为"其他数据平台"(占20%)。这些公共数据源的详细分类可参见补充材料。
Conclusion
结论
In conclusion, this review provides one of the most comprehensiveoverviews of multimodal AI development, spanning various medicaldisciplines, tasks, and data domains. Although substantial evidenceexists that multimodal AI models will incur significant performanceboosts by taking a broader view of the patient, their developmentposes novel challenges. We hope this review elucidated some of thesechallenges, but more importantly, potential solutions to guide the fieldin the coming years.
总之,本综述对多模态人工智能的发展进行了迄今为止最为全面的概述之一,涵盖了多个医学学科、任务和数据领域。尽管已有充分证据表明,多模态人工智能模型通过更全面地考量患者状况能显著提升性能,但其开发过程仍面临诸多新挑战。我们希望本综述能阐明其中部分挑战,更重要的是,能为该领域未来几年的发展提供潜在解决方案的指引。
Figure
图
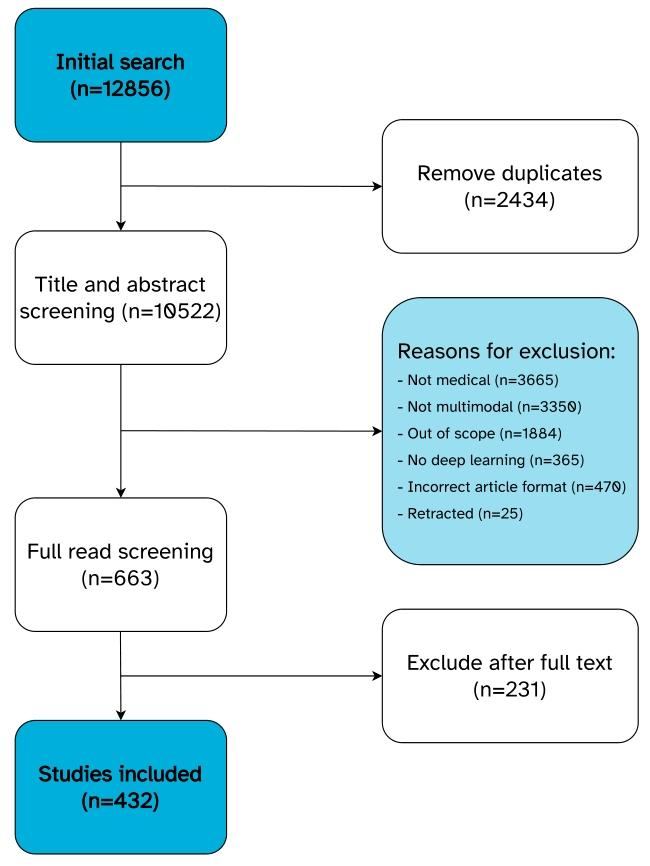
Fig. 1. Overview of the screening process.
图 1. 筛选流程概述
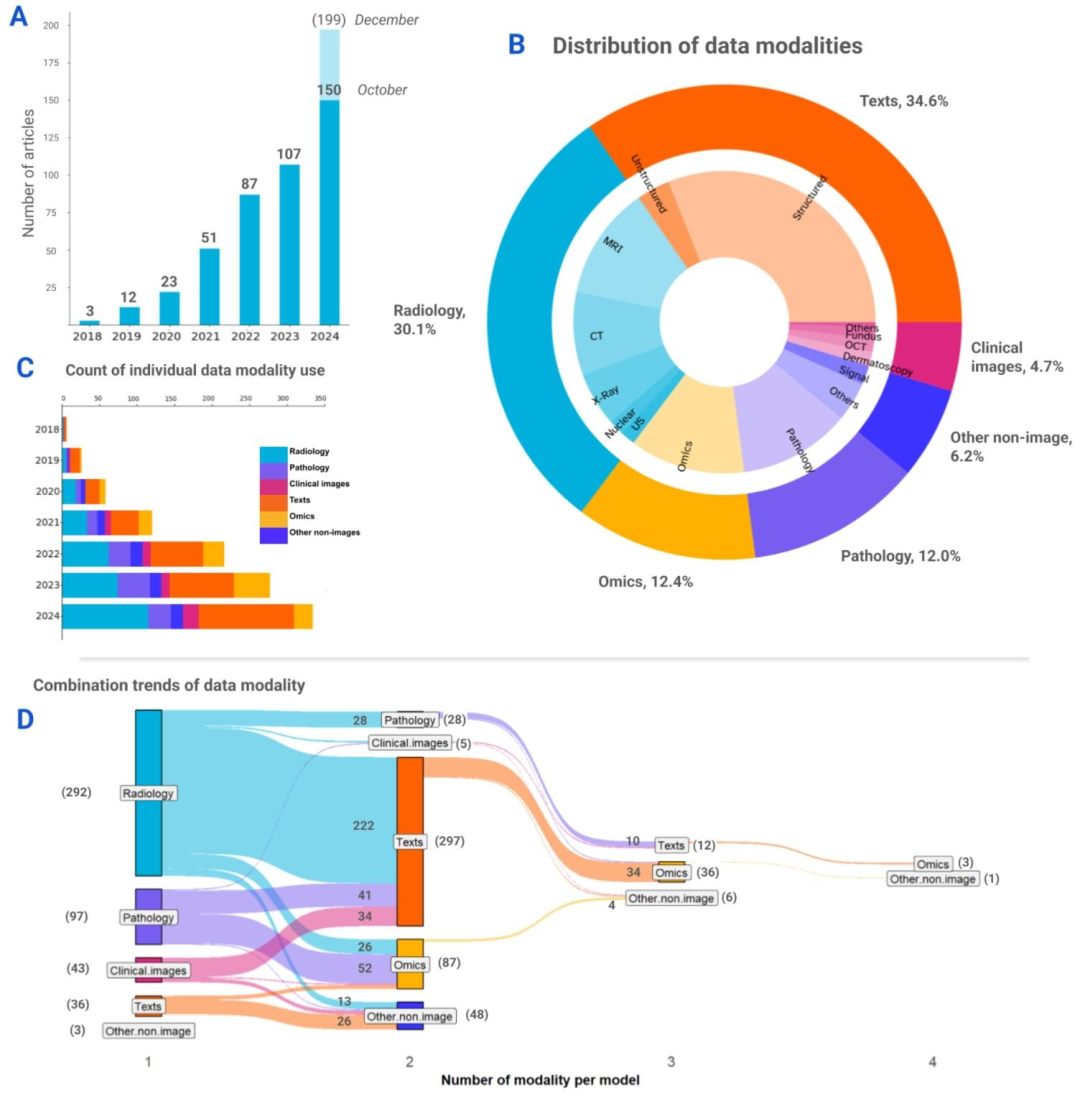
Fig. 2. Overview of the data modalities used in the reviewed articles. (A) Distribution of articles by year. Bar chart shows an exponential increment in the number of studies peryear from 2018 to 2024. Extrapolating, the number of multimodal medical AI studies is expected to reach 199 by the end of 2024. (B) Pie chart shows the proportions of differentmodality groups and the respective data modalities used across studies. (C) Stacked bar chart illustrates the growth trends of data modality groups over the years. Note that thevalues used in this chart represent the counts of individual data modality uses, where multiple modalities could be presented in a single article. (D) Diagram shows the combinationtrends between data modalities per model. The diagram captures the unique modality combinations presented in each models the individual article has presented. The numbersin brackets indicate the total summation of models per category, whereas the numbers without brackets represent the count of models of each combination, visualized with theribbon bands between the vertical nodes. The majority of the models used two data modalities, and a portion of the total used three and four modalities. Three multimodal modelsused data modalities that were grouped under ''other non-image'' category based on the definition used in this review
图2. 综述文章中使用的数据模态概述** (A)按年份划分的文章分布。柱状图显示2018至2024年间,每年的研究数量呈指数增长。据推测,到2024年底,多模态医疗AI研究的数量有望达到199项。 (B)饼图展示了不同模态组的占比以及各研究中使用的相应数据模态。 (C)堆积柱状图说明了各数据模态组多年来的增长趋势。请注意,本图中的数值代表单个数据模态的使用次数,其中一篇文章可能涉及多种模态。 (D)示意图展示了每个模型的数据模态组合趋势。该图涵盖了每篇文章中提出的模型所采用的独特模态组合。括号中的数字表示每个类别的模型总数,无括号的数字代表每种组合的模型数量,通过垂直节点间的 ribbon 带可视化呈现。大多数模型使用两种数据模态,部分模型使用三种和四种模态。有三个多模态模型使用的数据模态根据本综述的定义被归为"其他非图像"类别。
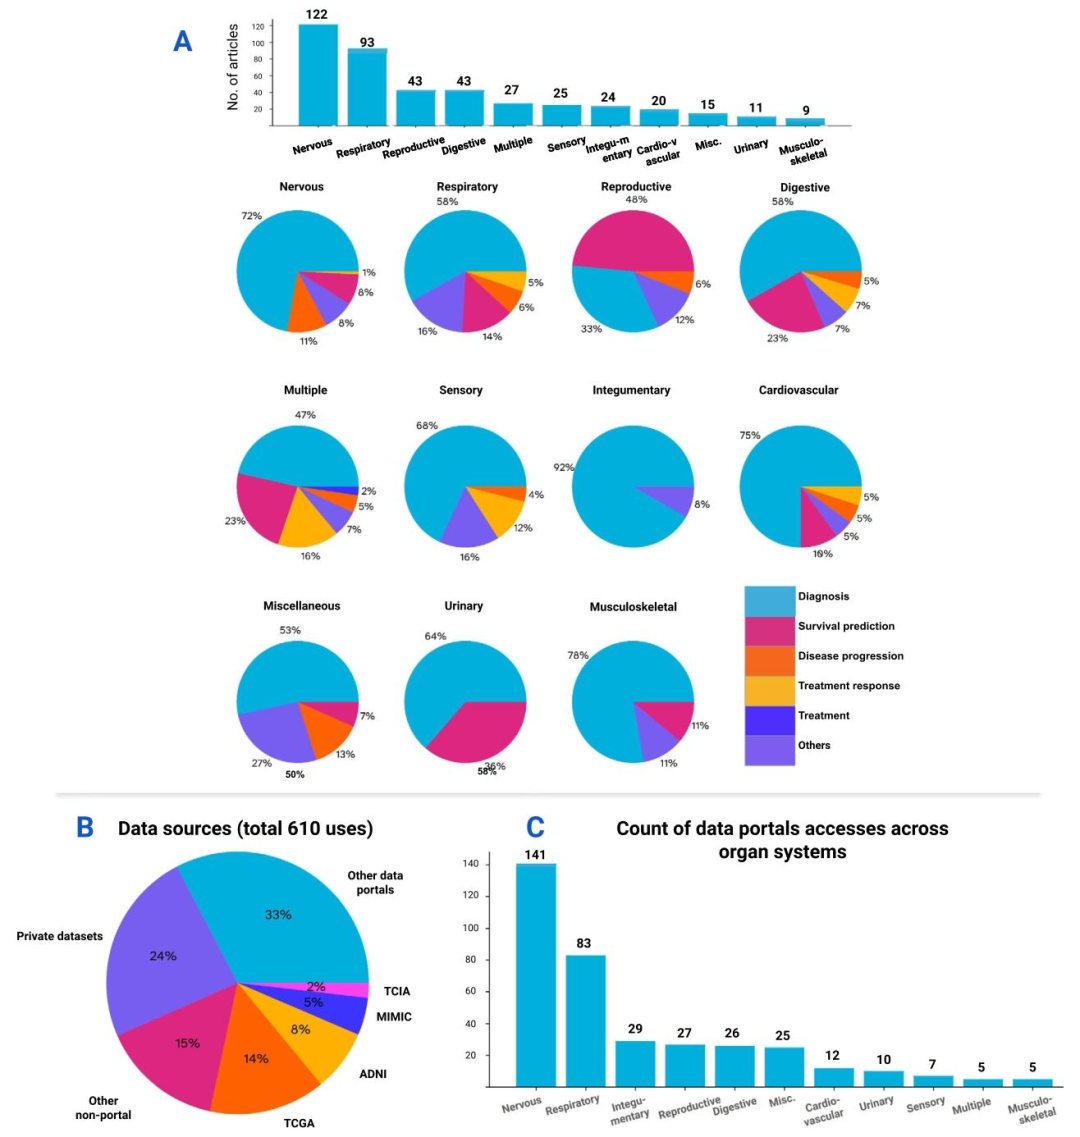
Fig. 3. A deeper dive into the medical tasks and data sources of the review. The numbers on the bars indicate the total summation per category. (A) Top: The number of articlesper organ system. Bottom: Distribution of medical tasks across organ systems. Pie charts show diagnosis being the most prevalent medical task performed in studies of all organsystems. (B) The use trends of data sources in this review. Note that the values used in the chart represent the total count of uses of all the reviewed studies, where multipledata sources could be referred to in each study. About 61% of the total uses were sourced from data portals (e.g. TCGA, ADNI, etc.), 15% from research data shared publicly bypublications, and 24% of the data uses were private datasets that were not made public. (C) Distribution of public data sources (excluding private datasets) across the studies oforgan systems. Similarly, the nervous and respiratory systems are leading in the count of public data uses. A detailed breakdown of these public data sources can be found in thesupplementary materials.
图3. 综述中医疗任务与数据源的深入分析 柱状图上的数字表示每个类别的总数。 (A)上:按器官系统划分的文章数量。下:各器官系统中医疗任务的分布。饼图显示,诊断是所有器官系统研究中最普遍的医疗任务。 (B)本综述中数据源的使用趋势。请注意,图中的数值代表所有综述研究的总使用次数,其中每篇研究可能涉及多个数据源。约61%的使用来自数据平台(如TCGA、ADNI等),15%来自出版物公开共享的研究数据,24%为未公开的私有数据集。 (C)各器官系统研究中公共数据源的分布(不含私有数据集)。同样,神经系统和呼吸系统的公共数据使用次数领先。这些公共数据源的详细分类可参见补充材料。
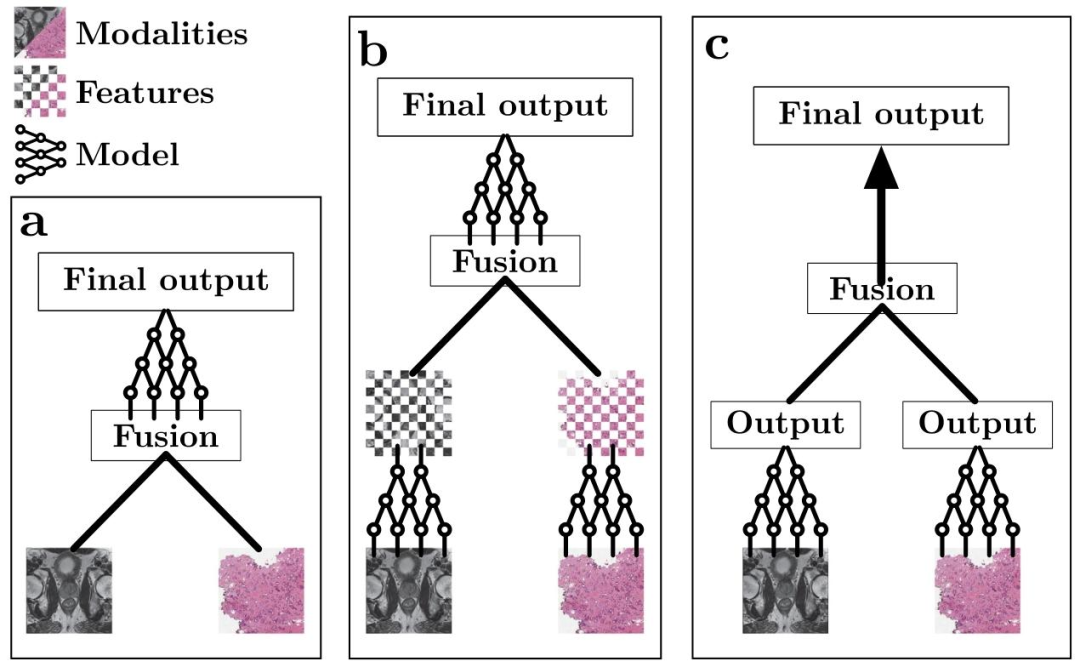
Fig. 4. Simplified schematic view of the different fusion stages. (a) Early fusion. The modalities (in this case, prostate cancer MRI (Saha et al., 2022) and histopathology whole-slideimages (Weinstein et al., 2013) are combined before feature encoding. (b) Intermediate fusion. A feature extraction network is used before fusion, after which the (intermediate)features get combined to then be processed by a final model. (c) Late fusion. A feature extraction network is used to extract a result (e.g. prediction) from each individual modality,after which the results are combined. No deep learning is used after fusion.
图4. 不同融合阶段的简化示意图 (a)早期融合:在特征编码之前合并模态(本案例中为前列腺癌MRI(Saha等人,2022)和组织病理学全切片图像(Weinstein等人,2013))。 (b)中间融合:在融合前使用特征提取网络,随后合并(中间)特征,再由最终模型处理。 (c)晚期融合:使用特征提取网络从每个单独模态中提取结果(如预测值),之后合并这些结果。融合后不使用深度学习处理。
Table
表
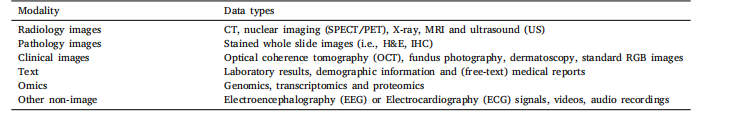
Table 1A brief overview of all modality categories considered in this review with several examples (non-exhaustive) of corresponding data types
表 1 本综述所涵盖的所有模态类别的简要概述及对应数据类型的若干示例(非详尽列举)