目录
Prometheus
概述------
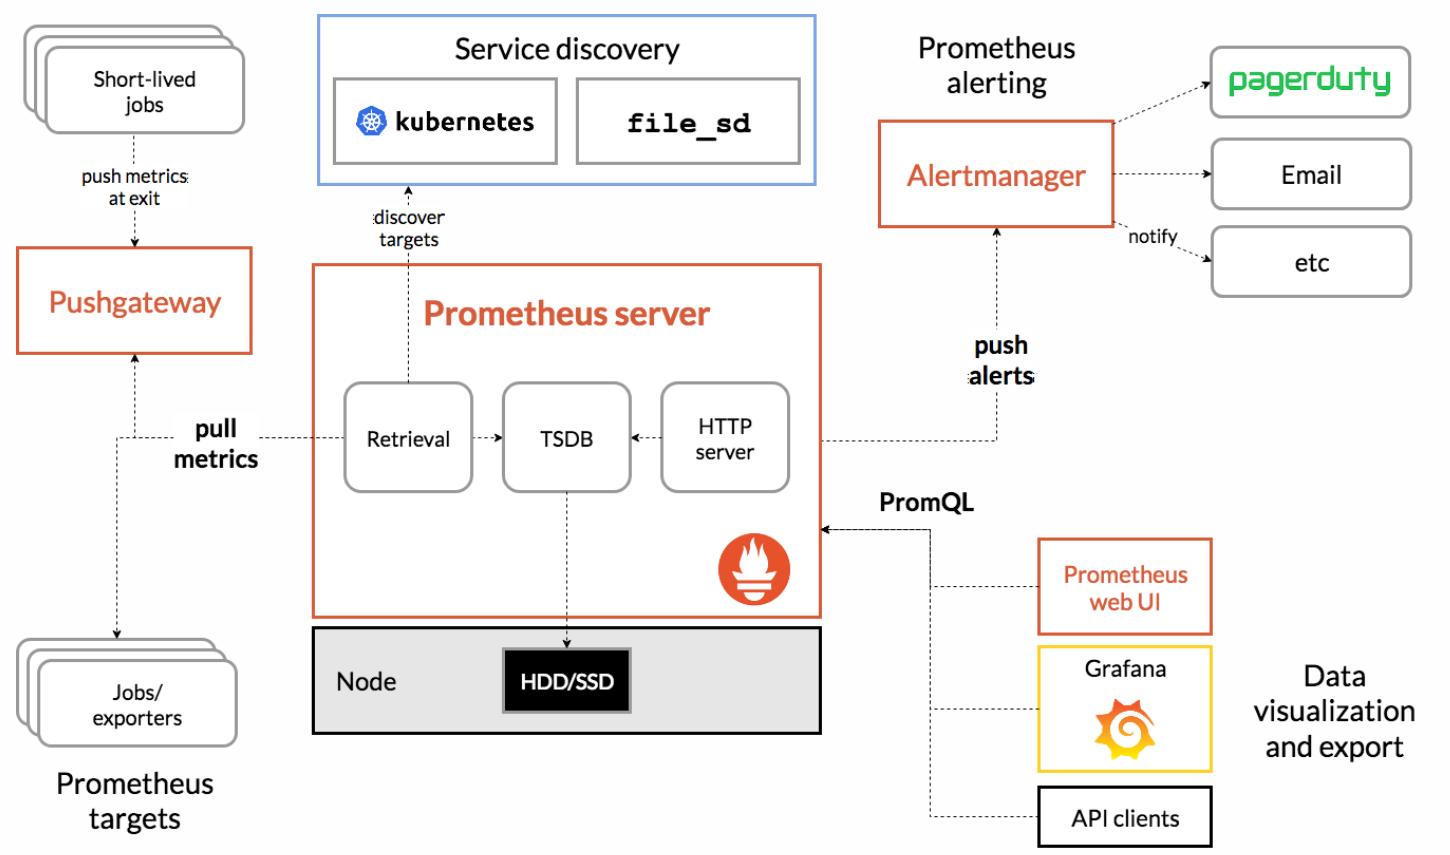
Prometheus是一个开源系统监控和警报工具包,最初由 SoundCloud构建。
是一款监控软件,也是一个时序数据库。Prometheus 将其指标收集并存储为时间序列数据,即指标信息与记录时的时间戳以及称为标签的可选键值对一起存储。
主要用在容器监控方面,也可以用于常规的主机监控。
使用google公司开发的go语言编写。
Prometheus是一个框架,可以与其他组件完美结合。
重视高可用,准确性达不到100%
服务名:prometheus
服务端口:9090
安装prometheus
你可以从Prometheus官网下载安装包,然后上传到服务器进行解压安装
Download | Prometheus 找到合适的安装包进行下载
案例
环境说明
|------------|----------------|---------------|
| 主机名称 | IP地址 | 功能 |
| prometheus | 192.168.88.5 | prometheus服务器 |
| web1 | 192.168.88.100 | web服务器 |
| web2 | 192.168.88.200 | web服务器 |
实验步骤
一、 prometheus服务器 配置时间同步
方法一:计划任务方式
#创建定时任务:
*/2 * * * * /sbin/ntpdate ntp1.aliyun.com &>/dev/null
方法二:chrony服务方式
#安装chrony:
dnf -y install chrony
#配置chrony:
vim /etc/chrony.conf
#添加或修改服务器配置:
server 目标IP/域名 iburst
#启动服务:
systemctl enable chronyd --now
#验证同步状态:
chronyc sources
方法三:timedatectl工具
#查看时区:
timedatectl
#设置时区:
timedatectl set-timezone Asia/Shanghai
#查看当前时间:
date
#手动修改时间:
date -s "YYYY-MM-DD HH:MM:SS"
二、 安装Prometheus服务器
#拷贝Prometheus相关软件包到服务器,解压即部署
root@prometheus \~# cd prometheus_soft/
root@prometheus prometheus_soft# tar xf prometheus-2.37.5.linux-amd64.tar.gz
root@prometheus prometheus_soft# mv prometheus-2.37.5.linux-amd64 /usr/local/prometheus
配置文件说明
配置文件中包含三个配置块:global、rule_files和scrape_configs。
global块控制 Prometheus 服务器的全局配置。我们有两个选择。第一个,scrape_interval控制 Prometheus 抓取目标的频率。您可以为单个目标覆盖它。在这种情况下,全局设置是每 15 秒抓取一次。该evaluation_interval选项控制 Prometheus 评估规则的频率。Prometheus 使用规则来创建新的时间序列并生成警报。
rule_files块指定我们希望 Prometheus 服务器加载的任何规则的位置。现在我们还没有规则。
最后一个块,scrape_configs控制 Prometheus 监控的资源。由于 Prometheus 还将有关自身的数据公开为 HTTP 端点,因此它可以抓取和监控自身的健康状况。在默认配置中,有一个名为 的作业prometheus,用于抓取 Prometheus 服务器公开的时间序列数据。该作业包含一个单一的、静态配置的目标,即localhost的9090端口。Prometheus期望度量在/metrics路径上的目标上可用,所以这个默认作业是通过 URL 抓取的:http://localhost:9090/metrics。
三、编写服务启动文件并启动服务
root@prometheus prometheus_soft# vim /usr/lib/systemd/system/prometheus.service
Unit
Description=Prometheus Monitoring System #服务描述
After=network.target #在网络服务启动后运行
#启动命令指定了配置文件路径(--config.file)和数据存储路径(--storage.tsdb.path)
Service
ExecStart=/usr/local/prometheus/prometheus \
--config.file=/usr/local/prometheus/prometheus.yml \
--storage.tsdb.path=/usr/local/prometheus/data/
Install
WantedBy=multi-user.target #设置为多用户模式下启动
启动服务
root@prometheus prometheus_soft# systemctl daemon-reload
root@prometheus prometheus_soft# systemctl enable prometheus.service --now
root@prometheus prometheus_soft# ss -tlnp | grep :9090
LISTEN 0 128 *:9090 *:* users:(("prometheus",pid=4396,fd=7))
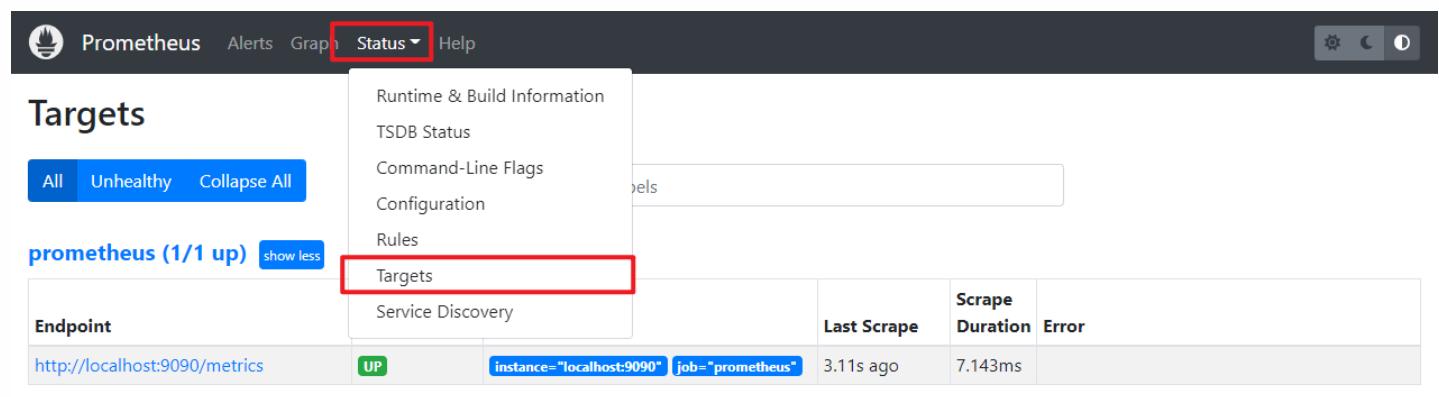
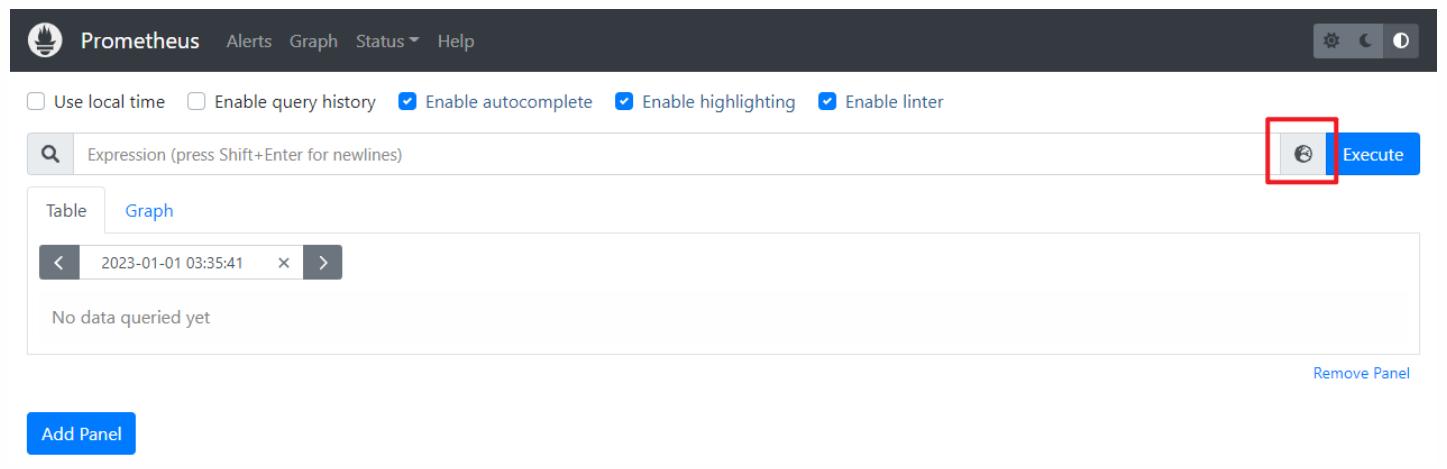
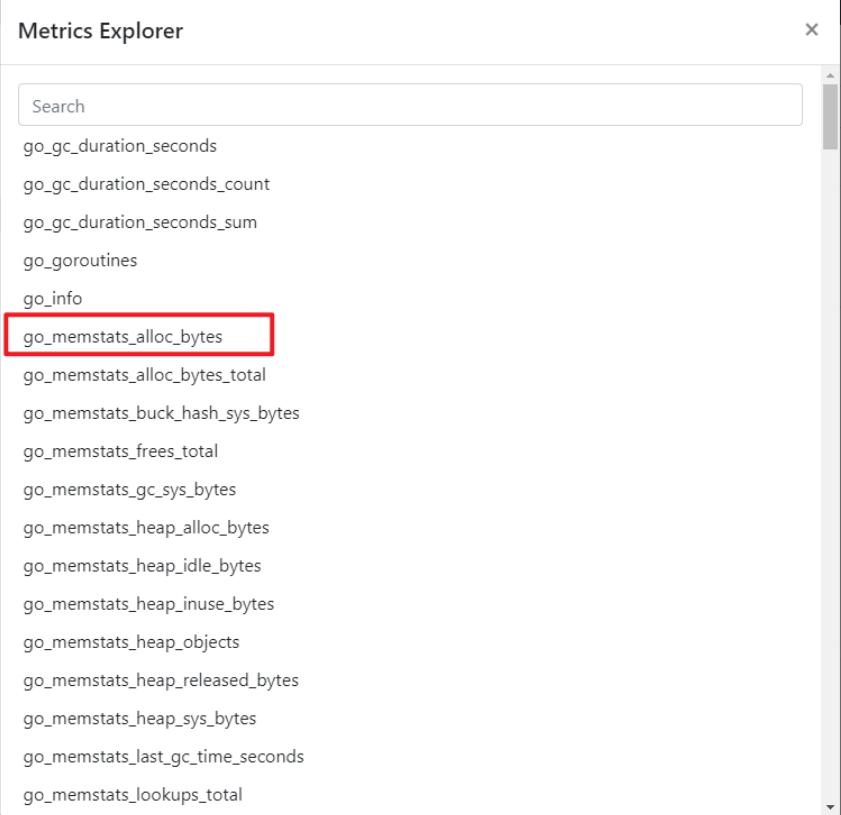
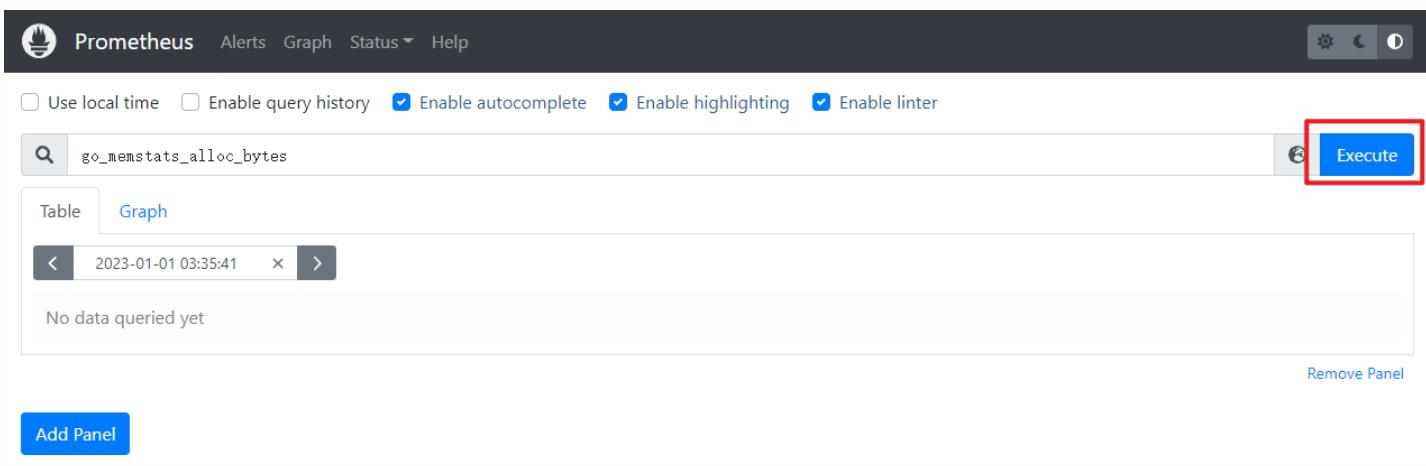
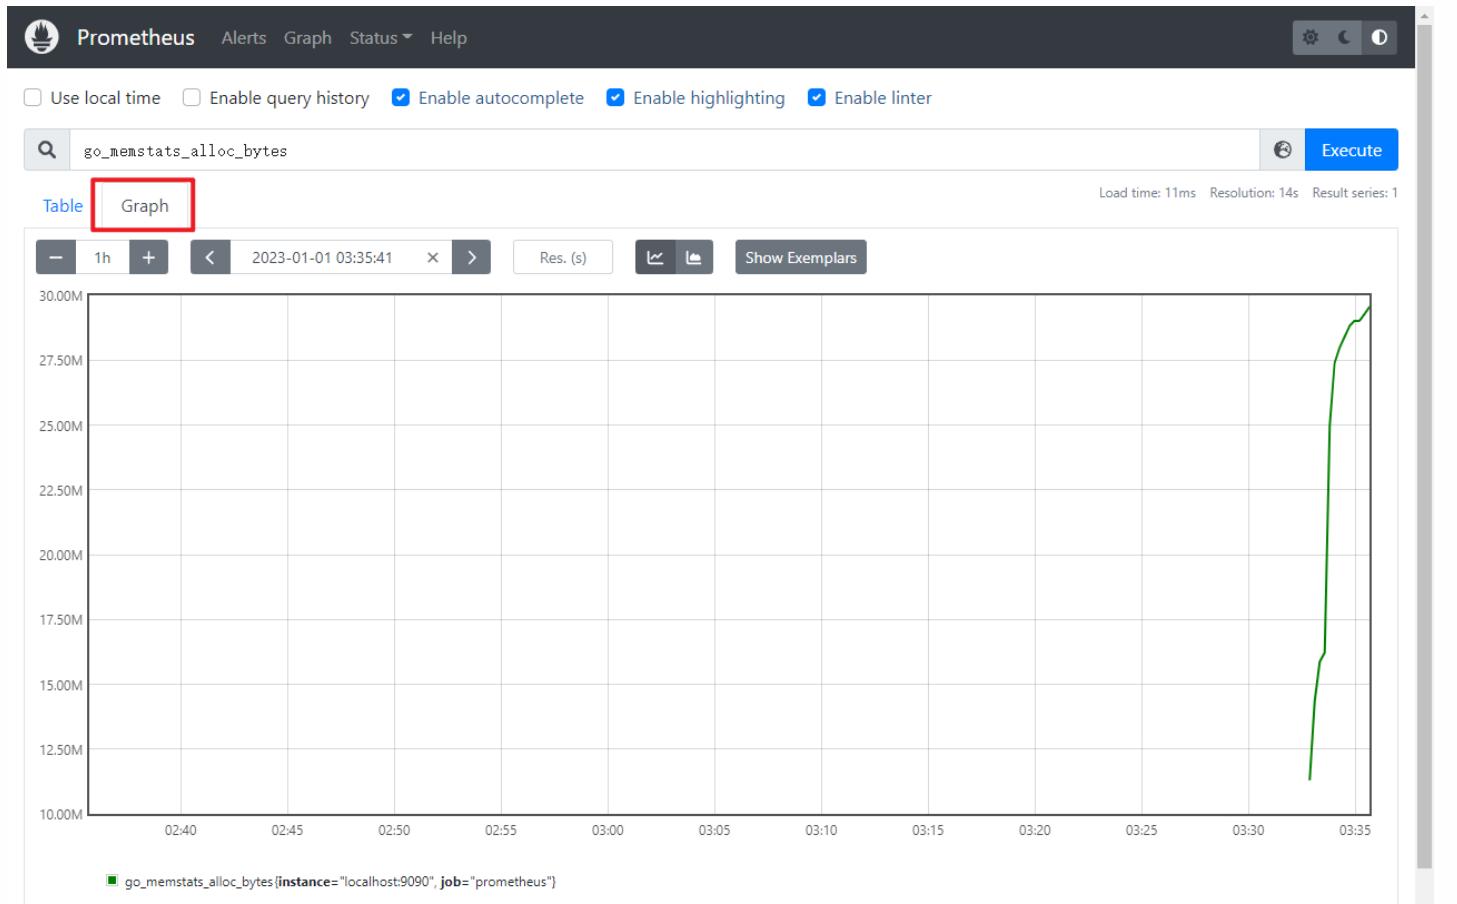
四、访问web页面
查看监控自身的数据,如分配置给Prometheus运行的内存数量