✨作者主页 :IT研究室✨
个人简介:曾从事计算机专业培训教学,擅长Java、Python、微信小程序、Golang、安卓Android等项目实战。接项目定制开发、代码讲解、答辩教学、文档编写、降重等。
文章目录
一、前言
系统介绍
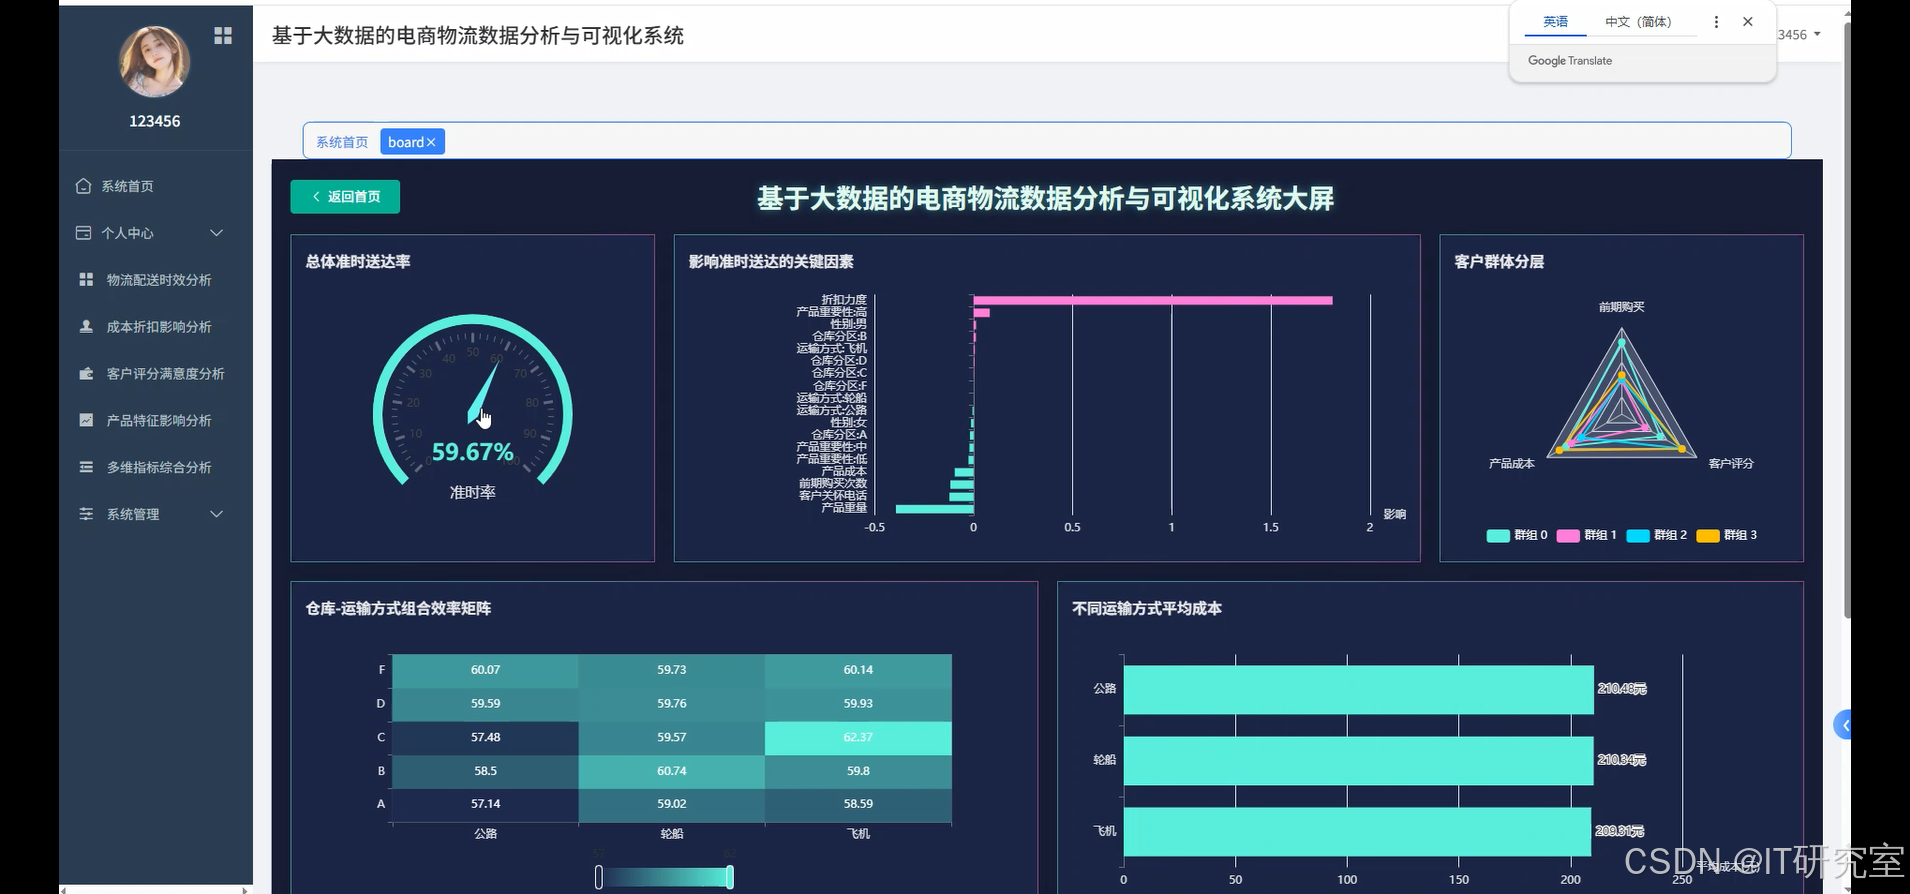
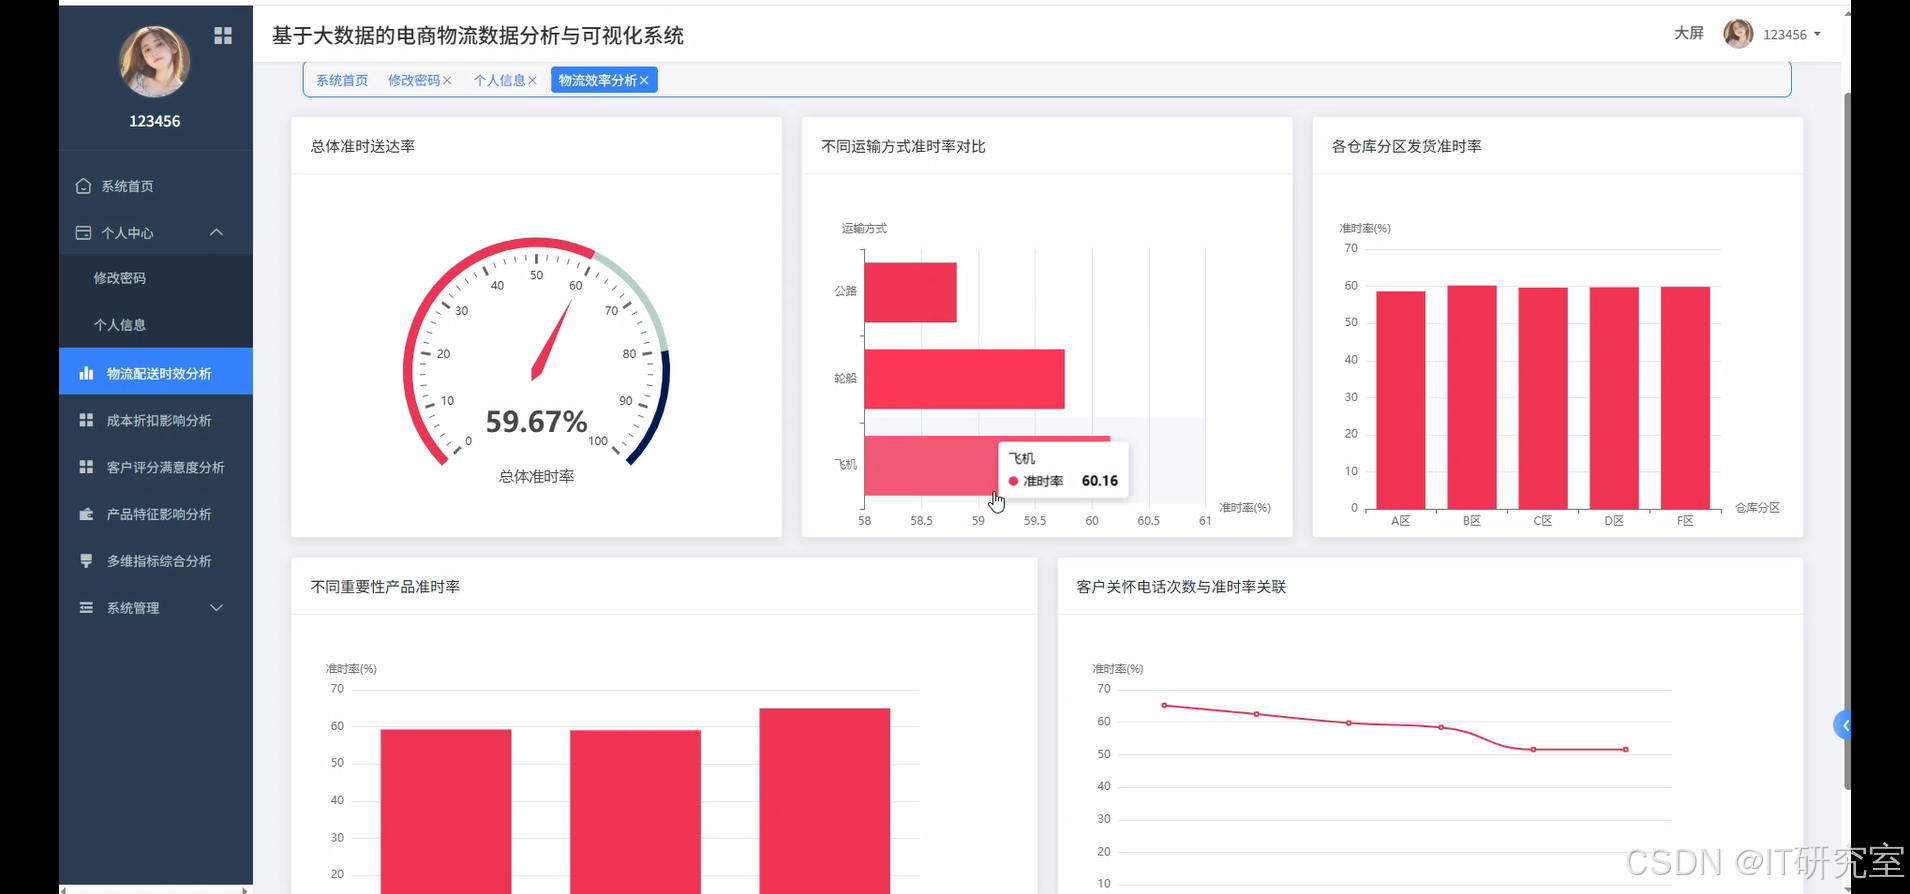
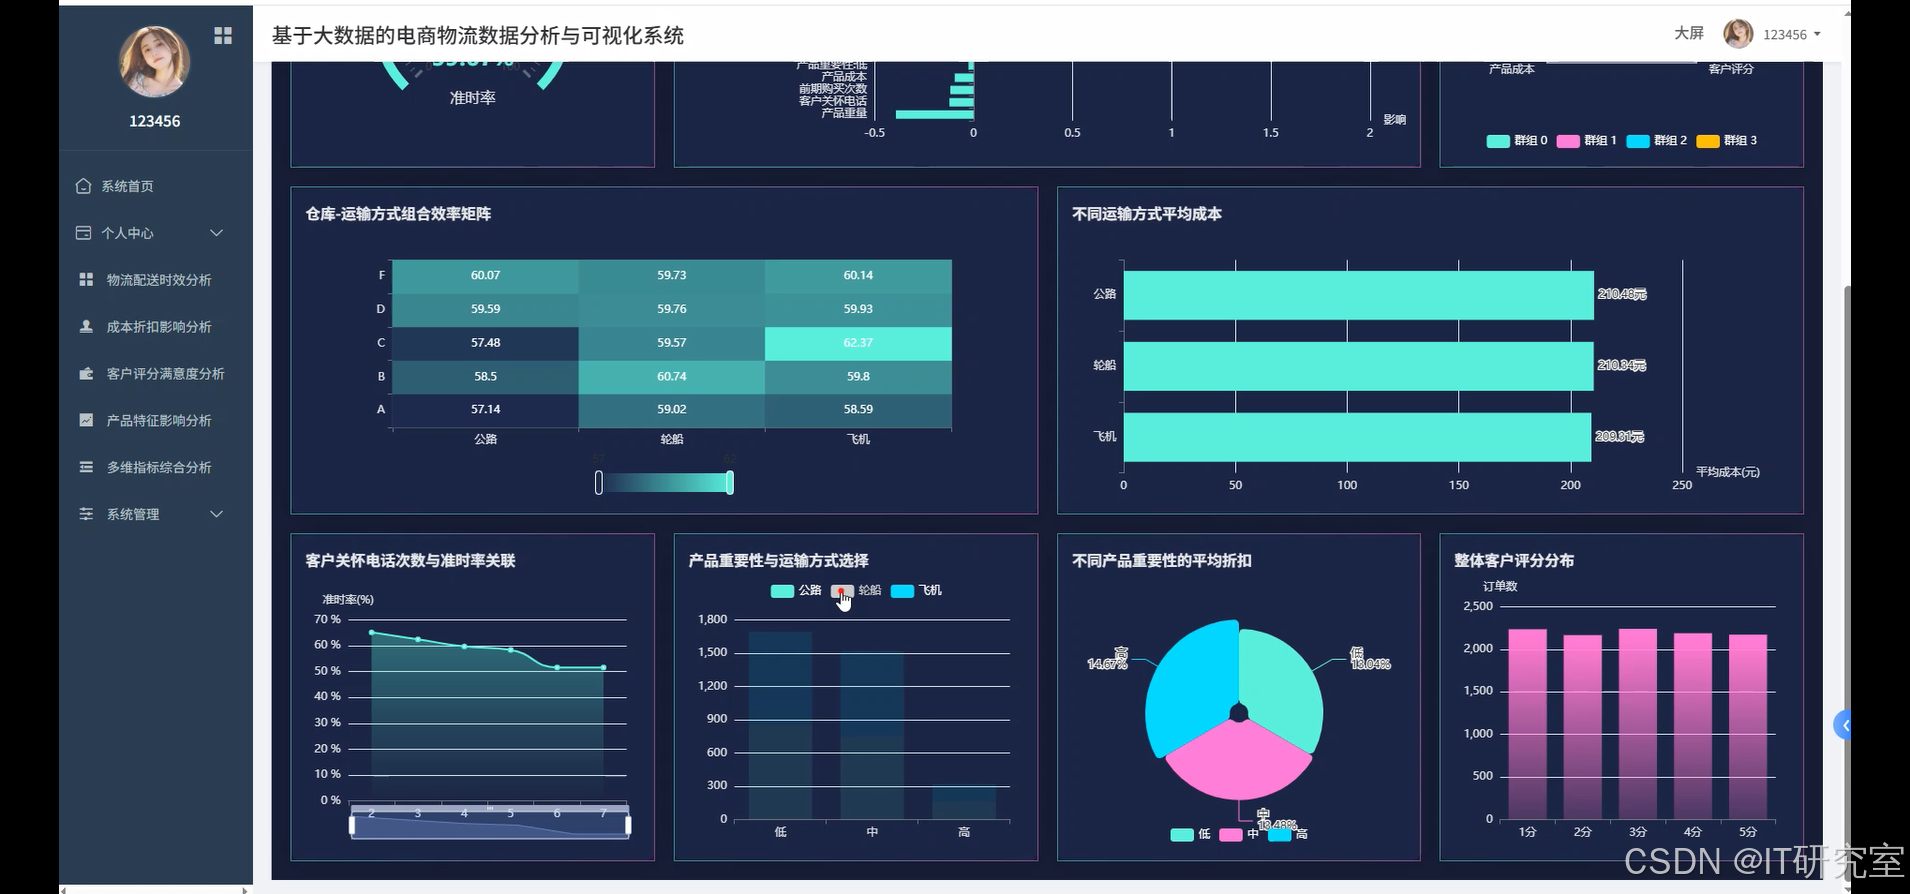
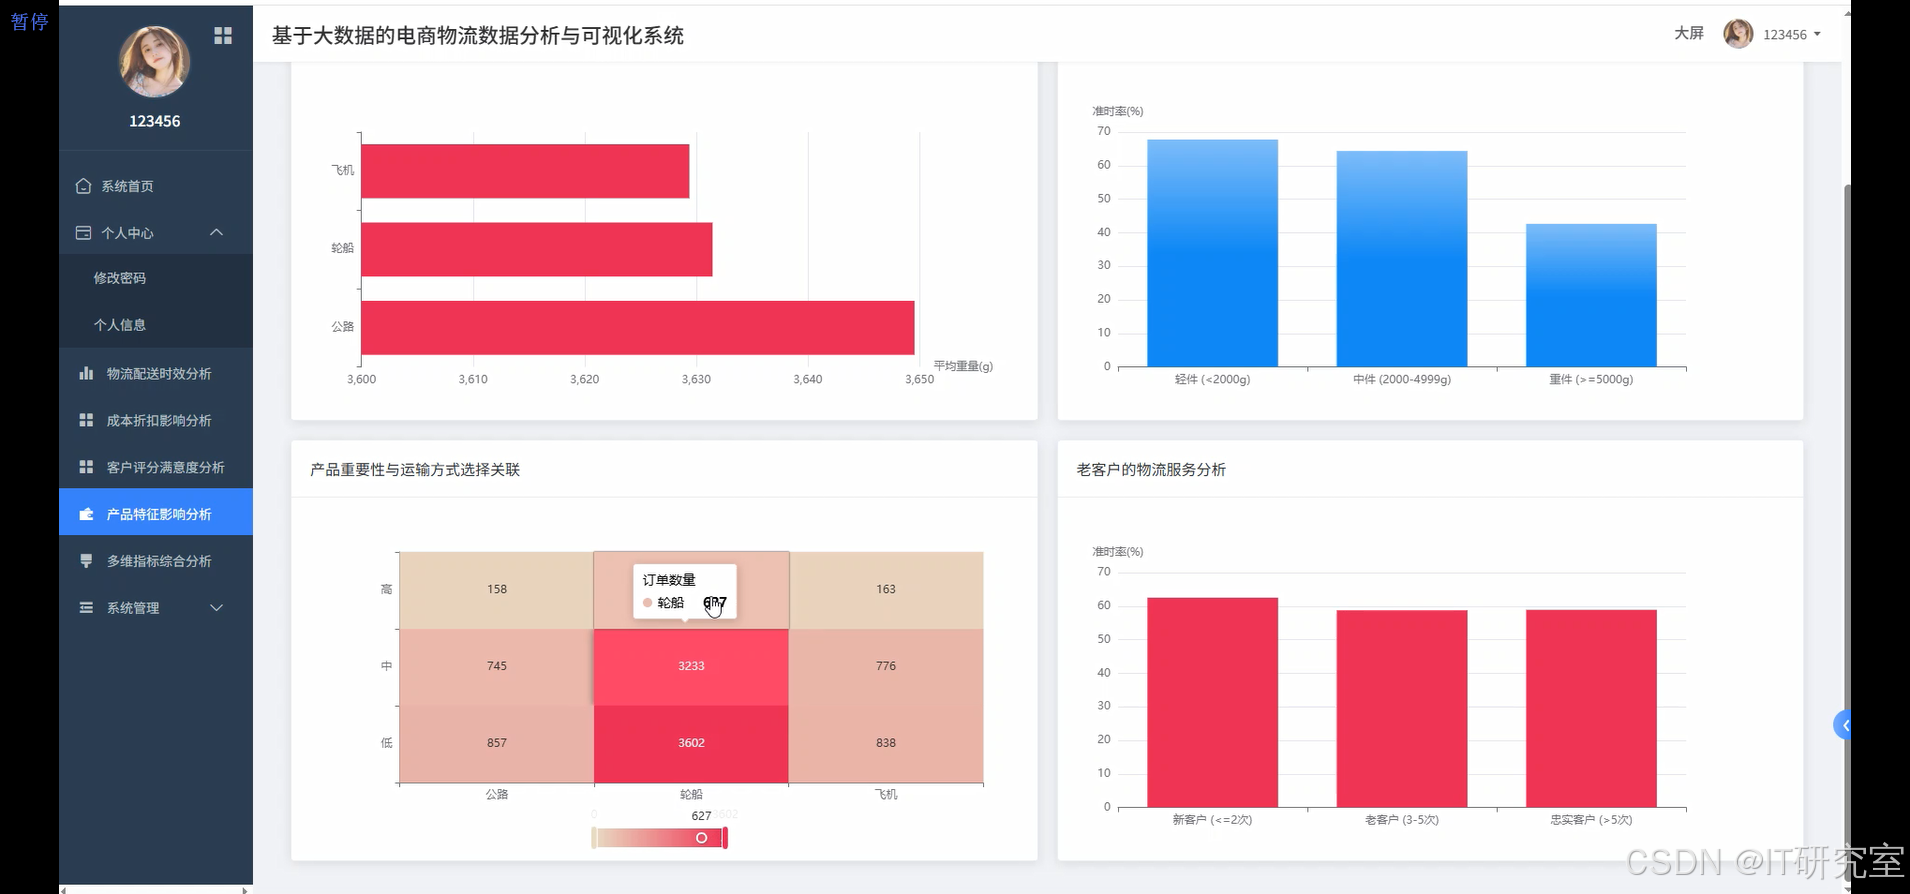
本系统是一个基于大数据技术栈的电商物流数据分析与可视化平台,采用Hadoop+Spark分布式计算框架处理海量物流数据,通过Python和Java双语言支持实现数据处理的灵活性。系统后端基于Django和Spring Boot框架构建RESTful API服务,前端采用Vue+ElementUI+Echarts技术栈打造响应式数据可视化界面。系统核心功能涵盖物流配送时效分析、产品特征影响评估、成本折扣策略分析、客户满意度评价以及多维指标综合分析等五大模块。通过Spark SQL和Pandas进行数据清洗与特征工程,利用NumPy进行统计计算,最终以交互式图表、实时大屏等形式展现分析结果。系统支持对电商物流全链路数据进行深度挖掘,识别影响配送效率的关键因子,为企业物流策略优化提供科学决策依据。整体架构采用前后端分离设计,数据存储于MySQL数据库,确保系统的高可用性和数据安全性。
选题背景
随着电子商务行业的快速发展,物流配送已成为影响用户体验和企业竞争力的关键环节。电商平台每日产生的订单数据、配送记录、客户反馈等信息呈指数级增长,传统的数据处理方式已无法满足大规模数据分析的需求。物流企业面临着配送时效不稳定、成本控制困难、客户满意度下降等挑战,亟需通过数据驱动的方式识别问题根源并制定优化策略。现有的物流管理系统大多侧重于订单跟踪和基础统计,缺乏深度的数据挖掘和预测分析能力。传统分析方法难以处理多维度、大体量的物流数据,也无法实现实时监控和动态调整。电商企业迫切需要一套能够整合多源数据、提供智能分析、支持可视化展示的综合性物流分析平台,以提升运营效率和服务质量。
选题意义
本课题的研究具有重要的理论价值和实践意义。从技术层面看,该系统将大数据处理技术与物流业务场景深度结合,探索了Hadoop、Spark等分布式计算框架在物流数据分析中的应用模式,为相关领域的技术选型和架构设计提供参考。从商业价值角度,系统通过多维度数据分析帮助企业识别物流瓶颈,优化资源配置,降低运营成本,提升客户满意度,具有明显的经济效益。对于学术研究而言,该课题将机器学习算法应用于物流效率预测和客户行为分析,丰富了数据科学在供应链管理领域的应用案例。系统的可视化功能使复杂的数据分析结果变得直观易懂,提高了数据驱动决策的效率和准确性。此外,该系统采用的技术架构和分析方法具有一定的通用性,可为其他行业的数据分析项目提供借鉴和参考,推动大数据技术在传统行业的深入应用。
二、开发环境
- 大数据框架:Hadoop+Spark(本次没用Hive,支持定制)
- 开发语言:Python+Java(两个版本都支持)
- 后端框架:Django+Spring Boot(Spring+SpringMVC+Mybatis)(两个版本都支持)
- 前端:Vue+ElementUI+Echarts+HTML+CSS+JavaScript+jQuery
- 详细技术点:Hadoop、HDFS、Spark、Spark SQL、Pandas、NumPy
- 数据库:MySQL
三、系统界面展示
- 基于大数据的电商物流数据分析与可视化系统界面展示:
四、代码参考
- 项目实战代码参考:
java(贴上部分代码)
from pyspark.sql import SparkSession
from pyspark.sql.functions import col, count, avg, when, desc, sum as spark_sum
import pandas as pd
import numpy as np
from django.http import JsonResponse
from sklearn.ensemble import RandomForestClassifier
from sklearn.cluster import KMeans
spark = SparkSession.builder.appName("EcommerceLogisticsAnalysis").config("spark.sql.adaptive.enabled", "true").getOrCreate()
def logistics_efficiency_analysis(request):
df = spark.read.csv("/data/eCommerce.csv", header=True, inferSchema=True)
df_cleaned = df.filter(col("Reached.on.Time_Y.N").isNotNull())
overall_ontime_rate = df_cleaned.filter(col("Reached.on.Time_Y.N") == 1).count() / df_cleaned.count() * 100
transport_efficiency = df_cleaned.groupBy("Mode_of_Shipment").agg(
count("*").alias("total_orders"),
spark_sum(when(col("Reached.on.Time_Y.N") == 1, 1).otherwise(0)).alias("ontime_orders"),
(spark_sum(when(col("Reached.on.Time_Y.N") == 1, 1).otherwise(0)) / count("*") * 100).alias("ontime_rate")
).orderBy(desc("ontime_rate"))
warehouse_performance = df_cleaned.groupBy("Warehouse_block").agg(
count("*").alias("total_shipments"),
avg("Cost_of_the_Product").alias("avg_cost"),
(spark_sum(when(col("Reached.on.Time_Y.N") == 1, 1).otherwise(0)) / count("*") * 100).alias("efficiency_rate")
).orderBy(desc("efficiency_rate"))
customer_care_impact = df_cleaned.groupBy("Customer_care_calls").agg(
count("*").alias("order_count"),
avg("Customer_rating").alias("avg_rating"),
(spark_sum(when(col("Reached.on.Time_Y.N") == 1, 1).otherwise(0)) / count("*") * 100).alias("ontime_percentage")
).orderBy("Customer_care_calls")
weight_segments = df_cleaned.withColumn("weight_category",
when(col("Weight_in_gms") < 2000, "轻件")
.when(col("Weight_in_gms") < 5000, "中件")
.otherwise("重件")
).groupBy("weight_category").agg(
count("*").alias("shipment_count"),
avg("Cost_of_the_Product").alias("avg_product_cost"),
(spark_sum(when(col("Reached.on.Time_Y.N") == 1, 1).otherwise(0)) / count("*") * 100).alias("delivery_success_rate")
)
return JsonResponse({
'overall_rate': round(overall_ontime_rate, 2),
'transport_data': transport_efficiency.collect(),
'warehouse_data': warehouse_performance.collect(),
'care_impact': customer_care_impact.collect(),
'weight_analysis': weight_segments.collect()
})
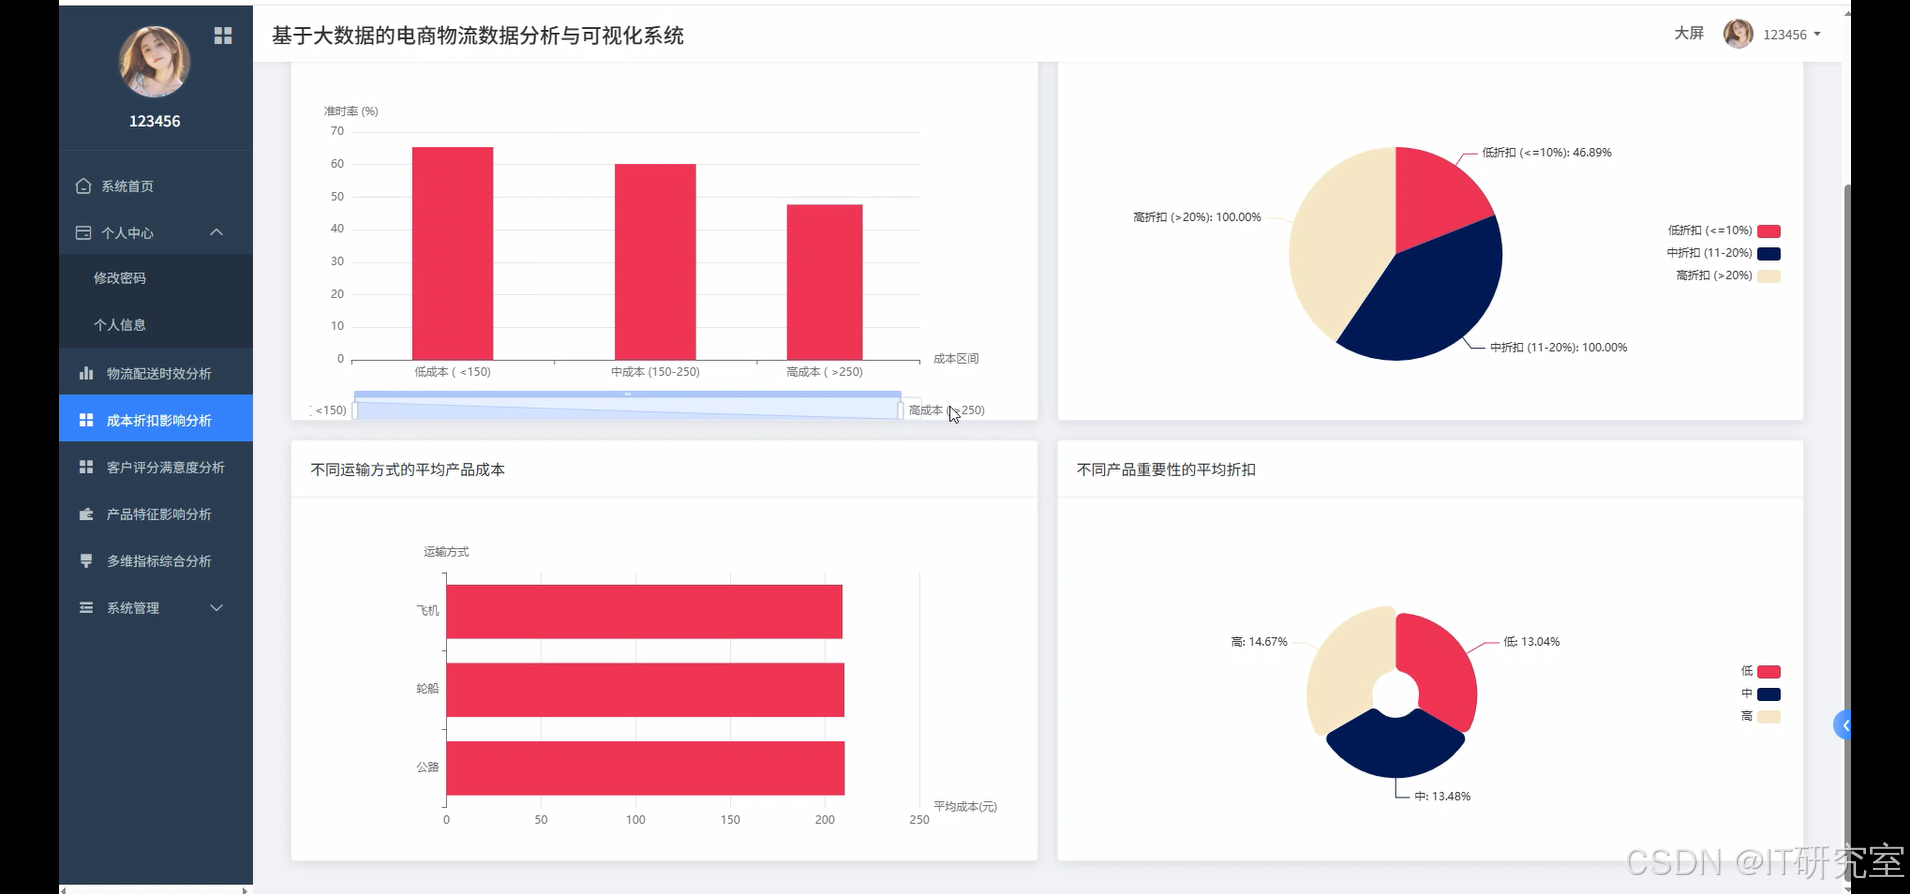
def cost_discount_analysis(request):
df = spark.read.csv("/data/eCommerce.csv", header=True, inferSchema=True)
df_processed = df.filter(col("Cost_of_the_Product").isNotNull() & col("Discount_offered").isNotNull())
cost_segments = df_processed.withColumn("cost_range",
when(col("Cost_of_the_Product") < 150, "低成本")
.when(col("Cost_of_the_Product") < 250, "中成本")
.otherwise("高成本")
).groupBy("cost_range").agg(
count("*").alias("product_count"),
avg("Discount_offered").alias("avg_discount"),
avg("Customer_rating").alias("avg_rating"),
(spark_sum(when(col("Reached.on.Time_Y.N") == 1, 1).otherwise(0)) / count("*") * 100).alias("ontime_rate")
).orderBy("cost_range")
discount_impact = df_processed.withColumn("discount_level",
when(col("Discount_offered") < 10, "低折扣")
.when(col("Discount_offered") < 20, "中折扣")
.otherwise("高折扣")
).groupBy("discount_level").agg(
count("*").alias("order_volume"),
avg("Cost_of_the_Product").alias("avg_cost"),
avg("Customer_rating").alias("customer_satisfaction"),
(spark_sum(when(col("Reached.on.Time_Y.N") == 1, 1).otherwise(0)) / count("*") * 100).alias("delivery_performance")
)
transport_cost_relation = df_processed.groupBy("Mode_of_Shipment").agg(
avg("Cost_of_the_Product").alias("average_product_cost"),
avg("Discount_offered").alias("average_discount"),
count("*").alias("usage_frequency")
).orderBy(desc("average_product_cost"))
importance_pricing = df_processed.groupBy("Product_importance").agg(
avg("Cost_of_the_Product").alias("avg_cost"),
avg("Discount_offered").alias("avg_discount_rate"),
count("*").alias("product_volume")
).orderBy("Product_importance")
profit_analysis = df_processed.withColumn("estimated_profit",
col("Cost_of_the_Product") - (col("Cost_of_the_Product") * col("Discount_offered") / 100)
).groupBy("Mode_of_Shipment", "Product_importance").agg(
avg("estimated_profit").alias("avg_profit_margin"),
count("*").alias("transaction_count")
)
return JsonResponse({
'cost_segments': cost_segments.collect(),
'discount_impact': discount_impact.collect(),
'transport_cost': transport_cost_relation.collect(),
'importance_pricing': importance_pricing.collect(),
'profit_data': profit_analysis.collect()
})
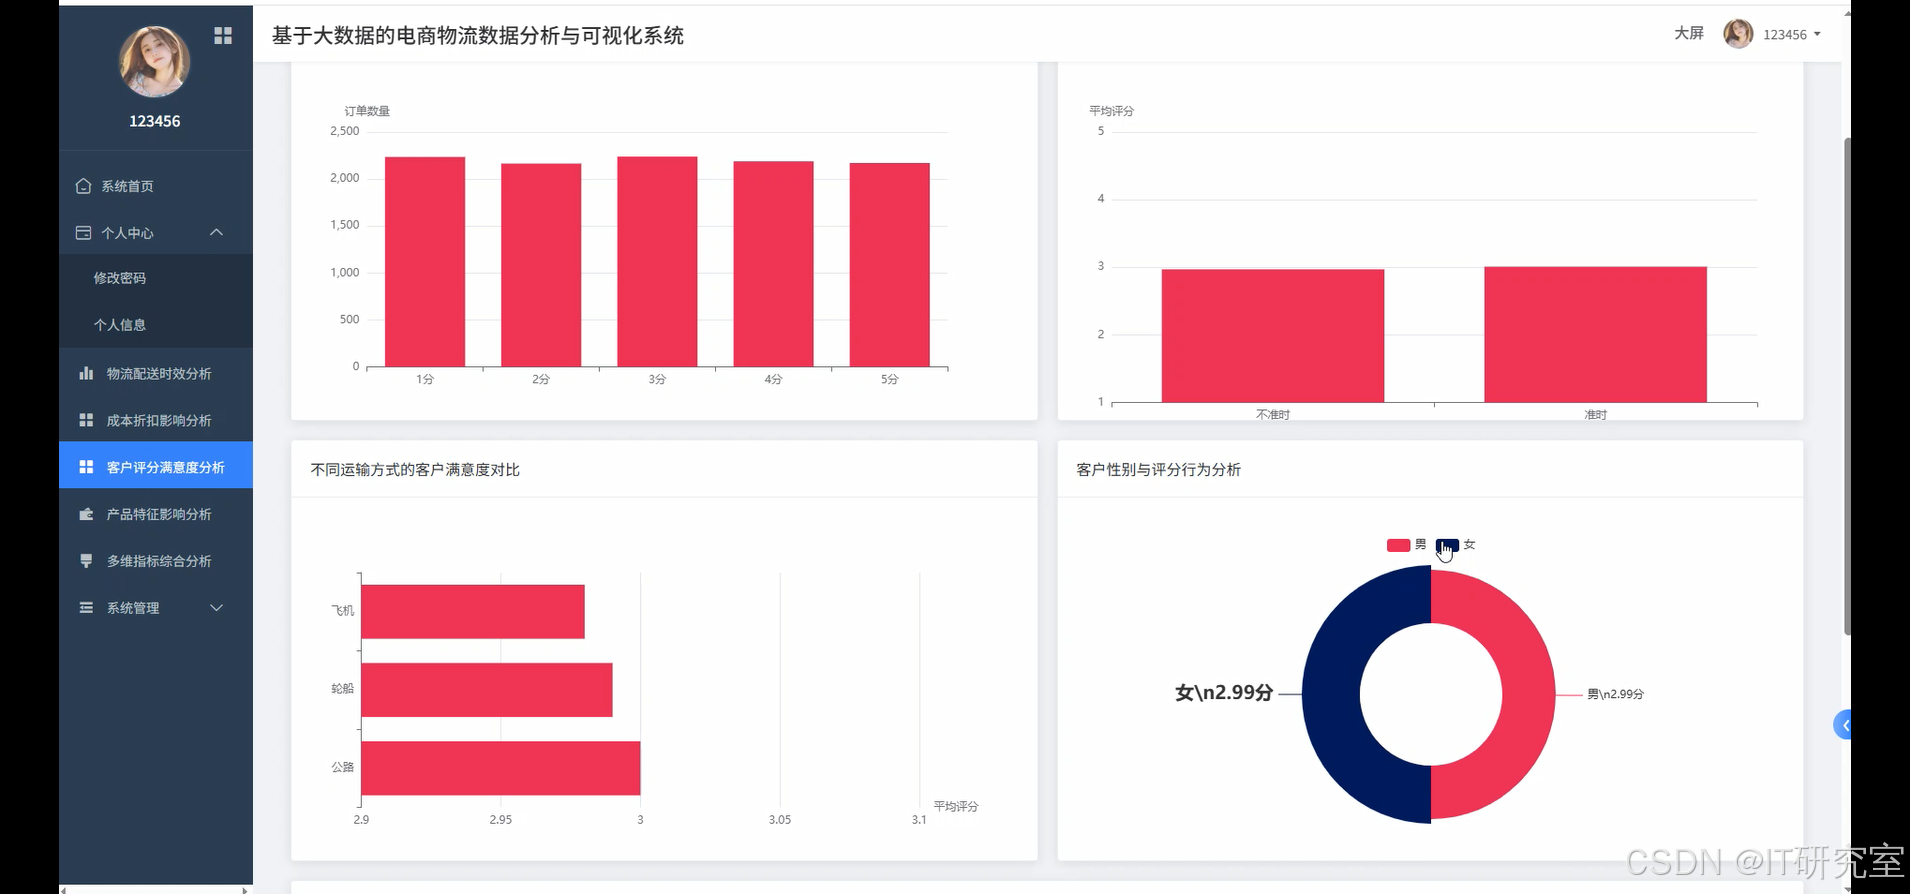
def customer_satisfaction_prediction(request):
df = spark.read.csv("/data/eCommerce.csv", header=True, inferSchema=True)
customer_data = df.filter(col("Customer_rating").isNotNull())
rating_distribution = customer_data.groupBy("Customer_rating").agg(
count("*").alias("rating_count")
).orderBy("Customer_rating")
ontime_rating_correlation = customer_data.groupBy("Reached.on.Time_Y.N").agg(
avg("Customer_rating").alias("avg_rating"),
count("*").alias("sample_size")
)
gender_behavior = customer_data.groupBy("Gender").agg(
avg("Customer_rating").alias("avg_rating"),
avg("Prior_purchases").alias("avg_purchases"),
count("*").alias("customer_count")
)
pandas_df = customer_data.select("Customer_rating", "Reached.on.Time_Y.N", "Cost_of_the_Product",
"Discount_offered", "Weight_in_gms", "Customer_care_calls",
"Prior_purchases").toPandas()
feature_columns = ["Reached.on.Time_Y.N", "Cost_of_the_Product", "Discount_offered",
"Weight_in_gms", "Customer_care_calls", "Prior_purchases"]
X = pandas_df[feature_columns].fillna(pandas_df[feature_columns].mean())
y = pandas_df["Customer_rating"].fillna(pandas_df["Customer_rating"].median())
rf_model = RandomForestClassifier(n_estimators=100, random_state=42)
rf_model.fit(X, y)
feature_importance = dict(zip(feature_columns, rf_model.feature_importances_))
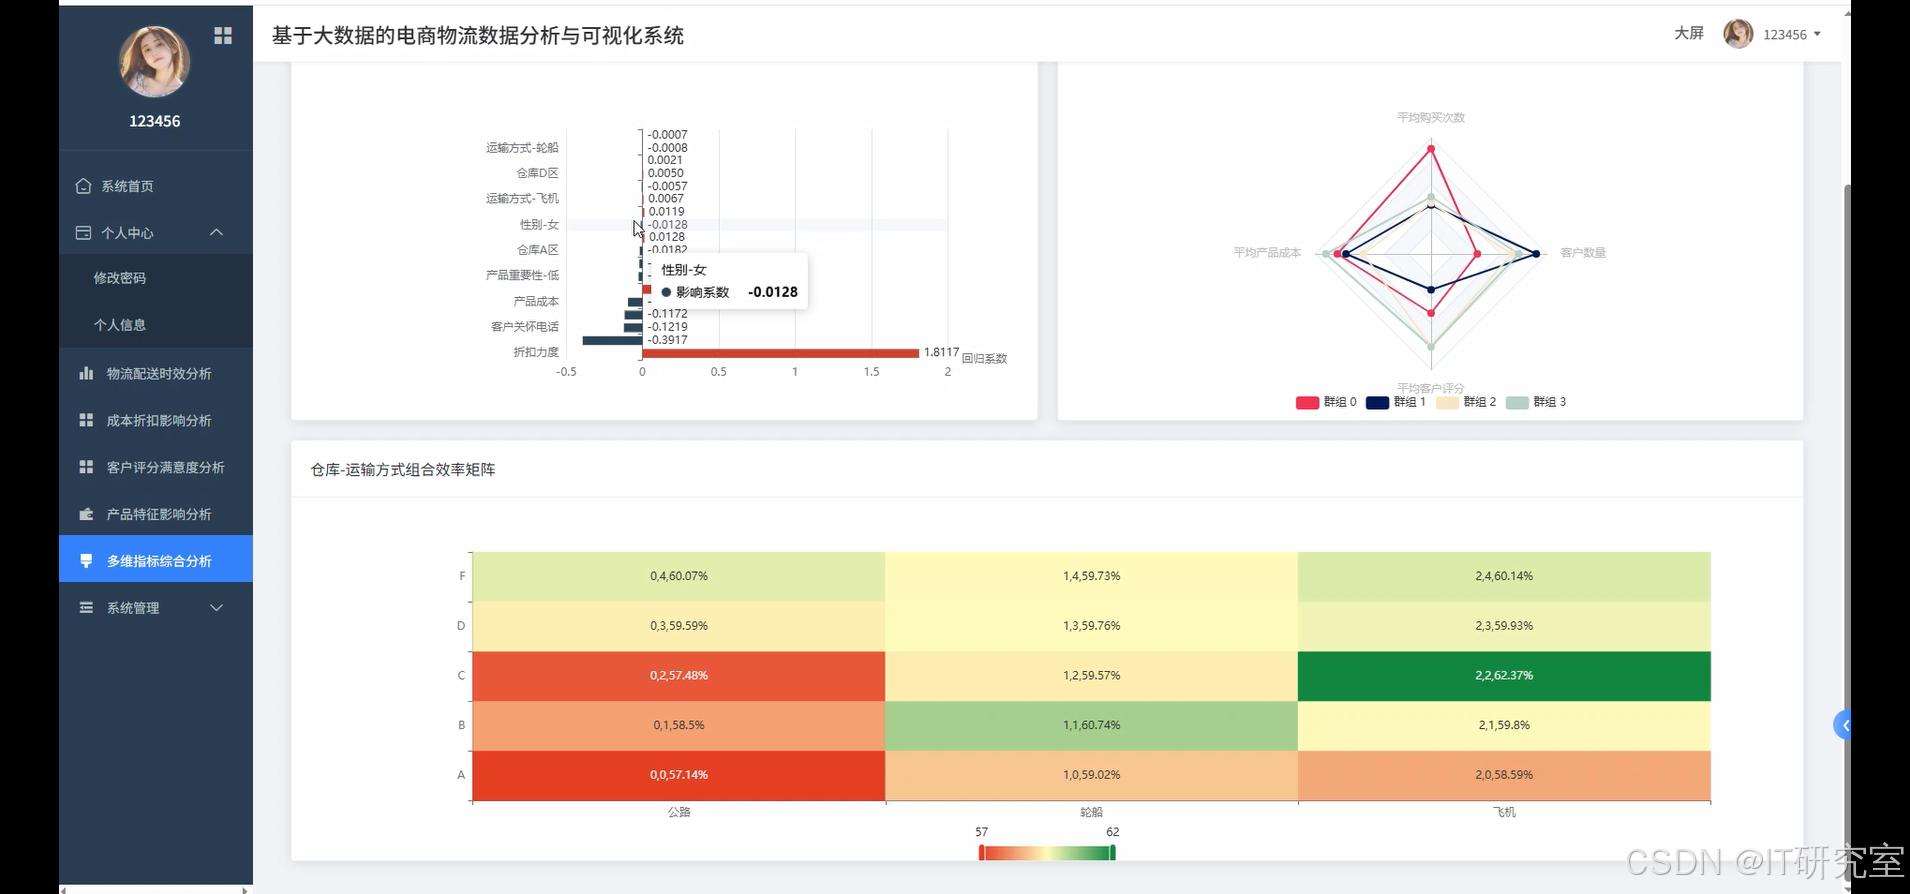
satisfaction_segments = customer_data.withColumn("satisfaction_level",
when(col("Customer_rating") >= 4, "高满意度")
.when(col("Customer_rating") >= 3, "中等满意度")
.otherwise("低满意度")
).groupBy("satisfaction_level", "Mode_of_Shipment").agg(
count("*").alias("segment_count"),
avg("Cost_of_the_Product").alias("avg_spending")
)
clustering_features = pandas_df[["Customer_rating", "Prior_purchases", "Cost_of_the_Product"]].fillna(0)
kmeans = KMeans(n_clusters=3, random_state=42)
cluster_labels = kmeans.fit_predict(clustering_features)
clustering_results = pd.DataFrame({
'cluster': cluster_labels,
'rating': pandas_df["Customer_rating"],
'purchases': pandas_df["Prior_purchases"],
'spending': pandas_df["Cost_of_the_Product"]
}).groupby('cluster').agg({
'rating': 'mean',
'purchases': 'mean',
'spending': 'mean'
}).round(2)
return JsonResponse({
'rating_distribution': rating_distribution.collect(),
'ontime_correlation': ontime_rating_correlation.collect(),
'gender_analysis': gender_behavior.collect(),
'feature_importance': feature_importance,
'satisfaction_segments': satisfaction_segments.collect(),
'customer_clusters': clustering_results.to_dict('index')
})五、系统视频
基于大数据的电商物流数据分析与可视化系统项目视频:
大数据毕业设计选题推荐-基于大数据的电商物流数据分析与可视化系统-Spark-Hadoop-Bigdata
结语
大数据毕业设计选题推荐-基于大数据的电商物流数据分析与可视化系统-Spark-Hadoop-Bigdata
想看其他类型的计算机毕业设计作品也可以和我说~谢谢大家!
有技术这一块问题大家可以评论区交流或者私我~
大家可以帮忙点赞、收藏、关注、评论啦~
源码获取:⬇⬇⬇