这是一个示例代码,主要是展示算法思路以及实现:

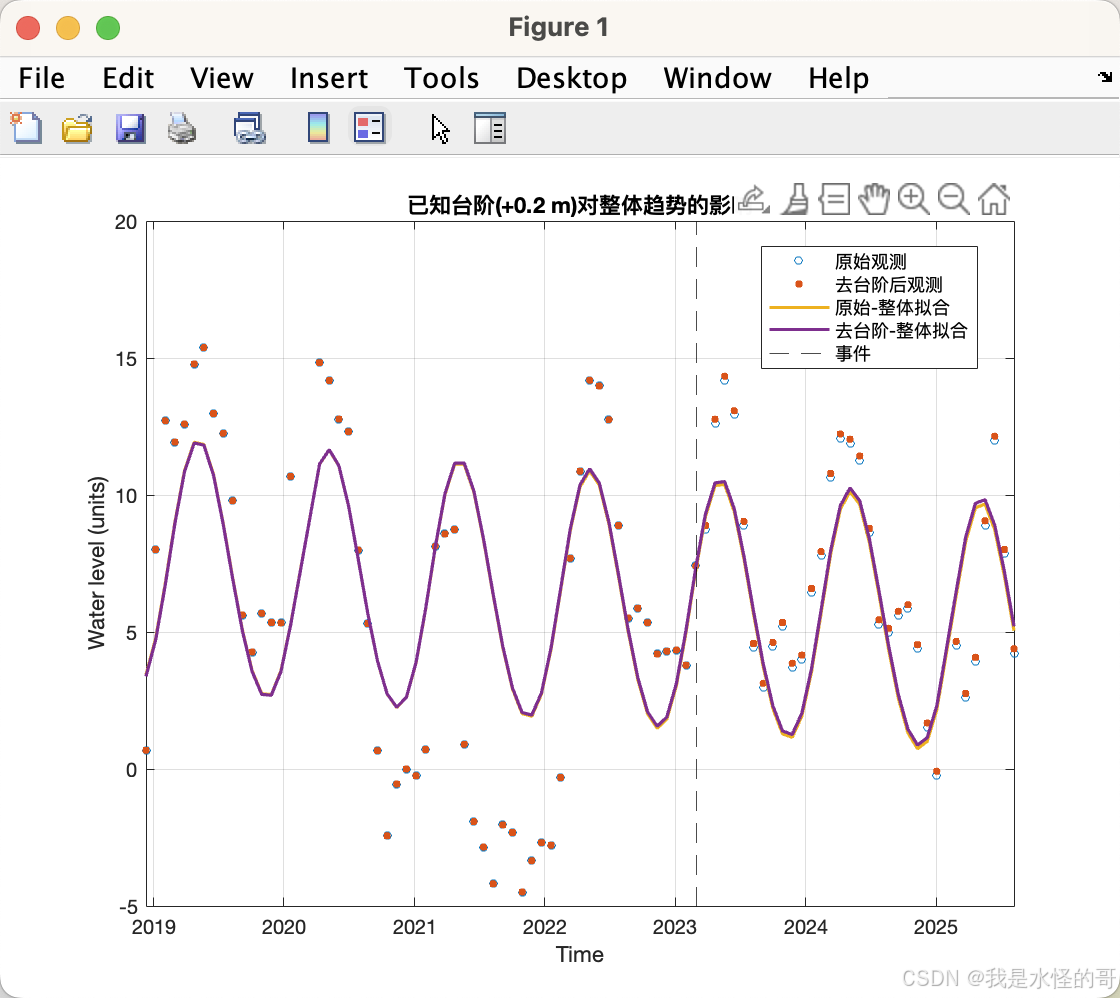
问题描述:在湖泊水位变化中,在特定的时间点增加一个阶跃,然后计算前后的水位长期趋势。
matlab程序实现:
%% Chistrong Wen
%% Stuttgart, Germany
%% 20250902 14:06
%% 已知台阶对整体长期趋势的影响(P2O1 + WLS, 传递观测σ)
clear; clc;
% ===== 数据:日期yyyymmdd, 值, sigma =====
D = [...
20181211	0.68	0.042
20190107	8.01	0.042
20190203	12.71	0.042
20190302	11.93	0.043
20190329	12.59	0.046
20190425	14.78	0.044
20190522	15.38	0.103
20190618	12.97	0.052
20190715	12.25	0.042
20190811	9.79	0.043
20190907	5.62	0.055
20191004	4.27	0.519
20191031	5.68	0.043
20191127	5.35	0.044
20191224	5.33	0.063
20200120	10.68	0.043
20200410	14.83	0.225
20200507	14.18	0.053
20200603	12.77	0.043
20200630	12.31	0.103
20200727	7.99	0.042
20200823	5.31	0.043
20200919	0.67	0.057
20201016	-2.44	0.042
20201112	-0.55	0.042
20201209	0	0.042
20210105	-0.25	0.046
20210201	0.71	0.086
20210228	8.13	0.044
20210327	8.58	0.052
20210423	8.74	0.05
20210520	0.9	0.042
20210616	-1.92	0.063
20210713	-2.85	0.068
20210809	-4.19	0.064
20210905	-2.04	0.108
20211002	-2.32	0.042
20211029	-4.49	0.042
20211125	-3.35	0.042
20211222	-2.69	0.163
20220118	-2.78	0.044
20220214	-0.31	0.042
20220313	7.69	0.058
20220409	10.87	0.046
20220506	14.19	0.181
20220602	13.98	0.059
20220629	12.75	0.044
20220726	8.89	0.064
20220822	5.51	0.052
20220918	5.87	0.079
20221015	5.34	0.042
20221111	4.2	0.043
20221208	4.3	0.049
20230104	4.34	0.045
20230131	3.79	0.057
20230227	7.42	0.045
20230326	8.73	0.064
20230422	12.61	0.042
20230519	14.18	0.055
20230615	12.92	0.085
20230712	8.88	0.068
20230808	4.42	0.062
20230904	2.97	0.101
20231001	4.46	0.047
20231028	5.19	0.042
20231124	3.7	0.044
20231221	4	0.368
20240117	6.43	0.042
20240213	7.78	0.042
20240311	10.63	0.061
20240407	12.07	0.042
20240504	11.88	0.044
20240531	11.27	0.057
20240627	8.62	0.049
20240724	5.29	0.084
20240820	4.98	0.082
20240916	5.6	0.05
20241013	5.84	0.043
20241109	4.38	0.042
20241206	1.52	0.044
20250102	-0.24	0.043
20250225	4.5	0.044
20250324	2.6	0.071
20250420	3.92	0.042
20250517	8.9	0.046
20250613	11.99	0.075
20250710	7.85	0.066
20250806	4.23	0.057];

dateInt = D(:,1); y = D(:,2); sigma = D(:,3);
t  = datetime(string(dateInt),'InputFormat','yyyyMMdd');
tt = decyear_local(t);                   % 十进制年

% ===== 已知台阶:事件日、幅度(正值=抬升)=====
eventDate = datetime(2023,3,1);
shift_val = 0.157;                         % m(示例)
H = double(t >= eventDate);               % 事件后的指示向量

% ===== 构造 P2O1 的 WLS 设计矩阵(cos/sin+常数+线性)=====
[G,omega] = design_P2O1(tt);

W = diag(1./(sigma.^2));                  % WLS 权

% ===== 原始整体趋势(含台阶)=====
[m0, se0, CovB0] = wls_fit_trend(G, W, y);      % m0: [A1c,A1s,A2c,A2s,offset,trend]的线性系数形式
trend_raw  = se_struct(m0, se0).trend;          % 仅用于展示;下行直接取
slope_raw  = m0(6);  se_slope_raw = se0(6);

% ===== 去台阶:把已知 +shift 从事件后加上,再整体拟合 =====
y_corr = y + shift_val * H;
[mc, sec, CovBc] = wls_fit_trend(G, W, y_corr);
slope_corr  = mc(6);  se_slope_corr = sec(6);

% ===== 台阶对"整体趋势"的影响:解析量(精确)=====
% β_hat = (G'WG)^{-1} G'W y
% 去台阶等于 y' = y - s*H  =>  β_hat' - β_hat = -(G'WG)^{-1}G'W (s*H)
K = (G'*(W*G)) \ (G'*(W*H));       % 6x1
delta_slope_exact = -shift_val * K(6);      % 精确改变量(去台阶 - 原始)

% ===== 数值复核 =====
delta_slope_numeric = slope_corr - slope_raw;

% ===== 输出 =====
ci95 = @(s, se) [s - 1.96*se, s + 1.96*se];
ci_raw = ci95(slope_raw, se_slope_raw);
ci_cor = ci95(slope_corr, se_slope_corr);

fprintf('\n=== 已知台阶对整体长期趋势的影响(P2O1 + WLS) ===\n');
fprintf('原始(含台阶): trend = %.4f ± %.4f /yr   (95%%CI [%.4f, %.4f])\n', ...
        slope_raw, se_slope_raw, ci_raw(1), ci_raw(2));
fprintf('去除台阶后 : trend = %.4f ± %.4f /yr   (95%%CI [%.4f, %.4f])\n', ...
        slope_corr, se_slope_corr, ci_cor(1), ci_cor(2));
fprintf('台阶对趋势的影响(解析, 去台阶-原始) = %.4f /yr\n', delta_slope_exact);
fprintf('数值复核(去台阶-原始)              = %.4f /yr\n\n', delta_slope_numeric);

% =====(可选)画图 =====
yhat_raw = G*m0;
yhat_cor = G*mc;
figure('Color','w'); hold on; box on; grid on;
plot(t, y, 'o','MarkerSize',4,'DisplayName','原始观测');
plot(t, y_corr, '.', 'MarkerSize',10,'DisplayName','去台阶后观测');
plot(t, yhat_raw, '-', 'LineWidth',1.6,'DisplayName','原始-整体拟合');
plot(t, yhat_cor, '-', 'LineWidth',1.6,'DisplayName','去台阶-整体拟合');
xline(eventDate,'k--','DisplayName','事件');
xlabel('Time'); ylabel('Water level (units)');
title(sprintf('已知台阶(+%.1f m)对整体趋势的影响', shift_val));
legend('Location','best');

%% ===== 函数区 =====
function ydec = decyear_local(t)
Y = year(t); t0 = datetime(Y,1,1); t1 = datetime(Y+1,1,1);
ydec = Y + days(t - t0)./days(t1 - t0);
end

% P2O1 设计矩阵(与你模型一致:年/半年余弦、正弦 + 常数 + 线性tt)
function [G,omega] = design_P2O1(tt)
Tperiod = [1, 0.5];
omega   = 2*pi./Tperiod;
G       = zeros(numel(tt),6);
G(:,1)  = cos(omega(1)*tt);
G(:,2)  = sin(omega(1)*tt);
G(:,3)  = cos(omega(2)*tt);
G(:,4)  = sin(omega(2)*tt);
G(:,5)  = 1;
G(:,6)  = tt(:);
end

% WLS 求解 + 参数标准差
function [m_lin, se_lin, CovB] = wls_fit_trend(G, W, y)
A    = G'*(W*G);
b    = G'*(W*y);
m_lin= A \ b;                                  % 线性系数:cos, sin, cos, sin, offset, trend
res  = y - G*m_lin;
dof  = numel(y) - size(G,2);
s2   = (res' * (W*res)) / dof;                 % 加权残差方差
CovB = s2 * inv(A);                            % 参数协方差
se_lin= sqrt(diag(CovB));                      % 1σ
end

% 仅用于展示把线性系数转为"幅相+offset+trend"的结构(趋势直接用线性第6个)
function S = se_struct(m_lin, se_lin)
S.trend = m_lin(6); S.se_trend = se_lin(6);
end
运行结果:
=== 已知台阶对整体长期趋势的影响(P2O1 + WLS) ===
原始(含台阶): trend = -0.3794 ± 0.2189 /yr (95%CI -0.8084, 0.0497)
去除台阶后 : trend = -0.3483 ± 0.2198 /yr (95%CI -0.7791, 0.0825)
台阶对趋势的影响(解析, 去台阶-原始) = -0.0311 /yr
数值复核(去台阶-原始) = 0.0311 /yr
❤️欢迎点赞收藏❤️