安装过程
Dashboard 是基于网页的 Kubernetes 管理界面,可以帮助你更直观的管理 k8s。
安装最新版本 Dashboard UI 需要用到工具 helm,官网地址:Helm | 安装Helm,按照其中指示安装好 helm,Helm 是 Kubernetes 应用程序的包管理器,相当于 Debian 中的 apt。
然后通过如下指令安装 Dashboard UI
# Add kubernetes-dashboard repository
helm repo add kubernetes-dashboard https://kubernetes.github.io/dashboard/
# Deploy a Helm Release named "kubernetes-dashboard" using the kubernetes-dashboard chart
helm upgrade --install kubernetes-dashboard kubernetes-dashboard/kubernetes-dashboard --create-namespace --namespace kubernetes-dashboard
最后使用指令开启访问
kubectl -n kubernetes-dashboard port-forward svc/kubernetes-dashboard-kong-proxy 8443:443之后你就可以用 https://localhost:8443 访问 Dashboard UI 了。注意,当你仅用默认指令时,只能通过 localhost 访问。
如果你镜像下载不下来,那么可以参考我的手动方案:
-
从官方 github 下载 dashboard.yaml,或者参考附录《dashboard.yaml 内容》
-
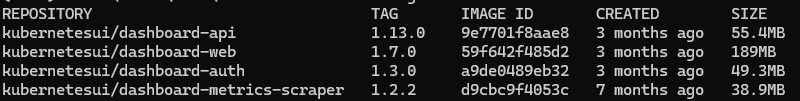
从这个 yaml 文件中,可以直接看到需要下载4个镜像,跟之前一样,翻墙或者找到替换源,下载之后打上私有 tag 推送到 nexus 中,然后将 ashboard.yaml 文件中的 image 换成私有的
-
另外,虽然 ashboard.yaml 中不能直接看到,但是它还使用的 kong-gateway 这个插件,翻墙出去下载 docker pull kong/kong-gateway:3.11.0.2 打上私有 tag,然后修改 dashboard.yaml 中的相关配置
kong:
enabled: true增加自定义 image
image:
repository: walii.nexus.repo/kong-gateway
tag: 3.11.0.2
然后就可以正常安装了,但是后面要加上 -f 参数
helm upgrade --install kubernetes-dashboard kubernetes-dashboard/kubernetes-dashboard --create-namespace --namespace kubernetes-dashboard -f dashboard.yaml此外,github 有时候时灵时不灵的,安装时 helm 可以指定本地文件进行安装,如果你之前成功下载过相关包,会还存在 ~/.cache/helm/repository/ 目录下,指令修改为:
helm upgrade --install kubernetes-dashboard ~/.cache/helm/repository/kubernetes-dashboard-7.13.0.tgz --create-namespace --namespace kubernetes-dashboard -f dashboard.yaml- 配置内网访问
允许 Dashboard UI 内网访问之前,你需要对其创建一个用户。建立一个 yaml 文件(假设叫 create-user.yaml),内容如下:
apiVersion: v1
kind: ServiceAccount
metadata:
  name: admin-user
  namespace: kubernetes-dashboard
---
apiVersion: rbac.authorization.k8s.io/v1
kind: ClusterRoleBinding
metadata:
  name: admin-user
roleRef:
  apiGroup: rbac.authorization.k8s.io
  kind: ClusterRole
  name: cluster-admin
subjects:
- kind: ServiceAccount
  name: admin-user
  namespace: kubernetes-dashboard
然后执行指令:
# 创建用户与角色信息
kubectl apply -f create-user.yaml

# 生成 token
kubectl -n kubernetes-dashboard create token admin-user
复制并保存好这个 token,后面登录要用。注意这个 token 是临时的,默认有效时间1小时,下次要登录时需要重新生成 token。
内网暴露地址:
执行指令修改 Dashboard 的 Service 类型为 NodePort
kubectl patch svc kubernetes-dashboard-kong-proxy -n kubernetes-dashboard -p '{"spec":{"type":"NodePort"}}'做完这些,Dashboard 就能内网访问了,最后你需要通过指令
kubectl get svc -n kubernetes-dashboard查看一下 Dashboard 被分配的端口
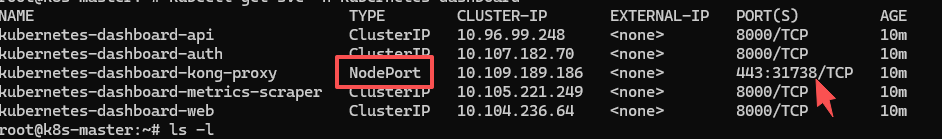
然后通过浏览器 https://<ip>:31738 即可打开页面,然后输入 token 就能登录进去了。
附录
dashboard.yaml 内容
# Copyright 2017 The Kubernetes Authors.
#
# Licensed under the Apache License, Version 2.0 (the "License");
# you may not use this file except in compliance with the License.
# You may obtain a copy of the License at
#
# http://www.apache.org/licenses/LICENSE-2.0
#
# Unless required by applicable law or agreed to in writing, software
# distributed under the License is distributed on an "AS IS" BASIS,
# WITHOUT WARRANTIES OR CONDITIONS OF ANY KIND, either express or implied.
# See the License for the specific language governing permissions and
# limitations under the License.

# General configuration shared across resources
app:
  # Mode determines if chart should deploy a full Dashboard with all containers or just the API.
  # - dashboard - deploys all the containers
  # - api - deploys just the API
  mode: 'dashboard'
  image:
    pullPolicy: IfNotPresent
    pullSecrets: []
  scheduling:
    # Node labels for pod assignment
    # Ref: https://kubernetes.io/docs/concepts/scheduling-eviction/assign-pod-node/
    nodeSelector: {}
  security:
    # Allow overriding csrfKey used by API/Auth containers.
    # It has to be base64 encoded random 256 bytes string.
    # If empty, it will be autogenerated.
    csrfKey: ~
    # SecurityContext to be added to pods
    # To disable set the following configuration to null:
    # securityContext: null
    securityContext:
      runAsNonRoot: true
      seccompProfile:
        type: RuntimeDefault
    # ContainerSecurityContext to be added to containers
    # To disable set the following configuration to null:
    # containerSecurityContext: null
    containerSecurityContext:
      allowPrivilegeEscalation: false
      readOnlyRootFilesystem: true
      runAsUser: 1001
      runAsGroup: 2001
      capabilities:
        drop: ["ALL"]
    # Pod Disruption Budget configuration
    # Ref: https://kubernetes.io/docs/tasks/run-application/configure-pdb/
    podDisruptionBudget:
      enabled: false
      minAvailable: 0
      maxUnavailable: 0
    networkPolicy:
      enabled: false
      ingressDenyAll: false
      # Raw network policy spec that overrides predefined spec
      # Example:
      # spec:
      #   egress:
      #     - ports:
      #         - port: 123
      spec: {}

  # Common labels & annotations shared across all deployed resources
  labels: {}
  annotations: {}
  # Common priority class used for all deployed resources
  priorityClassName: null
  settings:
    ## Global dashboard settings
    global:
    #  # Cluster name that appears in the browser window title if it is set
    #  clusterName: ""
    #  # Max number of items that can be displayed on each list page
    #  itemsPerPage: 10
    #  # Max number of labels that are displayed by default on most views.
    #  labelsLimit: 3
    #  # Number of seconds between every auto-refresh of logs
    #  logsAutoRefreshTimeInterval: 5
    #  # Number of seconds between every auto-refresh of every resource. Set 0 to disable
    #  resourceAutoRefreshTimeInterval: 10
    #  # Hide all access denied warnings in the notification panel
    #  disableAccessDeniedNotifications: false
    #  # Hide all namespaces option in namespace selection dropdown to avoid accidental selection in large clusters thus preventing OOM errors
    #  hideAllNamespaces: false
    #  # Namespace that should be selected by default after logging in.
    #  defaultNamespace: default
    #  # List of namespaces that should be presented to user without namespace list privileges.
    #  namespaceFallbackList:
    #  - default
    ## Pinned resources that will be displayed in dashboard's menu
    pinnedResources: []
    # - kind: customresourcedefinition
    #  #  Fully qualified name of a CRD
    #  name: prometheus.monitoring.coreos.com
    #  #  Display name
    #  displayName: Prometheus
    #  #  Is this CRD namespaced?
    #  namespaced: true
  ingress:
    enabled: false
    hosts:
      # Keep 'localhost' host only if you want to access Dashboard using 'kubectl port-forward ...' on:
      # https://localhost:8443
            - localhost
    # - kubernetes.dashboard.domain.com
    ingressClassName: internal-nginx
    # Use only if your ingress controllers support default ingress classes.
    # If set to true ingressClassName will be ignored and not added to the Ingress resources.
    # It should fall back to using IngressClass marked as the default.
    useDefaultIngressClass: false
    # This will append our Ingress with annotations required by our default configuration.
    #    nginx.ingress.kubernetes.io/backend-protocol: "HTTPS"
    #    nginx.ingress.kubernetes.io/ssl-passthrough: "true"
    #    nginx.ingress.kubernetes.io/ssl-redirect: "true"
    useDefaultAnnotations: true
    pathType: ImplementationSpecific
    # If path is not the default (/), rewrite-target annotation will be added to the Ingress.
    # It allows serving Kubernetes Dashboard on a sub-path. Make sure that the configured path
    # does not conflict with gateway route configuration.
    path: /
    issuer:
      name: selfsigned
      # Scope determines what kind of issuer annotation will be used on ingress resource
      # - default - adds 'cert-manager.io/issuer'
      # - cluster - adds 'cert-manager.io/cluster-issuer'
      # - disabled - disables cert-manager annotations
      scope: default
    tls:
      enabled: true
      # If provided it will override autogenerated secret name
      secretName: ""
    labels: {}
    annotations: {}
  # Use the following toleration if Dashboard can be deployed on a tainted control-plane nodes
  # - key: node-role.kubernetes.io/control-plane
  #   effect: NoSchedule
  tolerations: []
  affinity: {}

auth:
  role: auth
  image:
    repository: walli.nexus.repo/dashboard-auth  # 修改为自己的源
    tag: 1.3.0
  scaling:
    replicas: 1
    revisionHistoryLimit: 10
  service:
    type: ClusterIP
    extraSpec: ~
  containers:
    ports:
      - name: auth
        containerPort: 8000
        protocol: TCP
    args: []
    env: []
    volumeMounts:
      - mountPath: /tmp
        name: tmp-volume
    # TODO: Validate configuration
    resources:
      requests:
        cpu: 100m
        memory: 200Mi
      limits:
        cpu: 250m
        memory: 400Mi
  automountServiceAccountToken: true
  volumes:
    # Create on-disk volume to store exec logs (required)
    - name: tmp-volume
      emptyDir: {}
  nodeSelector: {}
  # Labels & annotations for Auth related resources
  labels: {}
  annotations: {}
  serviceLabels: {}
  serviceAnnotations: {}

# API deployment configuration
api:
  role: api
  image:
    repository: walli.nexus.repo/dashboard-api # 修改为自己的源
    tag: 1.13.0
  scaling:
    replicas: 1
    revisionHistoryLimit: 10
  service:
    type: ClusterIP
    extraSpec: ~
  containers:
    ports:
      - name: api
        containerPort: 8000
        protocol: TCP
    # Additional container arguments
    # Full list of arguments: https://github.com/kubernetes/dashboard/blob/master/docs/common/arguments.md
    # args:
    # - --system-banner="Welcome to the Kubernetes Dashboard"
    args: []
    # Additional container environment variables
    # env:
    # - name: SOME_VAR
    #   value: 'some value'
    env: []
    # Additional volume mounts
    # - mountPath: /kubeconfig
    #   name: dashboard-kubeconfig
    #   readOnly: true
    volumeMounts:
      # Create volume mount to store exec logs (required)
      - mountPath: /tmp
        name: tmp-volume
    # TODO: Validate configuration
    resources:
      requests:
        cpu: 100m
        memory: 200Mi
      limits:
        cpu: 250m
        memory: 400Mi
  automountServiceAccountToken: true
  # Additional volumes
  # - name: dashboard-kubeconfig
  #   secret:
  #     defaultMode: 420
  #     secretName: dashboard-kubeconfig
  volumes:
    # Create on-disk volume to store exec logs (required)
    - name: tmp-volume
      emptyDir: {}
  nodeSelector: {}
  # Labels & annotations for API related resources
  labels: {}
  annotations: {}
  serviceLabels: {}
  serviceAnnotations: {}

# WEB UI deployment configuration
web:
  role: web
  image:
    repository: walli.nexus.repo/dashboard-web # 修改为自己的源
    tag: 1.7.0
  scaling:
    replicas: 1
    revisionHistoryLimit: 10
  service:
    type: ClusterIP
    extraSpec: ~
  containers:
    ports:
      - name: web
        containerPort: 8000
        protocol: TCP
    # Additional container arguments
    # Full list of arguments: https://github.com/kubernetes/dashboard/blob/master/docs/common/arguments.md
    # args:
    # - --system-banner="Welcome to the Kubernetes Dashboard"
    args: []
    # Additional container environment variables
    # env:
    # - name: SOME_VAR
    #   value: 'some value'
    env: []
    # Additional volume mounts
    # - mountPath: /kubeconfig
    #   name: dashboard-kubeconfig
    #   readOnly: true
    volumeMounts:
      # Create volume mount to store logs (required)
      - mountPath: /tmp
        name: tmp-volume
    # TODO: Validate configuration
    resources:
      requests:
        cpu: 100m
        memory: 200Mi
      limits:
        cpu: 250m
        memory: 400Mi
  automountServiceAccountToken: true
  # Additional volumes
  # - name: dashboard-kubeconfig
  #   secret:
  #     defaultMode: 420
  #     secretName: dashboard-kubeconfig
  volumes:
    # Create on-disk volume to store exec logs (required)
    - name: tmp-volume
      emptyDir: {}
  nodeSelector: {}
  # Labels & annotations for WEB UI related resources
  labels: {}
  annotations: {}
  serviceLabels: {}
  serviceAnnotations: {}

### Metrics Scraper
### Container to scrape, store, and retrieve a window of time from the Metrics Server.
### refs: https://github.com/kubernetes/dashboard/tree/master/modules/metrics-scraper
metricsScraper:
  enabled: true
  role: metrics-scraper
  image:
    repository: walli.nexus.repo/dashboard-metrics-scraper # 修改为自己的源
    tag: 1.2.2
  scaling:
    replicas: 1
    revisionHistoryLimit: 10
  service:
    type: ClusterIP
    extraSpec: ~
  containers:
    ports:
      - containerPort: 8000
        protocol: TCP
    args: []
    # Additional container environment variables
    # env:
    # - name: SOME_VAR
    #   value: 'some value'
    env: []
    # Additional volume mounts
    # - mountPath: /kubeconfig
    #   name: dashboard-kubeconfig
    #   readOnly: true
    volumeMounts:
      # Create volume mount to store logs (required)
      - mountPath: /tmp
        name: tmp-volume
    # TODO: Validate configuration
    resources:
      requests:
        cpu: 100m
        memory: 200Mi
      limits:
        cpu: 250m
        memory: 400Mi
    livenessProbe:
      httpGet:
        scheme: HTTP
        path: /
        port: 8000
      initialDelaySeconds: 30
      timeoutSeconds: 30
  automountServiceAccountToken: true
  # Additional volumes
  # - name: dashboard-kubeconfig
  #   secret:
  #     defaultMode: 420
  #     secretName: dashboard-kubeconfig
  volumes:
    - name: tmp-volume
      emptyDir: {}
  nodeSelector: {}
  # Labels & annotations for Metrics Scraper related resources
  labels: {}
  annotations: {}
  serviceLabels: {}
  serviceAnnotations: {}

## Optional Metrics Server sub-chart configuration
## Enable this if you don't already have metrics-server enabled on your cluster and
## want to use it with dashboard metrics-scraper
## refs:
##  - https://github.com/kubernetes-sigs/metrics-server
##  - https://github.com/kubernetes-sigs/metrics-server/tree/master/charts/metrics-server
metrics-server:
  enabled: false
  args:
    - --kubelet-preferred-address-types=InternalIP
    - --kubelet-insecure-tls

## Required Kong sub-chart with DBless configuration to act as a gateway
## for our all containers.
kong:
  enabled: true
  image:
    repository: walli.nexus.repo/kong-gateway # 修改为自己的源
    tag: 3.11.0.2
  ## Configuration reference: https://docs.konghq.com/gateway/3.6.x/reference/configuration
  env:
    dns_order: LAST,A,CNAME,AAAA,SRV
    plugins: 'off'
    nginx_worker_processes: 1
  ingressController:
    enabled: false
  manager:
    enabled: false
  dblessConfig:
    configMap: kong-dbless-config
  proxy:
    type: ClusterIP
    http:
      enabled: false

## Optional Cert Manager sub-chart configuration
## Enable this if you don't already have cert-manager enabled on your cluster.
cert-manager:
  enabled: false
  installCRDs: true

## Optional Nginx Ingress sub-chart configuration
## Enable this if you don't already have nginx-ingress enabled on your cluster.
nginx:
  enabled: false
  controller:
    electionID: ingress-controller-leader
    ingressClassResource:
      name: internal-nginx
      default: false
      controllerValue: k8s.io/internal-ingress-nginx
    service:
      type: ClusterIP

## Extra configurations:
## - manifests
## - predefined roles
## - prometheus
## - etc...
extras:
  # Extra Kubernetes manifests to be deployed
  # manifests:
  # - apiVersion: v1
  #   kind: ConfigMap
  #   metadata:
  #     name: additional-configmap
  #   data:
  #     mykey: myvalue
  manifests: []
  serviceMonitor:
    # Whether to create a Prometheus Operator service monitor.
    enabled: false
    # Here labels can be added to the serviceMonitor
    labels: {}
    # Here annotations can be added to the serviceMonitor
    annotations: {}
    # metrics.serviceMonitor.metricRelabelings Specify Metric Relabelings to add to the scrape endpoint
    # ref: https://github.com/coreos/prometheus-operator/blob/master/Documentation/api.md#relabelconfig
    metricRelabelings: []
    # metrics.serviceMonitor.relabelings [array] Prometheus relabeling rules
    relabelings: []
    # ServiceMonitor connection scheme. Defaults to HTTPS.
    scheme: https
    # ServiceMonitor connection tlsConfig. Defaults to {insecureSkipVerify:true}.
    tlsConfig:
      insecureSkipVerify: true