结果
可以看出数据标准后的预测效果明显好于未进行数据标准化
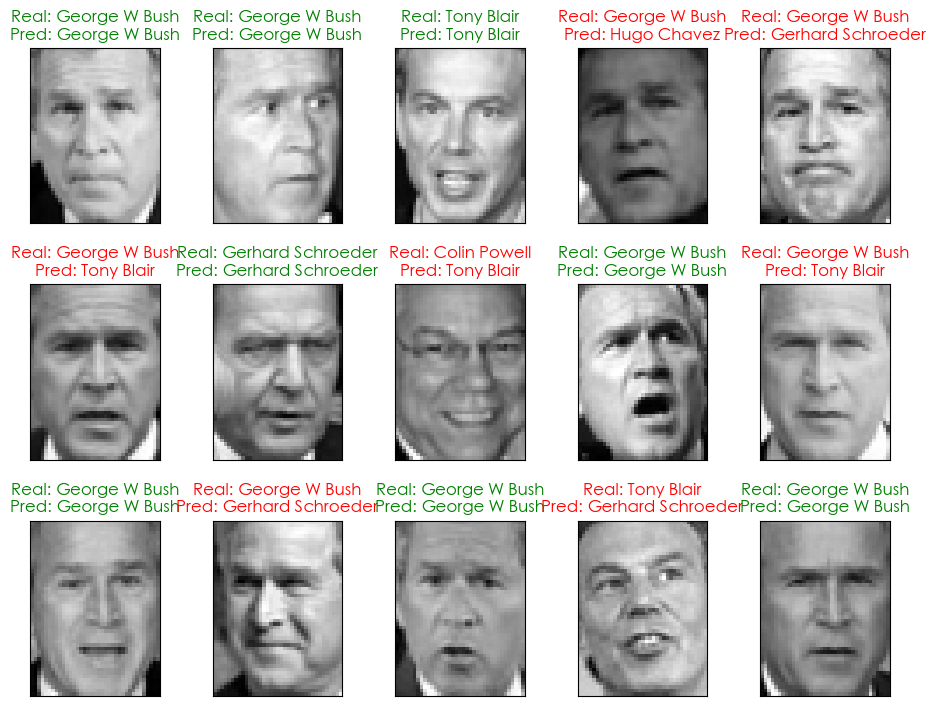
数据标准化前的模型预测结果
绿色为预测正确,红色为预测错误
                   precision    recall  f1-score   support

     Ariel Sharon       0.17      0.69      0.28        13
     Colin Powell       0.62      0.27      0.37        60
  Donald Rumsfeld       0.48      0.52      0.50        27
    George W Bush       0.81      0.41      0.55       146
Gerhard Schroeder       0.32      0.48      0.39        25
      Hugo Chavez       0.20      0.73      0.31        15
       Tony Blair       0.42      0.56      0.48        36

         accuracy                           0.44       322
        macro avg       0.43      0.52      0.41       322
     weighted avg       0.61      0.44      0.47       322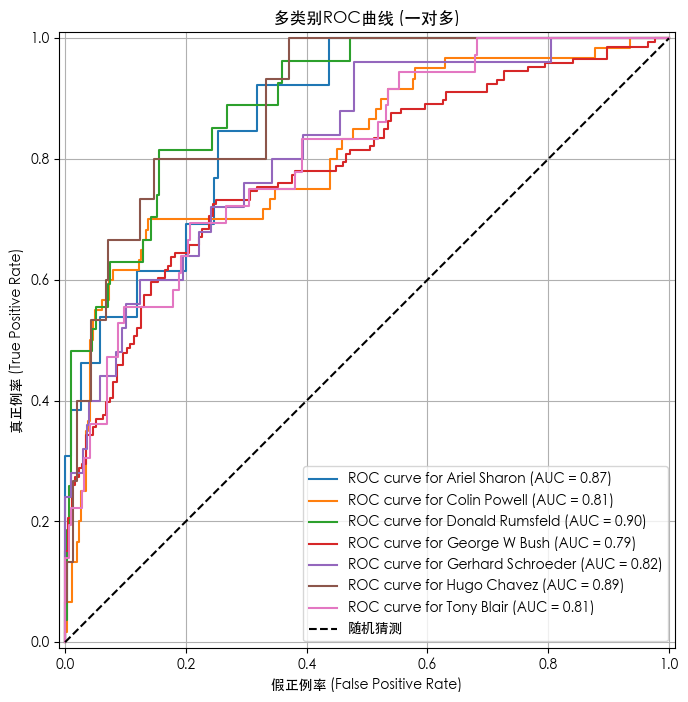
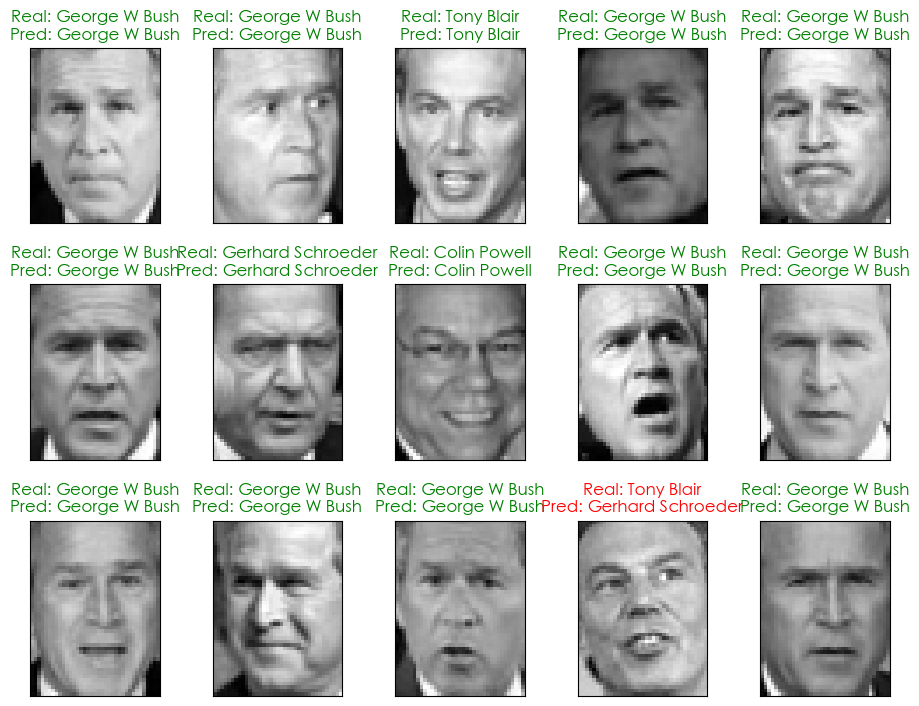
数据标准化后的模型预测结果
绿色为预测正确,红色为预测错误
--- 模型评估报告 ---
                   precision    recall  f1-score   support

     Ariel Sharon       0.67      0.46      0.55        13
     Colin Powell       0.78      0.82      0.80        60
  Donald Rumsfeld       0.74      0.52      0.61        27
    George W Bush       0.76      0.92      0.83       146
Gerhard Schroeder       0.71      0.60      0.65        25
      Hugo Chavez       1.00      0.27      0.42        15
       Tony Blair       0.76      0.61      0.68        36

         accuracy                           0.76       322
        macro avg       0.77      0.60      0.65       322
     weighted avg       0.76      0.76      0.74       322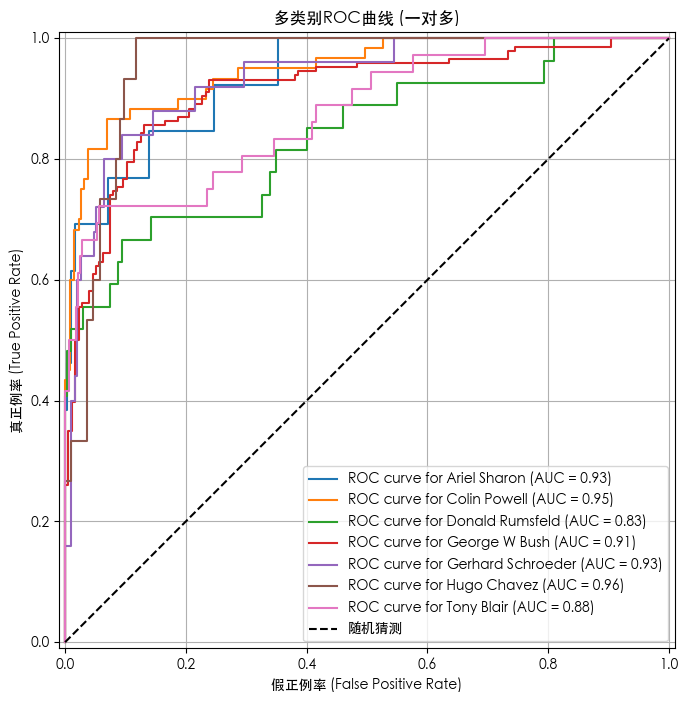
代码
python
import numpy as np
import matplotlib.pyplot as plt
from sklearn.model_selection import train_test_split
from sklearn.datasets import fetch_lfw_people
from sklearn.svm import SVC
from sklearn.metrics import classification_report, RocCurveDisplay, auc
from sklearn.preprocessing import StandardScaler, LabelBinarizer
import time

# --- 解决中文显示问题 ---
plt.rcParams['font.sans-serif'] = ['SimHei', 'WenQuanYi Zen Hei', 'STHeiti', 'Arial Unicode MS']
plt.rcParams['axes.unicode_minus'] = False

# --- 加载数据集 ---
print("正在加载 Labeled Faces in the Wild (LFW) 数据集...")

lfw_data = fetch_lfw_people(
    min_faces_per_person=70, # 过滤掉样本过少的人,确保每个类别都有足够的样本进行训练
    resize=0.4, # 图像缩放比例,0.4表示将原图缩小到40%
    color=False  # 直接加载灰度图
)
print("数据集加载成功!")

# --- 数据集基本信息 ---
print("\n--- 数据集简要概览 ---")
n_samples, h, w = lfw_data.images.shape
X = lfw_data.data
y = lfw_data.target
n_features = X.shape[1]
target_names = lfw_data.target_names
n_classes = target_names.shape[0]

print(f"总样本数: {n_samples}")
print(f"特征数: {n_features}")
print(f"类别数: {n_classes}")
print(f"图像尺寸: {h}x{w}")
print("类别名称: ", target_names.tolist())

# --- 数据可视化:展示一些人脸图片 ---
print("\n--- 正在展示部分人脸图片... ---")
def plot_gallery(images, titles, h, w, n_row=3, n_col=5):
    """绘制一个图片画廊"""
    plt.figure(figsize=(1.8 * n_col, 2.4 * n_row))
    plt.subplots_adjust(bottom=0, left=.01, right=.99, top=.90, hspace=.35)
    for i in range(n_row * n_col):
        plt.subplot(n_row, n_col, i + 1)
        plt.imshow(images[i].reshape((h, w)), cmap=plt.cm.gray)
        plt.title(titles[i], size=12)
        plt.xticks(())
        plt.yticks(())

# 绘制画廊
title_names = [target_names[i] for i in y]
plot_gallery(lfw_data.images, title_names, h, w)
plt.show()

# --- 模型训练与评估 ---
print("\n--- 正在划分数据集并进行标准化处理... ---")
X_train, X_test, y_train, y_test = train_test_split(
    X, y, test_size=0.25, random_state=42
)

# 使用 StandardScaler 进行标准化
scaler = StandardScaler()
X_train_scaled = scaler.fit_transform(X_train)
X_test_scaled = scaler.transform(X_test)

# 未进行标准化
# X_train_scaled = X_train
# X_test_scaled = X_test

print("\n--- 正在训练SVC模型... ---")
# 训练 SVC 模型
start_time = time.time()
classifier = SVC(kernel='rbf', class_weight='balanced', gamma=0.001)
classifier.fit(X_train_scaled, y_train)
end_time = time.time()
print("模型训练完成!")
print(f"训练耗时: {end_time - start_time:.2f} 秒")

# 评估模型
y_pred = classifier.predict(X_test_scaled)
print("\n--- 模型评估报告 ---")
print(classification_report(y_test, y_pred, target_names=target_names))

# 可视化预测结果
print("\n--- 正在展示部分预测结果... ---")
def plot_pred_gallery(images, y_true, y_pred, titles, h, w, n_row=3, n_col=5):
    """绘制包含预测结果的图片画廊"""
    plt.figure(figsize=(1.8 * n_col, 2.4 * n_row))
    plt.subplots_adjust(bottom=0, left=.01, right=.99, top=.90, hspace=.35)
    for i in range(n_row * n_col):
        plt.subplot(n_row, n_col, i + 1)
        plt.imshow(images[i].reshape((h, w)), cmap=plt.cm.gray)
        color = 'green' if y_pred[i] == y_true[i] else 'red'
        plt.title(titles[i], size=12, color=color)
        plt.xticks(())
        plt.yticks(())

# 生成预测结果的标题
prediction_titles = [f"Real: {target_names[y_test[i]]}\nPred: {target_names[y_pred[i]]}"
                     for i in range(y_pred.shape[0])]

# 绘制画廊,显示预测结果(只取部分样本)
plot_pred_gallery(X_test, y_test, y_pred, prediction_titles, h, w)
plt.show()

# --- ROC曲线与AUC分数可视化 ---
print("\n--- 正在绘制ROC曲线... ---")
# SVC的decision_function用于获取置信度分数
y_score = classifier.decision_function(X_test_scaled)

# 将多类别标签转换为二元形式(一对多)
lb = LabelBinarizer()
y_test_bin = lb.fit_transform(y_test)

plt.figure(figsize=(10, 8))
# 绘制每个类别的ROC曲线
for i in range(n_classes):
    RocCurveDisplay.from_predictions(
        y_test_bin[:, i],
        y_score[:, i],
        name=f"ROC curve for {target_names[i]}",
        ax=plt.gca()
    )

# 绘制对角线(随机猜测)
plt.plot([0, 1], [0, 1], 'k--', label='随机猜测')
plt.title('多类别ROC曲线 (一对多)')
plt.xlabel('假正例率 (False Positive Rate)')
plt.ylabel('真正例率 (True Positive Rate)')
plt.legend()
plt.grid(True)
plt.show()

# 计算宏平均AUC(Macro-average AUC)
macro_roc_auc_ovo = auc(
    np.unique(y_test_bin, axis=0)[0],
    np.mean(y_score, axis=0)
)
print(f"\n宏平均AUC(一对一): {macro_roc_auc_ovo:.2f}")