文章目录
-
- [1、前端 Mapbox GL + Mapbox GL Draw](#1、前端 Mapbox GL + Mapbox GL Draw)
- [2、后端 Flask](#2、后端 Flask)
- 3、下载游览
本文也是基于上几节文章中的案例项目继续完善实现新功能:MapboxGL作为底图,添加绘图工具,通过绘图工具面板绘制点线面,最后下载保存为shpfile,以zip压缩文件形式供用户下载使用。
具体实现思路,在 Mapbox GL 里:
-
添加 多个绘图工具(点 / 线 / 面 / 删除)
-
页面上有 多个功能面板(比如左边是"绘图工具栏",右边是"图层/属性面板")
-
用 Mapbox GL + Mapbox GL Draw + 自定义 CSS 布局 来实现。
1、前端 Mapbox GL + Mapbox GL Draw
-
使用 Mapbox 自带的绘图插件(mapbox-gl-draw)
-
提供 点 / 线 / 面 三种绘制工具,带默认工具栏面板
-
用户可以自由绘制
1.1、mapbox-gl-draw插件
Mapbox GL 本身的核心库 不带绘图功能,但是官方提供了一个插件 mapbox-gl-draw,这是它的"自带"绘图工具扩展。
它提供了 点、线、面绘制工具栏 + 属性面板(绘制完成后可编辑、删除)。
- 基本示例(Mapbox GL Draw)
html
<!DOCTYPE html>
<html>
<head>
<meta charset="utf-8">
<title>Mapbox GL Draw 示例</title>
<meta name="viewport" content="initial-scale=1,maximum-scale=1,user-scalable=no">
<link href="https://api.mapbox.com/mapbox-gl-js/v2.16.1/mapbox-gl.css" rel="stylesheet">
<link href="https://api.mapbox.com/mapbox-gl-js/plugins/mapbox-gl-draw/v1.5.0/mapbox-gl-draw.css" rel="stylesheet" />
<style>
  body { margin:0; padding:0; }
  #map { position:absolute; top:0; bottom:0; width:100%; }
</style>
</head>
<body>

<div id="map"></div>

<script src="https://api.mapbox.com/mapbox-gl-js/v2.16.1/mapbox-gl.js"></script>
<script src="https://api.mapbox.com/mapbox-gl-js/plugins/mapbox-gl-draw/v1.5.0/mapbox-gl-draw.js"></script>

<script>
mapboxgl.accessToken = 'YOUR_MAPBOX_ACCESS_TOKEN';

var map = new mapboxgl.Map({
    container: 'map',
    style: 'mapbox://styles/mapbox/streets-v12',
    center: [54.5, 24.0],
    zoom: 5
});

// ✅ 添加 Mapbox Draw 工具栏(自带面板)
var Draw = new MapboxDraw({
  displayControlsDefault: true,   // 显示默认的所有工具
  controls: {
    point: true,
    line_string: true,
    polygon: true,
    trash: true,
    combine_features: false,
    uncombine_features: false
  }
});
map.addControl(Draw, 'top-left');  // 工具栏显示在左上角

// ✅ 监听绘图事件
map.on('draw.create', updateFeatures);
map.on('draw.update', updateFeatures);
map.on('draw.delete', updateFeatures);

function updateFeatures(e) {
  var data = Draw.getAll();
  console.log("当前要素:", data);
  alert("当前绘制了 " + data.features.length + " 个要素");
}
</script>

</body>
</html>
1.2、实现效果
这是最小可运行的 内置绘图工具 + 工具栏面板:
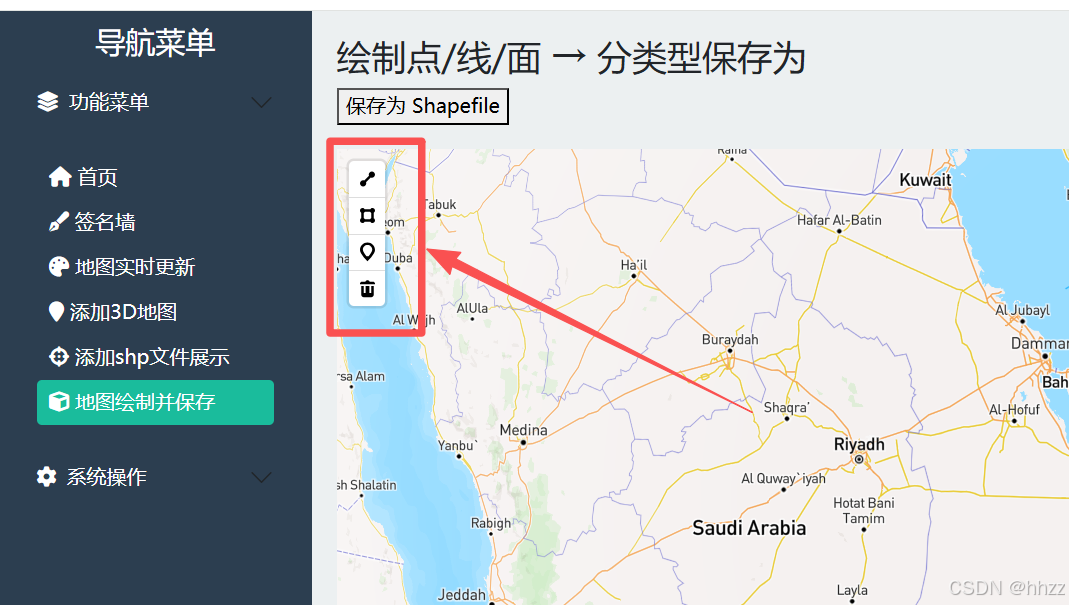
在地图左上角自动出现一个 工具栏面板:
-
点 ✦
-
线 ▬
-
面 ⬠
-
删除 🗑️
用户可以交互式画点、线、面,并随时修改或删除。
事件监听:
draw.create → 用户新建要素时触发
draw.update → 用户修改要素时触发
draw.delete → 用户删除要素时触发
可以用 Draw.getAll() 获取当前所有要素(GeoJSON 格式)
说明:
Mapbox GL 原生没有绘图 UI,需要加载 mapbox-gl-draw 插件,这个插件就算是"官方自带"的绘图工具和面板,它返回的数据是标准 GeoJSON,所以很容易存数据库或导出为 Shapefile
导航栏小图标使用地址:https://fontawesome.com/icons/icons?s=solid
前端完整代码(drawsaveshpfile.html):
html
{% extends "home.html" %}
{% block title %}地图绘制并保存{% endblock %}

{% block content %}
<!-- Mapbox GL JS -->
<!DOCTYPE html>
<html>
<head>
<meta charset="utf-8">
<title>绘制点/线/面 → 分类型保存为</title>
<meta name="viewport" content="initial-scale=1,maximum-scale=1,user-scalable=no">
<link href="https://api.mapbox.com/mapbox-gl-js/v3.15.0/mapbox-gl.css" rel="stylesheet">
<script src="https://api.mapbox.com/mapbox-gl-js/v3.15.0/mapbox-gl.js"></script>
<style>
body { margin: 0; padding: 0; }
#map { position: absolute; top: 100px; bottom: 0; width: 100%; }
</style>
</head>
<body>
<h3>绘制点/线/面 → 分类型保存为</h3>
<button id="saveShpBtn">保存为 Shapefile</button>
<div id="map" style="width: 100%; margin-top:10px;"></div>

<!-- Mapbox GL -->
<link href="https://api.mapbox.com/mapbox-gl-js/v2.16.1/mapbox-gl.css" rel="stylesheet">
<script src="https://api.mapbox.com/mapbox-gl-js/v2.16.1/mapbox-gl.js"></script>

<!-- Mapbox GL Draw -->
<link rel="stylesheet" href="https://api.mapbox.com/mapbox-gl-js/plugins/mapbox-gl-draw/v1.5.0/mapbox-gl-draw.css" type="text/css"/>
<script src="https://api.mapbox.com/mapbox-gl-js/plugins/mapbox-gl-draw/v1.5.0/mapbox-gl-draw.js"></script>

<script>
mapboxgl.accessToken = 'pk.eyJ1IjoidGlnZXJiZ3AyMDIwIiwiYSI6ImNsaGhpb3Q0ZTBvMWEzcW1xcXd4aTk5bzIifQ.4mA7mUrhK09N4vrrQfZA_Q';

var map = new mapboxgl.Map({
    container: 'map',
    style: 'mapbox://styles/mapbox/streets-v12',
    center: [54.5, 24.0],
    zoom: 5
});

// 添加绘图工具
var Draw = new MapboxDraw({
    displayControlsDefault: true,
    controls: {
        point: true,
        line_string: true,
        polygon: true,
        trash: true,
        combine_features: false,
        uncombine_features: false
    }
});
map.addControl(Draw,'top-left');

// 保存按钮
document.getElementById("saveShpBtn").addEventListener("click", function(){
    var data = Draw.getAll();
    if(data.features.length === 0){
        alert("请先绘制点/线/面!");
        return;
    }

    fetch("/save_shp", {
        method: "POST",
        headers: {"Content-Type": "application/json"},
        body: JSON.stringify(data)
    })
    .then(res => res.blob())
    .then(blob => {
        // 下载文件
        var url = window.URL.createObjectURL(blob);
        var a = document.createElement("a");
        a.href = url;
        a.download = "draw_shpfile.zip";  // shp 通常是多文件,后端打包为 zip
        a.click();
        window.URL.revokeObjectURL(url);
    })
    .catch(err => alert("保存失败: " + err));
});
</script>
</body>
</html>
{% endblock %}
2、后端 Flask
-
获取前端传过来的 GeoJSON
-
根据要素类型(Point / LineString / Polygon)分类
-
各自保存为独立的 Shapefile(点.shp / 线.shp / 面.shp)
-
打包成 zip 返回
python
@app.route("/drawsaveshp")
def drawsaveshp():
    return render_template("drawsaveshp.html")

@app.route("/save_shp", methods=["POST"])
def save_shp():
    data = request.get_json()

    if not data or "features" not in data or len(data["features"]) == 0:
        return {"error": "没有有效的绘制结果"}, 400

    # 分类存储
    points, lines, polys = [], [], []
    for feat in data["features"]:
        geom_type = feat["geometry"]["type"]
        geom = shape(feat["geometry"])
        if geom_type == "Point":
            points.append({"geometry": geom})
        elif geom_type == "LineString":
            lines.append({"geometry": geom})
        elif geom_type == "Polygon":
            polys.append({"geometry": geom})

    tmp_dir = tempfile.mkdtemp()

    # 保存点
    if points:
        gdf_points = gpd.GeoDataFrame(points, crs="EPSG:4326")
        gdf_points.to_file(os.path.join(tmp_dir, "points.shp"), driver="ESRI Shapefile")

    # 保存线
    if lines:
        gdf_lines = gpd.GeoDataFrame(lines, crs="EPSG:4326")
        gdf_lines.to_file(os.path.join(tmp_dir, "lines.shp"), driver="ESRI Shapefile")

    # 保存面
    if polys:
        gdf_polys = gpd.GeoDataFrame(polys, crs="EPSG:4326")
        gdf_polys.to_file(os.path.join(tmp_dir, "polygons.shp"), driver="ESRI Shapefile")

    # 打包成 zip
    zip_path = os.path.join(tmp_dir, "features.zip")
    with zipfile.ZipFile(zip_path, "w") as zf:
        for f in os.listdir(tmp_dir):
            if f.endswith((".shp", ".shx", ".dbf", ".prj")):
                zf.write(os.path.join(tmp_dir, f), arcname=f)

    return send_file(zip_path, as_attachment=True, download_name="features.zip")
3、下载游览
浏览器点击"保存"按钮 → 请求后端 → 自动下载 zip
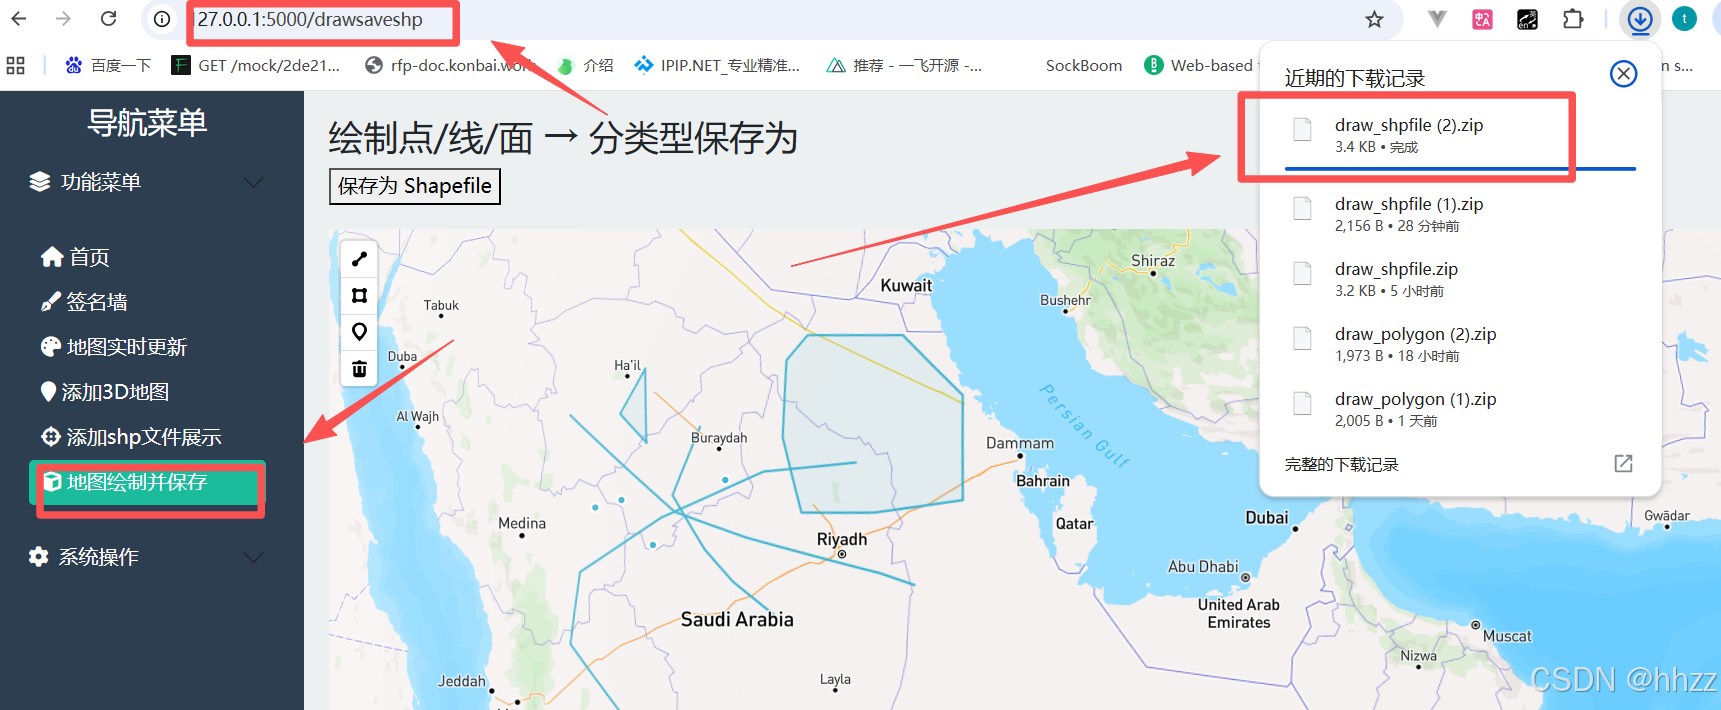
效果:

"人的一生会经历很多痛苦,但回头想想,都是传奇"。