搭建一个完整的 syslog → Filebeat → Elasticsearch → Kibana 测试环境,详细的分步骤配置手册 ,包括 Linux (Filebeat) 和 Windows (Elasticsearch + Kibana) 的安装和配置。
部署架构
-
Filebeat :运行在 Linux 服务器
192.168.0.83,采集 syslog。 -
Elasticsearch + Kibana :运行在 Windows 服务器
192.168.0.100,负责存储日志和可视化。 -
syslog 流程:
syslog 设备/服务 → Filebeat (192.168.0.83) → Elasticsearch (192.168.0.100:9200) → Kibana (192.168.0.100:5601)
1. 安装和配置 Elasticsearch (Windows: 192.168.0.100)
-
下载并解压
- 去 Elasticsearch 下载页面 下载对应的 Windows 版本。
- 解压到
C:\elasticsearch-<version>。
-
配置文件
编辑:
C:\elasticsearch-<version>\config\elasticsearch.yml添加或修改以下内容:
cluster.name: syslog-cluster
node.name: node-1
path.data: C:\elasticsearch\data
path.logs: C:\elasticsearch\logs监听所有网卡,供 Filebeat 远程访问
network.host: 0.0.0.0
http.port: 9200单节点模式(测试环境用)
discovery.type: single-node
3. 启动 Elasticsearch
在命令行进入 C:\elasticsearch-<version>\bin,执行:
elasticsearch.bat- 打开浏览器访问
http://192.168.0.100:9200/,如果能看到 JSON 输出,说明成功。
2. 安装和配置 Kibana (Windows: 192.168.0.100)
-
下载并解压
- 去 Kibana 下载页面 下载对应的 Windows 版本。
- 解压到
C:\kibana-<version>。
-
配置文件
编辑:
C:\kibana-<version>\config\kibana.yml修改:
server.port: 5601
server.host: "0.0.0.0"指向本机的 Elasticsearch
elasticsearch.hosts: ["http://192.168.0.100:9200"]
设置 Kibana 实例的名称
server.name: "kibana-win"
3. 启动 Kibana
在命令行进入 C:\kibana-<version>\bin,执行:
kibana.bat- 打开浏览器访问
http://192.168.0.100:5601/,确认 Kibana 界面能加载。
3. 安装和配置 Filebeat (Linux: 192.168.0.83)
-
安装 Filebeat
curl -L -O https://artifacts.elastic.co/downloads/beats/filebeat/filebeat-8.14.3-x86_64.rpm
sudo rpm -ivh filebeat-8.14.3-x86_64.rpm
2. 配置 syslog 输入
编辑:/etc/filebeat/filebeat.yml
修改或添加:
filebeat.inputs:
  - type: syslog
    protocol.udp:
      host: "0.0.0.0:514"
    tags: ["syslog"]

output.elasticsearch:
  hosts: ["http://192.168.0.100:9200"]
  # 如果 ES 开启了用户名密码,这里需要:
  # username: "elastic"
  # password: "yourpassword"

setup.kibana:
  host: "192.168.0.100:5601"
默认 514 端口需要 root 权限监听,如果报错,可以改成 1514,然后在 syslog 服务端把日志发到 1514。
3. 启动 Filebeat 并设置开机自启
sudo systemctl enable filebeat
sudo systemctl start filebeat
sudo systemctl status filebeat
4. 测试 Filebeat 是否能写入 Elasticsearch
curl -X GET "192.168.0.100:9200/_cat/indices?v"
或
curl -X GET "https://192.168.0.100:9200/_cat/indices?v" -u elastic:你的密码 --insecure
4. 验证 Syslog 流程
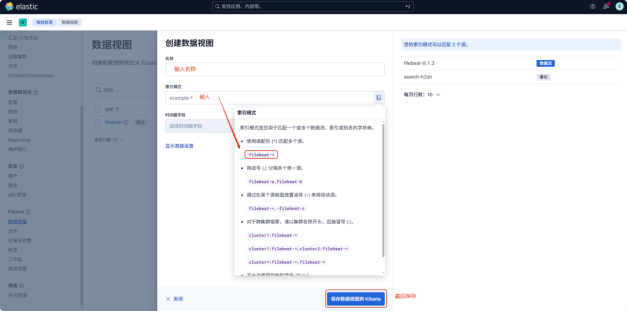
通过http://localhost:5601/进入登录界面
输入账号和密码进行登录,进行日志集成配置
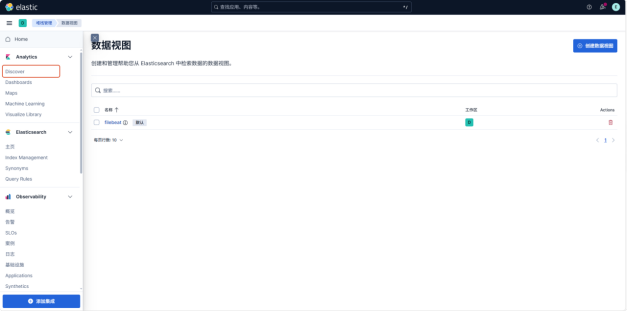
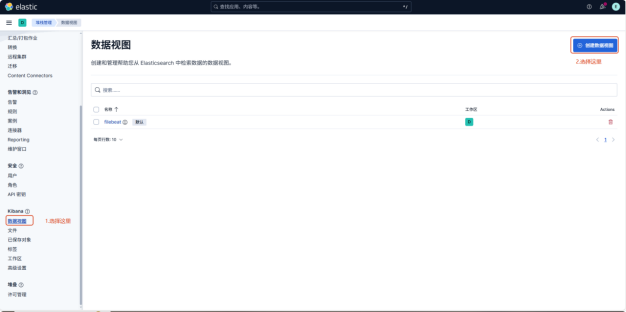
在登录界面选择 Stack Management
创建数据视图
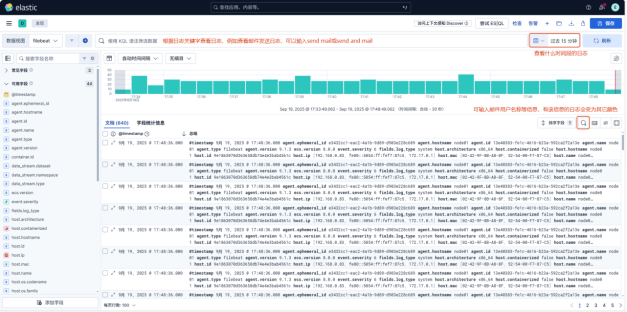
创建数据视图后,就可以看到Syslog的日志加载到Elasticsearch上的效果了,选择Discover查看日志,以查看sendmail日志为例: