最近公司因为新项目业务需求,接入了ES集群,为了观察ES相关指标所以也接入到了Prometheus当中,这个是我在测试环境中接入单节点的过程。仅供参考。
1. 下载镜像
css
root@YD-CN-Service-15963: docker pull quay.io/prometheuscommunity/elasticsearch-exporter:latest2.连接启动并连接到ES获取状态
ruby
root@YD-CN-Service-15963:/usr/local/disk_vdb/elasticsearch# cat docker-compose.yml
services:
  elasticsearch:
    image: elasticsearch:7.17.28
    container_name: elasticsearch
    ports:
      - "9200:9200"
      - "9300:9300"
    environment:
      - discovery.type=single-node
      - ES_JAVA_OPTS=-Xms512m -Xmx2048m
    volumes:
      - /usr/local/disk_vdb/elasticsearch/config:/usr/share/elasticsearch/config
      - /usr/local/disk_vdb/elasticsearch/data:/usr/share/elasticsearch/data
      - /usr/local/disk_vdb/elasticsearch/plugins:/usr/share/elasticsearch/plugins
      - /usr/local/disk_vdb/elasticsearch/logs:/usr/share/elasticsearch/logs
  elasticsearch_exporter:
    image: quay.io/prometheuscommunity/elasticsearch-exporter:latest
    command:
     - '--es.uri=http://账号:密码@10.0.0.22:9200'
    restart: always
    ports:
    - "9114:9114"
3.在Prometheus中引入exporter
ruby
root@YD-CN-Service-15963:/usr/local/disk_vdb# cat docker_project/prometheus_monitor/prometheus/prometheus.yml
# ...省略配置
  - job_name: 'elasticsearch7'
    static_configs:
      - targets:
        - 10.0.0.22:9114
4. 在Prometheus引入模板(直接导入Json)
python
{
"graphTooltip": 1,
"panels": [
{
"collapsed": false,
"gridPos": {
"h": 1,
"w": 24,
"x": 0,
"y": 0
},
"id": 1,
"panels": [ ],
"title": "Overview",
"type": "row"
},
{
"datasource": {
"type": "datasource",
"uid": "-- Mixed --"
},
"gridPos": {
"h": 4,
"w": 8,
"x": 0,
"y": 1
},
"id": 2,
"pluginVersion": "v10.4.0",
"targets": [
{
"datasource": {
"type": "prometheus",
"uid": "$datasource"
},
"expr": "sum(\n elasticsearch_cluster_health_number_of_nodes{cluster=~"$cluster"}\n)\n"
}
],
"title": "Nodes",
"type": "stat"
},
{
"datasource": {
"type": "datasource",
"uid": "-- Mixed --"
},
"gridPos": {
"h": 4,
"w": 8,
"x": 8,
"y": 1
},
"id": 3,
"pluginVersion": "v10.4.0",
"targets": [
{
"datasource": {
"type": "prometheus",
"uid": "$datasource"
},
"expr": "sum(\n elasticsearch_cluster_health_number_of_data_nodes{cluster=~"$cluster"}\n)\n"
}
],
"title": "Data Nodes",
"type": "stat"
},
{
"datasource": {
"type": "datasource",
"uid": "-- Mixed --"
},
"gridPos": {
"h": 4,
"w": 8,
"x": 16,
"y": 1
},
"id": 4,
"pluginVersion": "v10.4.0",
"targets": [
{
"datasource": {
"type": "prometheus",
"uid": "$datasource"
},
"expr": "sum(\n elasticsearch_cluster_health_number_of_pending_tasks{cluster=~"$cluster"}\n)\n"
}
],
"title": "Pending Tasks",
"type": "stat"
},
{
"collapsed": false,
"gridPos": {
"h": 1,
"w": 24,
"x": 0,
"y": 5
},
"id": 5,
"panels": [ ],
"title": "Shards",
"type": "row"
},
{
"datasource": {
"type": "datasource",
"uid": "-- Mixed --"
},
"gridPos": {
"h": 4,
"w": 4,
"x": 0,
"y": 6
},
"id": 6,
"pluginVersion": "v10.4.0",
"targets": [
{
"datasource": {
"type": "prometheus",
"uid": "$datasource"
},
"expr": "sum(\n elasticsearch_cluster_health_active_shards{cluster=~"$cluster"}\n)\n"
}
],
"title": "Active",
"type": "stat"
},
{
"datasource": {
"type": "datasource",
"uid": "-- Mixed --"
},
"gridPos": {
"h": 4,
"w": 4,
"x": 4,
"y": 6
},
"id": 7,
"pluginVersion": "v10.4.0",
"targets": [
{
"datasource": {
"type": "prometheus",
"uid": "$datasource"
},
"expr": "sum(\n elasticsearch_cluster_health_active_primary_shards{cluster=~"$cluster"}\n)\n"
}
],
"title": "Active Primary",
"type": "stat"
},
{
"datasource": {
"type": "datasource",
"uid": "-- Mixed --"
},
"gridPos": {
"h": 4,
"w": 4,
"x": 8,
"y": 6
},
"id": 8,
"pluginVersion": "v10.4.0",
"targets": [
{
"datasource": {
"type": "prometheus",
"uid": "$datasource"
},
"expr": "sum(\n elasticsearch_cluster_health_initializing_shards{cluster=~"$cluster"}\n)\n"
}
],
"title": "Initializing",
"type": "stat"
},
{
"datasource": {
"type": "datasource",
"uid": "-- Mixed --"
},
"gridPos": {
"h": 4,
"w": 4,
"x": 12,
"y": 6
},
"id": 9,
"pluginVersion": "v10.4.0",
"targets": [
{
"datasource": {
"type": "prometheus",
"uid": "$datasource"
},
"expr": "sum(\n elasticsearch_cluster_health_reloacting_shards{cluster=~"$cluster"}\n)\n"
}
],
"title": "Relocating",
"type": "stat"
},
{
"datasource": {
"type": "datasource",
"uid": "-- Mixed --"
},
"gridPos": {
"h": 4,
"w": 4,
"x": 16,
"y": 6
},
"id": 10,
"pluginVersion": "v10.4.0",
"targets": [
{
"datasource": {
"type": "prometheus",
"uid": "$datasource"
},
"expr": "sum(\n elasticsearch_cluster_health_unassigned_shards{cluster=~"$cluster"}\n)\n"
}
],
"title": "Unassigned",
"type": "stat"
},
{
"datasource": {
"type": "datasource",
"uid": "-- Mixed --"
},
"gridPos": {
"h": 4,
"w": 4,
"x": 20,
"y": 6
},
"id": 11,
"pluginVersion": "v10.4.0",
"targets": [
{
"datasource": {
"type": "prometheus",
"uid": "$datasource"
},
"expr": "sum(\n elasticsearch_cluster_health_delayed_unassigned_shards{cluster=~"$cluster"}\n)\n"
}
],
"title": "DelayedUnassigned",
"type": "stat"
},
{
"collapsed": false,
"gridPos": {
"h": 1,
"w": 24,
"x": 0,
"y": 10
},
"id": 12,
"panels": [ ],
"title": "Documents",
"type": "row"
},
{
"datasource": {
"type": "datasource",
"uid": "-- Mixed --"
},
"gridPos": {
"h": 4,
"w": 4,
"x": 0,
"y": 11
},
"id": 13,
"pluginVersion": "v10.4.0",
"targets": [
{
"datasource": {
"type": "prometheus",
"uid": "$datasource"
},
"expr": "elasticsearch_indices_docs{cluster=~"$cluster"}\n"
}
],
"title": "Indexed Documents",
"type": "timeseries"
},
{
"datasource": {
"type": "datasource",
"uid": "-- Mixed --"
},
"fieldConfig": {
"defaults": {
"unit": "bytes"
}
},
"gridPos": {
"h": 4,
"w": 4,
"x": 4,
"y": 11
},
"id": 14,
"pluginVersion": "v10.4.0",
"targets": [
{
"datasource": {
"type": "prometheus",
"uid": "$datasource"
},
"expr": "elasticsearch_indices_store_size_bytes{cluster=~"$cluster"}\n"
}
],
"title": "Index Size",
"type": "timeseries"
},
{
"datasource": {
"type": "datasource",
"uid": "-- Mixed --"
},
"gridPos": {
"h": 4,
"w": 4,
"x": 8,
"y": 11
},
"id": 15,
"pluginVersion": "v10.4.0",
"targets": [
{
"datasource": {
"type": "prometheus",
"uid": "$datasource"
},
"expr": "rate(elasticsearch_indices_indexing_index_total{cluster=~"$cluster"}[$__rate_interval])\n",
"legendFormat": "{{name}}"
}
],
"title": "Index Rate",
"type": "timeseries"
},
{
"datasource": {
"type": "datasource",
"uid": "-- Mixed --"
},
"gridPos": {
"h": 4,
"w": 4,
"x": 12,
"y": 11
},
"id": 16,
"pluginVersion": "v10.4.0",
"targets": [
{
"datasource": {
"type": "prometheus",
"uid": "$datasource"
},
"expr": "rate(elasticsearch_indices_search_query_total{cluster=~"$cluster"}[$__rate_interval])\n",
"legendFormat": "{{name}}"
}
],
"title": "Query Rate",
"type": "timeseries"
},
{
"datasource": {
"type": "datasource",
"uid": "-- Mixed --"
},
"gridPos": {
"h": 4,
"w": 4,
"x": 16,
"y": 11
},
"id": 17,
"pluginVersion": "v10.4.0",
"targets": [
{
"datasource": {
"type": "prometheus",
"uid": "$datasource"
},
"expr": "sum(elasticsearch_thread_pool_queue_count{cluster=~"$cluster",type!="management"}) by (type)\n",
"legendFormat": "{{type}}"
}
],
"title": "Queue Count",
"type": "timeseries"
},
{
"collapsed": false,
"gridPos": {
"h": 1,
"w": 24,
"x": 0,
"y": 15
},
"id": 18,
"panels": [ ],
"title": "Memory",
"type": "row"
},
{
"datasource": {
"type": "datasource",
"uid": "-- Mixed --"
},
"fieldConfig": {
"defaults": {
"unit": "bytes"
}
},
"gridPos": {
"h": 4,
"w": 6,
"x": 0,
"y": 16
},
"id": 19,
"pluginVersion": "v10.4.0",
"targets": [
{
"datasource": {
"type": "prometheus",
"uid": "$datasource"
},
"expr": "elasticsearch_jvm_memory_used_bytes{cluster=~"$cluster"}\n",
"legendFormat": "{{name}} {{area}}"
}
],
"title": "Memory Usage",
"type": "timeseries"
},
{
"datasource": {
"type": "datasource",
"uid": "-- Mixed --"
},
"fieldConfig": {
"defaults": {
"max": 1,
"min": 0,
"unit": "percentunit"
}
},
"gridPos": {
"h": 4,
"w": 6,
"x": 6,
"y": 16
},
"id": 20,
"pluginVersion": "v10.4.0",
"targets": [
{
"datasource": {
"type": "prometheus",
"uid": "$datasource"
},
"expr": "avg_over_time(\n elasticsearch_jvm_memory_used_bytes{cluster=~"$cluster"}[15m]\n) /\nelasticsearch_jvm_memory_max_bytes{cluster=~"$cluster"}\n",
"legendFormat": "{{name}} {{area}}"
}
],
"title": "Memory 15m Avg",
"type": "timeseries"
},
{
"datasource": {
"type": "datasource",
"uid": "-- Mixed --"
},
"fieldConfig": {
"defaults": {
"unit": "bytes"
}
},
"gridPos": {
"h": 4,
"w": 6,
"x": 12,
"y": 16
},
"id": 21,
"pluginVersion": "v10.4.0",
"targets": [
{
"datasource": {
"type": "prometheus",
"uid": "$datasource"
},
"expr": "elasticsearch_jvm_memory_max_bytes{cluster=~"$cluster"}\n",
"legendFormat": "{{name}} {{area}}"
}
],
"title": "Memory Max",
"type": "timeseries"
},
{
"datasource": {
"type": "datasource",
"uid": "-- Mixed --"
},
"fieldConfig": {
"defaults": {
"unit": "s"
}
},
"gridPos": {
"h": 4,
"w": 6,
"x": 18,
"y": 16
},
"id": 22,
"pluginVersion": "v10.4.0",
"targets": [
{
"datasource": {
"type": "prometheus",
"uid": "$datasource"
},
"expr": "rate(\n elasticsearch_jvm_gc_collection_seconds_sum{cluster=~"$cluster"}[$__rate_interval]\n)\n",
"legendFormat": "{{name}} {{gc}}"
}
],
"title": "GC Rate",
"type": "timeseries"
},
{
"collapsed": false,
"gridPos": {
"h": 1,
"w": 24,
"x": 0,
"y": 20
},
"id": 23,
"panels": [ ],
"title": "Threads",
"type": "row"
},
{
"datasource": {
"type": "datasource",
"uid": "-- Mixed --"
},
"gridPos": {
"h": 4,
"w": 12,
"x": 0,
"y": 21
},
"id": 24,
"pluginVersion": "v10.4.0",
"targets": [
{
"datasource": {
"type": "prometheus",
"uid": "$datasource"
},
"expr": "elasticsearch_thread_pool_active_count{cluster=~"$cluster"}\n",
"legendFormat": "{{type}}"
}
],
"title": "Thread Pools",
"type": "timeseries"
},
{
"datasource": {
"type": "datasource",
"uid": "-- Mixed --"
},
"gridPos": {
"h": 4,
"w": 12,
"x": 12,
"y": 21
},
"id": 25,
"pluginVersion": "v10.4.0",
"targets": [
{
"datasource": {
"type": "prometheus",
"uid": "$datasource"
},
"expr": "elasticsearch_thread_pool_rejected_count{cluster=~"$cluster"}\n",
"legendFormat": "{{name}} {{type}}"
}
],
"title": "Thread Pool Rejections",
"type": "timeseries"
},
{
"collapsed": false,
"gridPos": {
"h": 1,
"w": 24,
"x": 0,
"y": 25
},
"id": 26,
"panels": [ ],
"title": "Network",
"type": "row"
},
{
"datasource": {
"type": "datasource",
"uid": "-- Mixed --"
},
"fieldConfig": {
"defaults": {
"unit": "bytes"
}
},
"gridPos": {
"h": 4,
"w": 24,
"x": 0,
"y": 26
},
"id": 27,
"pluginVersion": "v10.4.0",
"targets": [
{
"datasource": {
"type": "prometheus",
"uid": "$datasource"
},
"expr": "rate(\n elasticsearch_transport_rx_size_bytes_total{cluster=~"$cluster"}[$__rate_interval]\n)\n",
"legendFormat": "{{name}} TX"
},
{
"datasource": {
"type": "prometheus",
"uid": "$datasource"
},
"expr": "rate(\n elasticsearch_transport_tx_size_bytes_total{cluster=~"$cluster"}[$__rate_interval]\n)\n",
"legendFormat": "{{name}} RX"
}
],
"title": "Transport Rate",
"type": "timeseries"
}
],
"refresh": "1m",
"schemaVersion": 36,
"tags": [
"elasticsearch-exporter-mixin"
],
"templating": {
"list": [
{
"name": "datasource",
"query": "prometheus",
"type": "datasource"
},
{
"datasource": {
"type": "prometheus",
"uid": "${datasource}"
},
"name": "cluster",
"query": "label_values(elasticsearch_cluster_health_status, cluster)",
"type": "query"
}
]
},
"time": {
"from": "now-1h",
"to": "now"
},
"timezone": "utc",
"title": "Elasticsearch Exporter / Cluster"
}5.查看图表
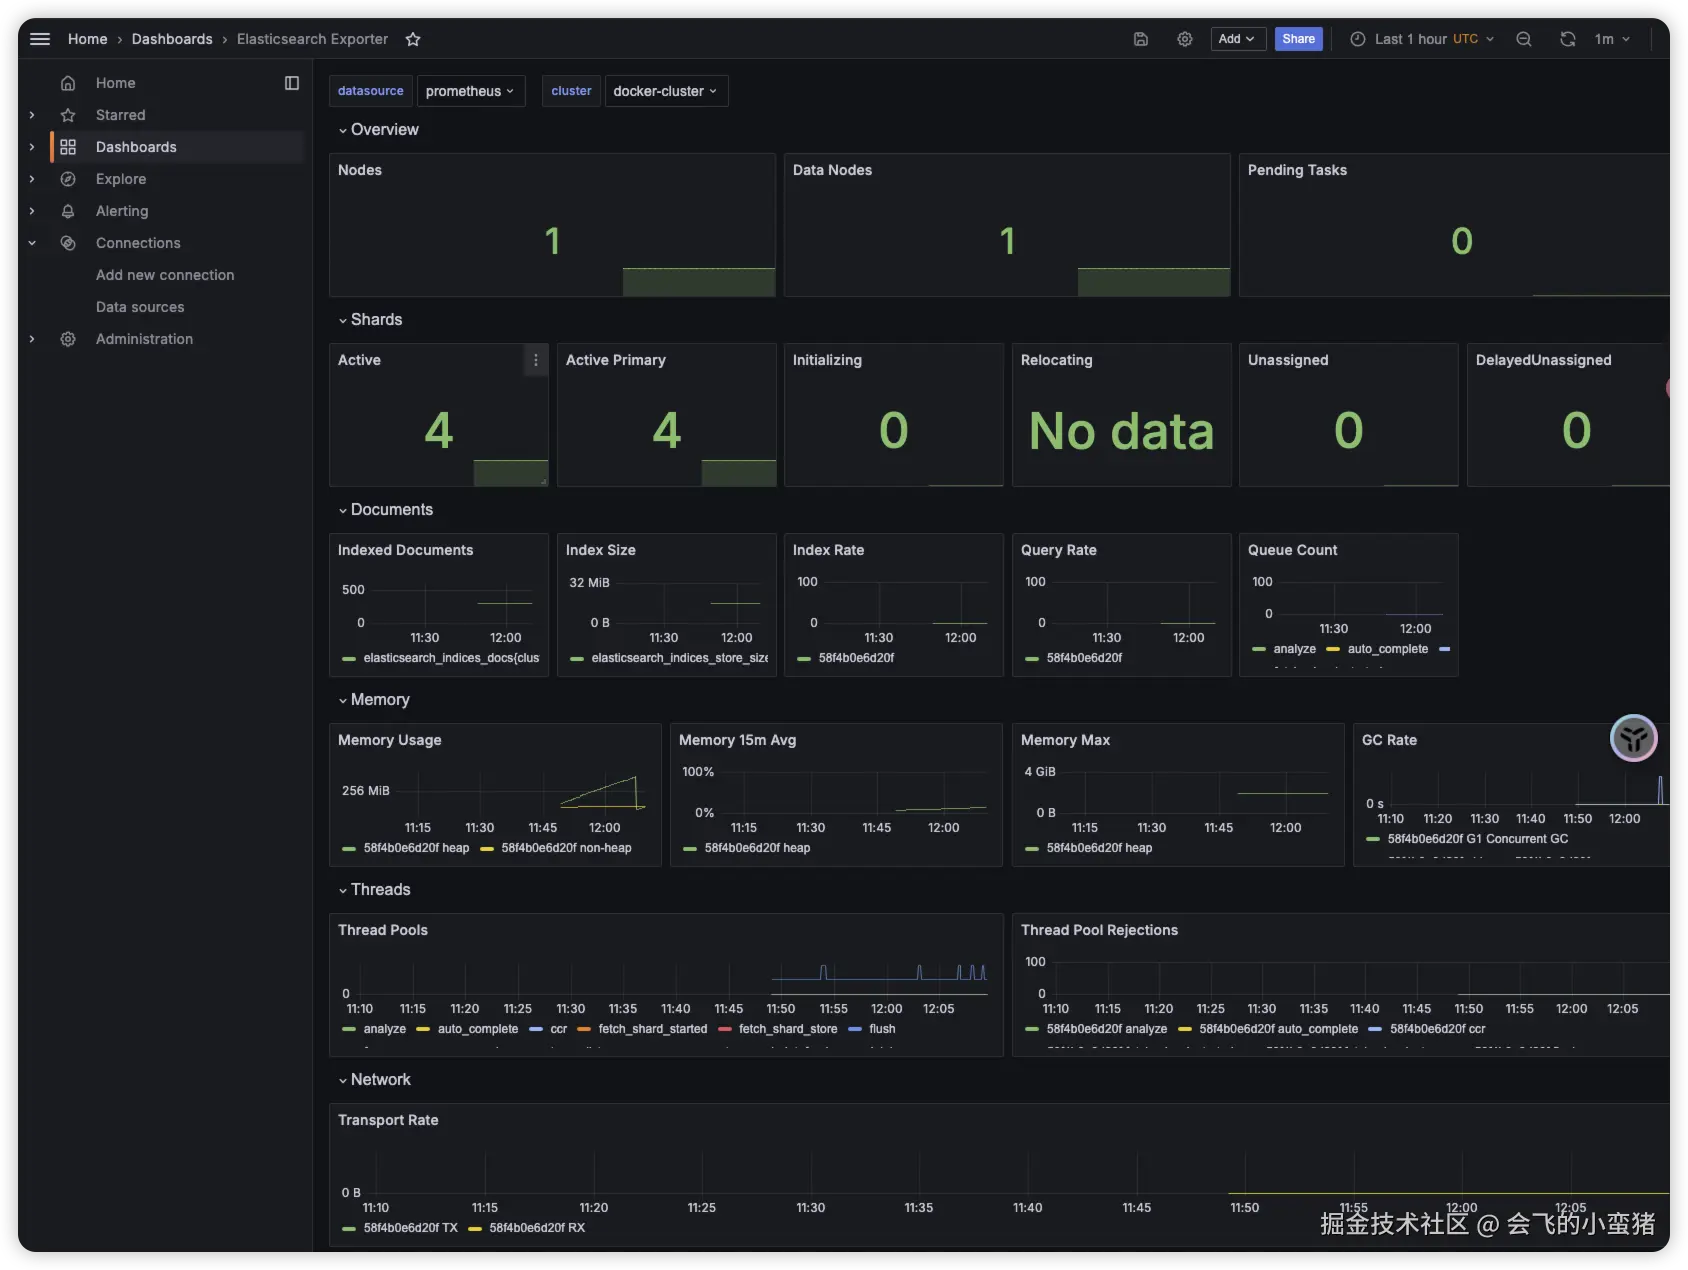
image-20251010200951144