工作中要维护多个K8S集群,发现运行异常的Pod要及时介入处理。
想到一个思路:使用Grafana将异常的Pod通过图表的方式显示出来。
这里用到了一个Grafana插件,Grafana-Infinity,关于这个插件的使用可以参考玩转Grafana-Infinity插件使用。
思路
通过Python脚本采集K8S集群中运行异常的Pod信息,包括命名空间、状态、重启次数、运行时长等。然后将这些数据通过http接口,以JSON格式的方式暴露出来,数据供Infinity来消费。
完整脚本
脚本很简单,读者可以根据实际情况修改,
python
import re
import json

import ansible_runner

from flask import Flask, request


def get_abnormal_pod(ip):
    response = {}
    data = []
    modules_args = "kubectl get pod --no-headers -A | grep -E -v -i 'running|completed'"
    ansi_escape = re.compile(r'\x1B(?:[@-Z\\-_]|\[[0-?]*[ -/]*[@-~])')
    pattern = re.compile(r"\s{2,}")

    try:
        runner_obj = ansible_runner.run(private_data_dir="/opt/jsonsource/abnormal_pod",
                                        inventory='/opt/jsonsource/abnormal_pod/inventory',
                                        host_pattern=ip,
                                        quiet=True,
                                        module='shell',
                                        module_args=modules_args)
        for line in runner_obj.stdout.readlines():
            # remove the ANSI escape sequences
            new_line = ansi_escape.sub('', line)
            resource_list = pattern.split(new_line)

            # 加保护,防止Grafana的Table panel显示异常
            if 'FAILED' in resource_list[0]:
                return {'data': [{'namespace': '正常', 'name': '正常', 'status': '正常',
                      'restarts': '正常', 'age': '正常'}]}

            ns_resource_detail = {}
            if len(resource_list) == 6:
                ns_resource_detail["namespace"] = resource_list[0]
                ns_resource_detail["name"] = resource_list[1]
                ns_resource_detail["status"] = resource_list[3]
                ns_resource_detail["restarts"] = resource_list[4]
                ns_resource_detail["age"] = resource_list[5].strip('\n')
                data.append(ns_resource_detail)
        response['data'] = data
    except:
        print("There is a exception")

    return response


app = Flask(__name__)

@app.route('/items')
def items():
    k8s_name_ip = {}
    k8s_name_ip['prod'] = '10.10.0.2'
    k8s_name_ip['demo'] = '10.11.0.2'
    k8s_name_ip['test'] = '10.12.0.2'

    cluster_name = request.args.get("tag")

    if cluster_name in k8s_name_ip:
        ip = k8s_name_ip[cluster_name]
        return get_abnormal_pod(ip)

    # 保护,防止返回错误数据
    return {'data': [{'namespace': '仅支持指定平台', 'name': '仅支持指定平台', 'status': '仅支持指定平台',
                      'restarts': '仅支持指定平台', 'age': '仅支持指定平台'}]}


if __name__ == "__main__":
    app.run(host="0.0.0.0", port=3111)
因为脚本运行的服务器不能直接访问K8S,这里使用了Ansible来远程执行。Inventory文件内容如下,
bash
10.10.0.2
10.11.0.2
10.12.0.2
配置Grafana
新开一个Panel,类型选择"Table",数据源选择"Infinity"。
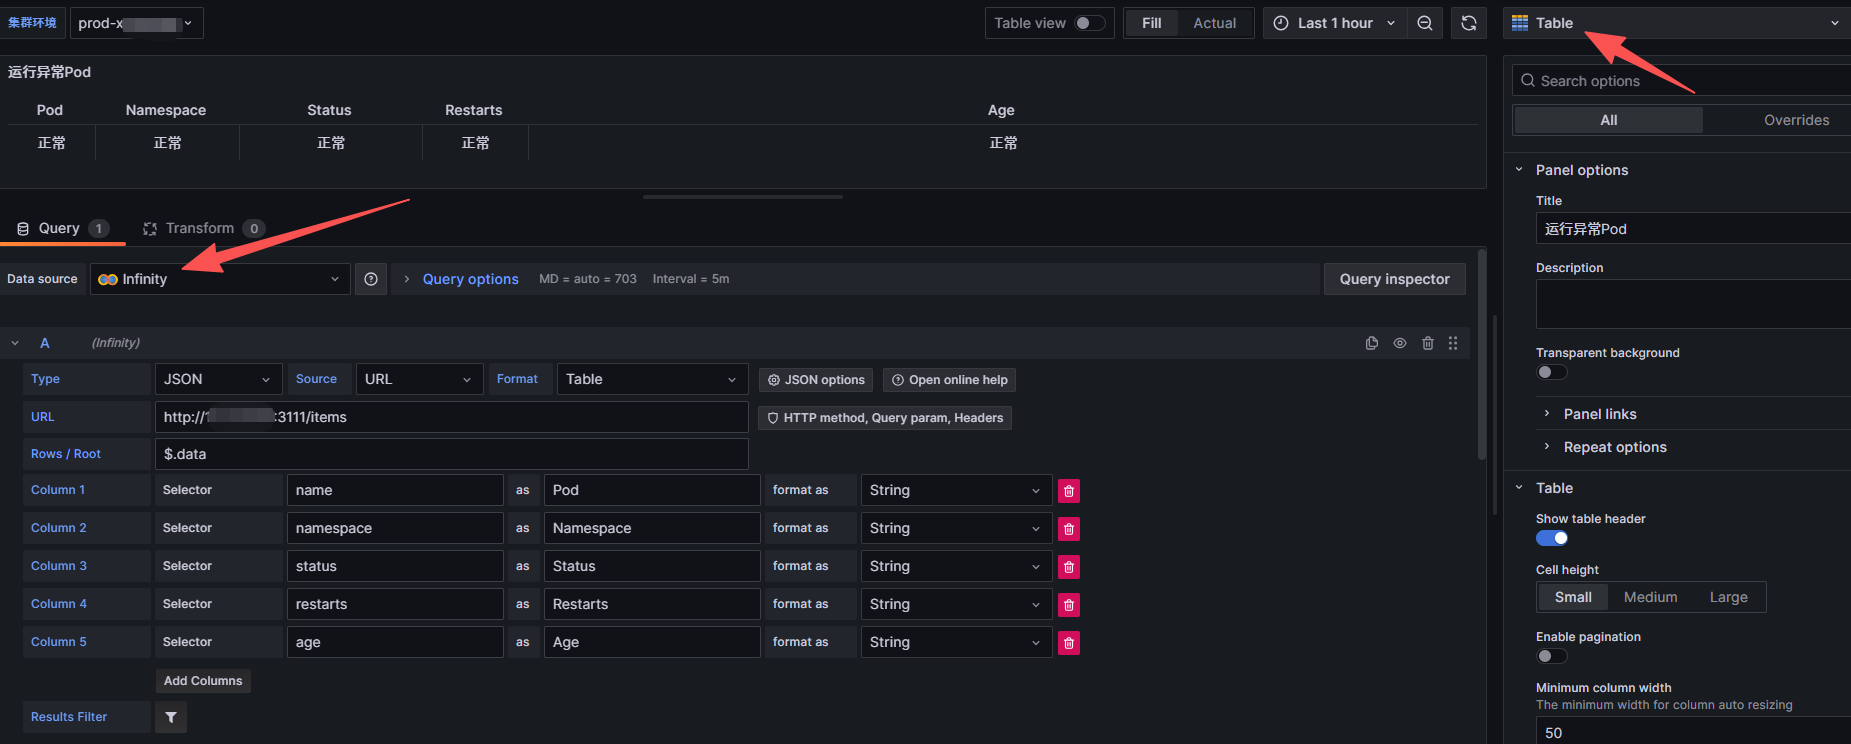
这里有个技巧,参照上面的Python脚本,
python
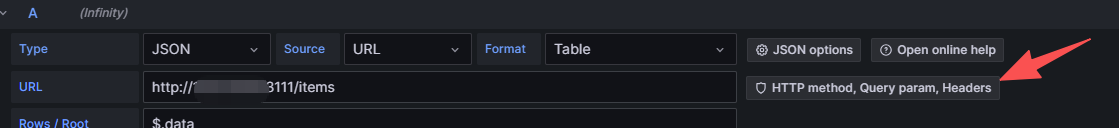
cluster_name = request.args.get("tag")集群的控制服务器IP通过查询参数"tag"传递,在配置"Infinity"插件时,要给"URL"配置一个查询参数,
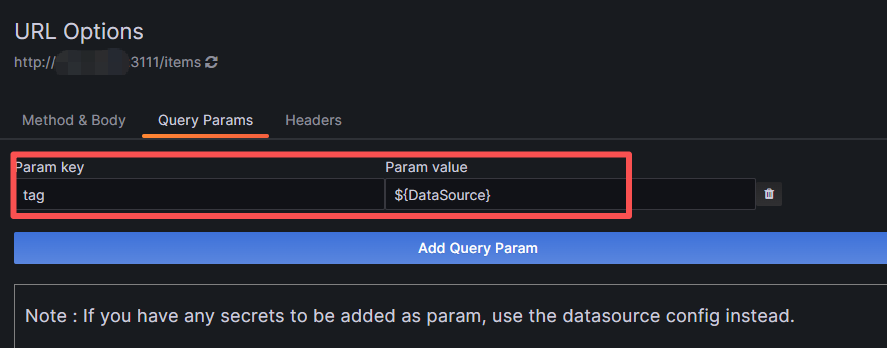
这样我们就可以在Grafana上自由切换来显示不同环境的Pod运行状态。
显示效果
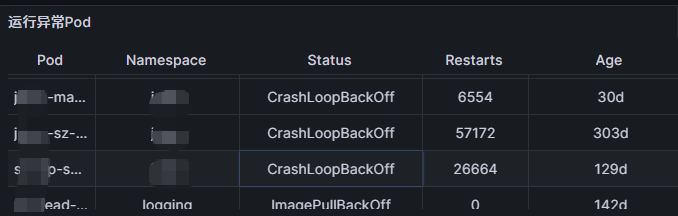
这样便可以通过Grafana上的一个单一Panel监控多个K8S集群的运行异常Pod。