本例 数据源采用prometheus
grafana版本为11.2.0
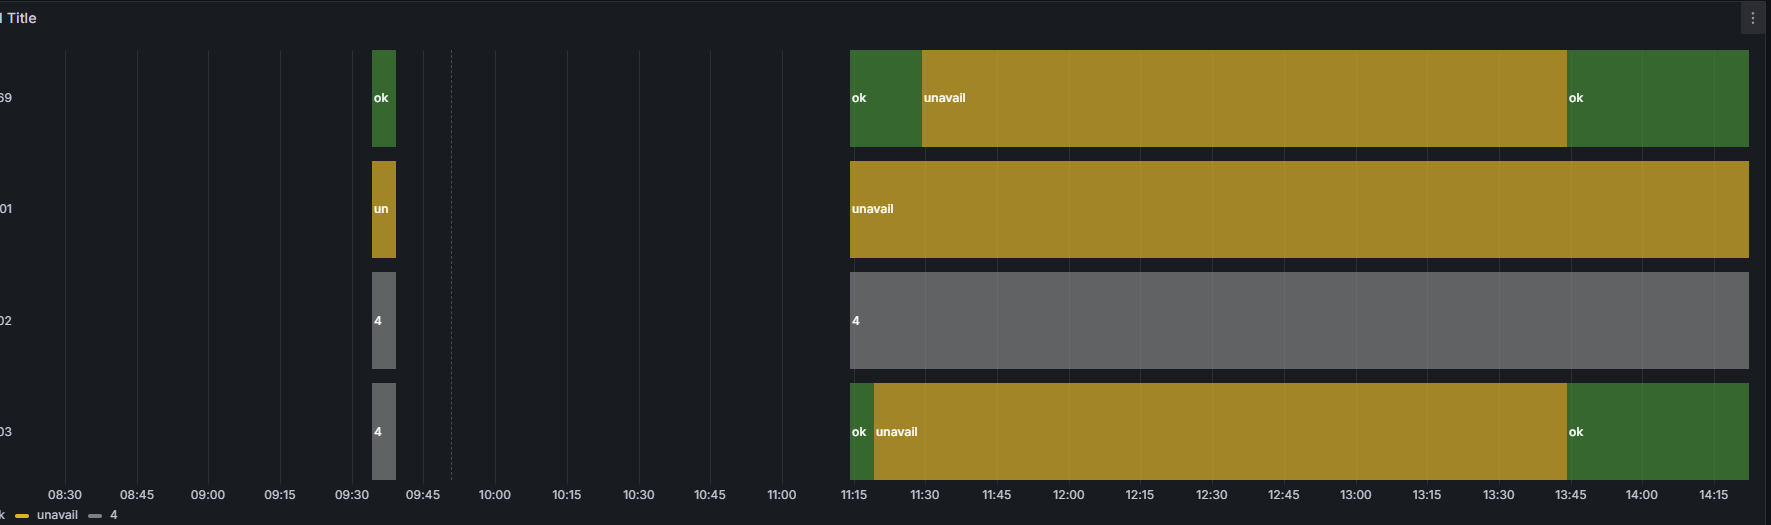
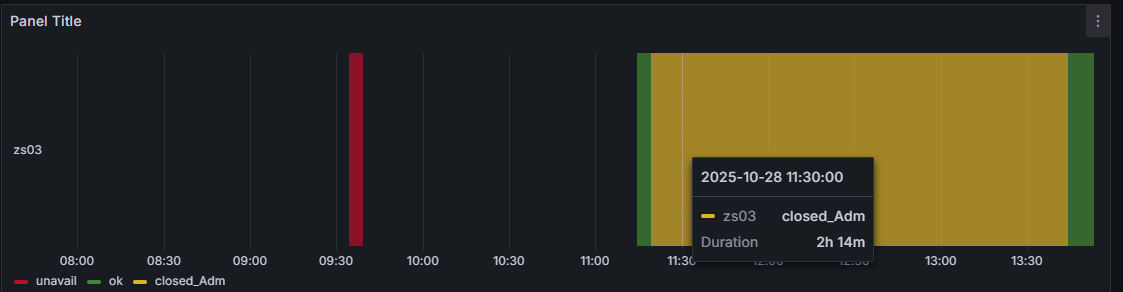
有一个服务的的状态是变化的,需要监控起来,比如含有状态:ok, unavail, close_Adm等状态,但是prometheus只能存数字值,在grafana只显示的时候数字值又看着不是很方便,这里就就简单操作一下grafana怎么做数字和状态字符串的映射。先上效果图:
实现步骤
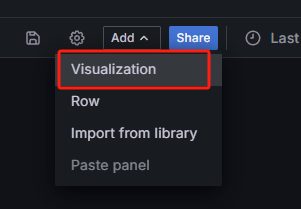
在面板里面新增视图
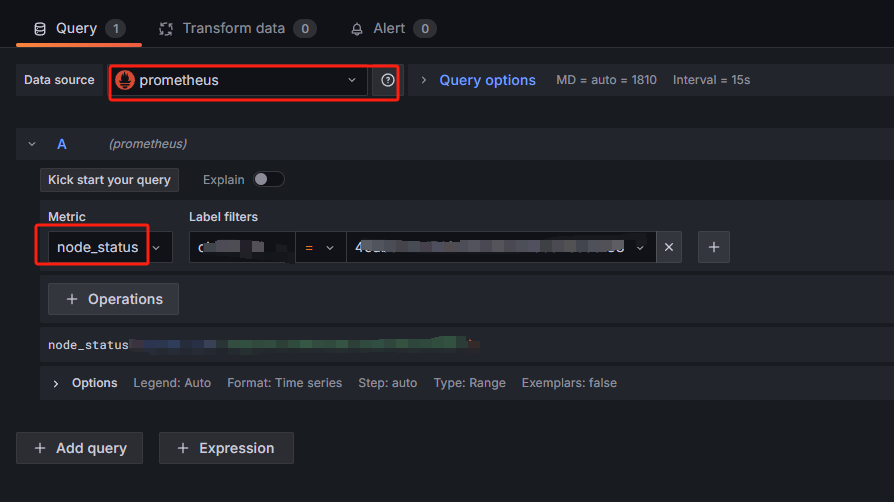
选择数据源和指标
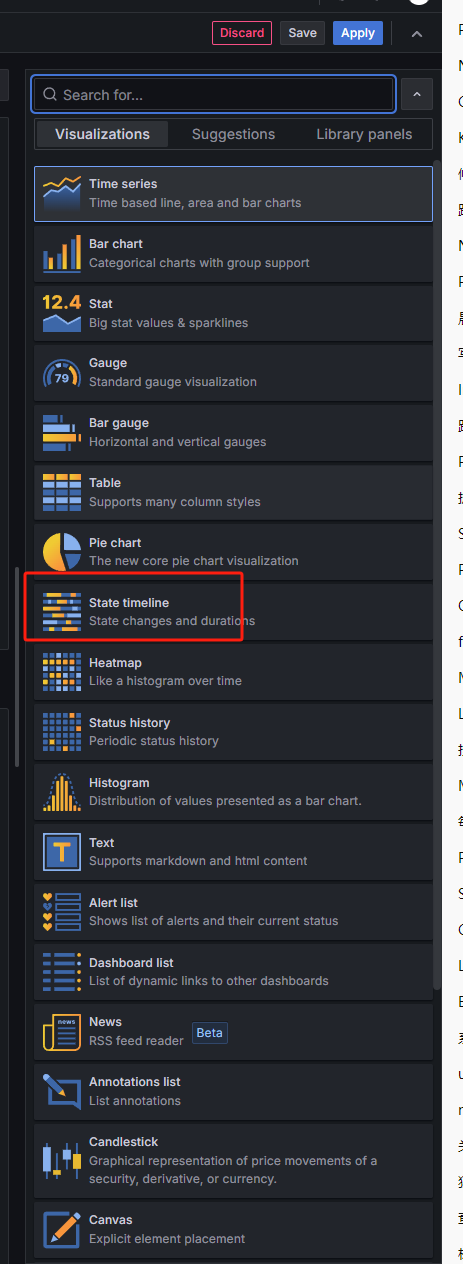
在面板右侧选择state timeline
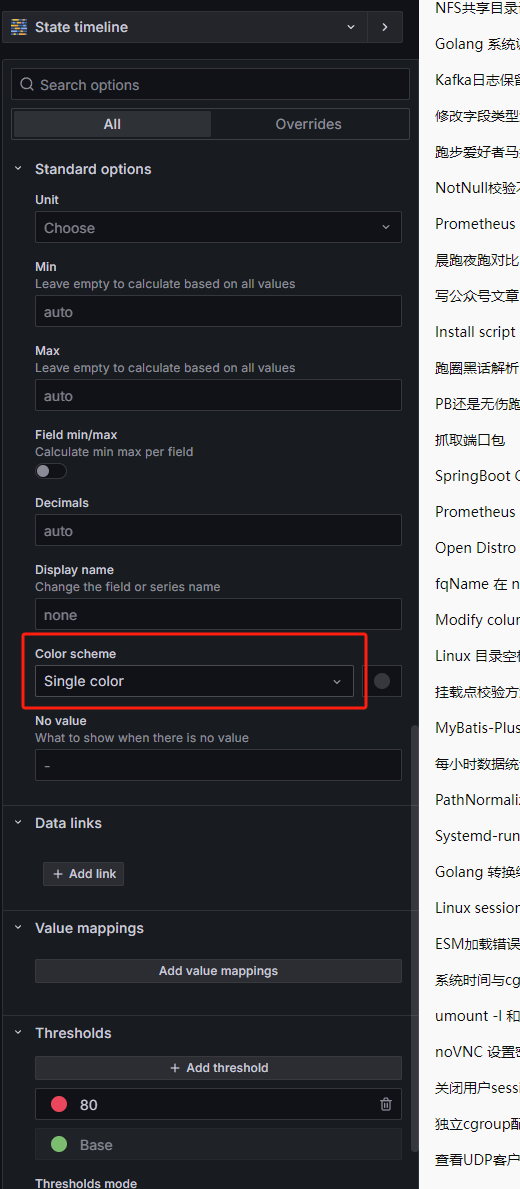
color scheme选择single color
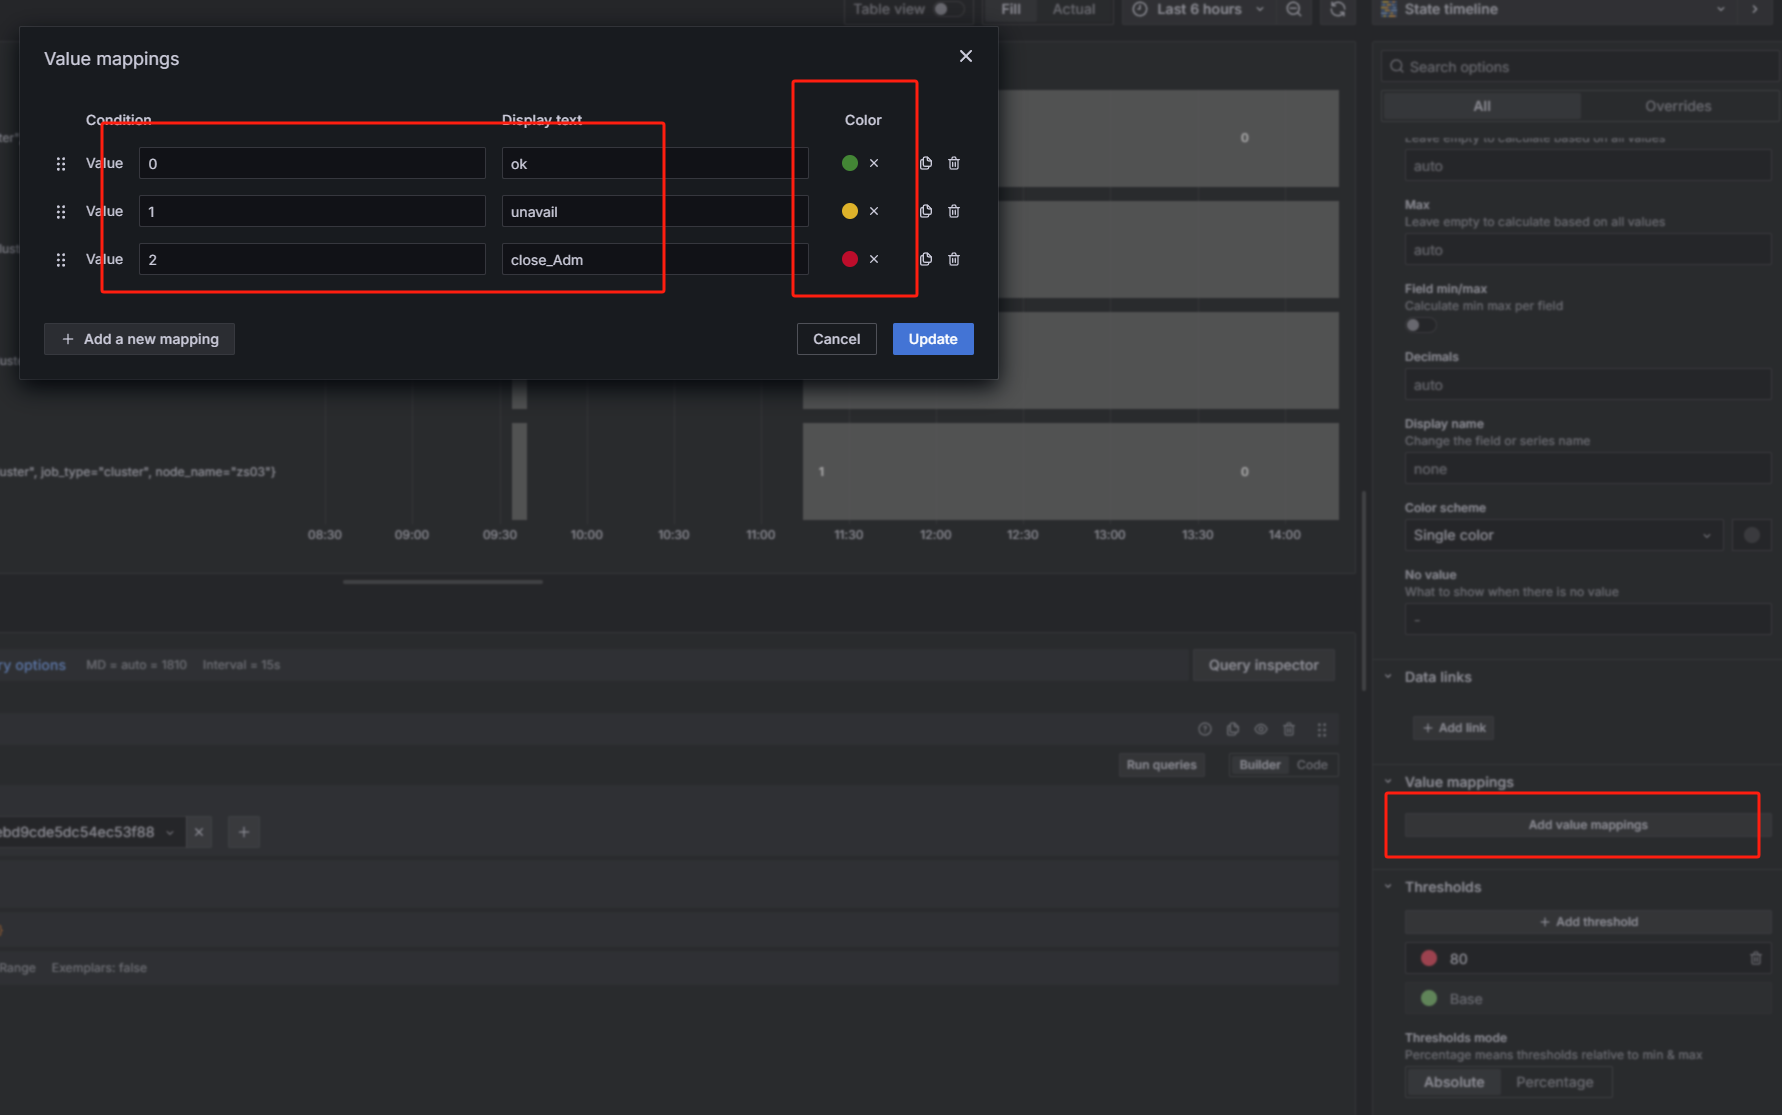
做状态数值和名称的映射,这是关键步骤
最后成品