InfluxDB配合Grafana:打造专业监控可视化平台
1 可视化监控的重要性
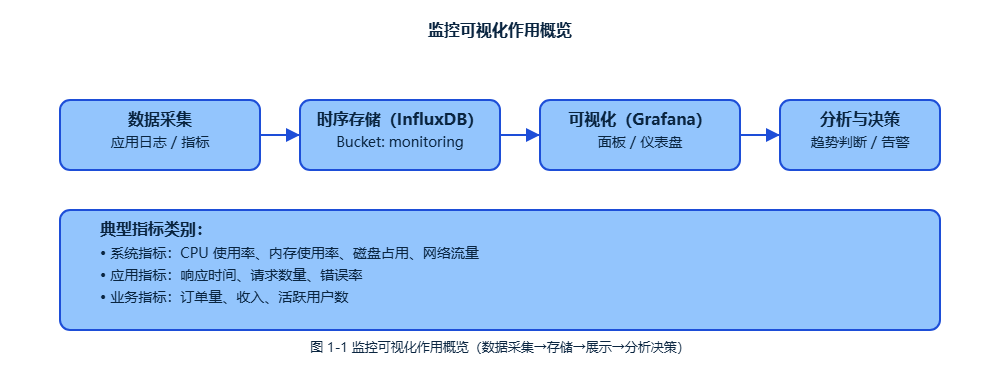
数据收集了一大堆,如果不能直观地展示出来,那就像有了金矿却不知道怎么挖。Grafana就是那把挖金子的铲子,能把InfluxDB里的时序数据变成漂亮的图表和仪表盘。
监控数据可视化不只是为了好看,更重要的是能让我们快速发现问题、分析趋势、做出决策。一张图胜过千行日志,这话一点不假。
1.1 Grafana的核心优势
丰富的图表类型
从简单的折线图到复杂的热力图,Grafana支持几十种可视化方式。不管是展示CPU使用率的时间趋势,还是显示服务器状态的仪表盘,都能找到合适的图表类型。
强大的查询编辑器
Grafana内置了InfluxQL和Flux查询编辑器,支持语法高亮、自动补全、查询历史等功能。即使不熟悉查询语言,也能通过可视化界面构建复杂查询。
灵活的告警机制
可以基于查询结果设置告警规则,支持邮件、钉钉、Slack等多种通知方式。当CPU使用率超过阈值时,立即发送告警通知。
1.2 架构设计思路
我们的监控可视化架构包含三个核心组件:
应用程序 → InfluxDB → Grafana → 用户界面
    ↓         ↓         ↓
  数据采集   数据存储   数据展示
这种架构的好处是职责分离,每个组件专注做好自己的事情。应用程序负责收集指标,InfluxDB负责高效存储,Grafana负责美观展示。
2 环境搭建与配置
图 2-1 Docker Compose 部署拓扑(容器、端口与依赖关系)
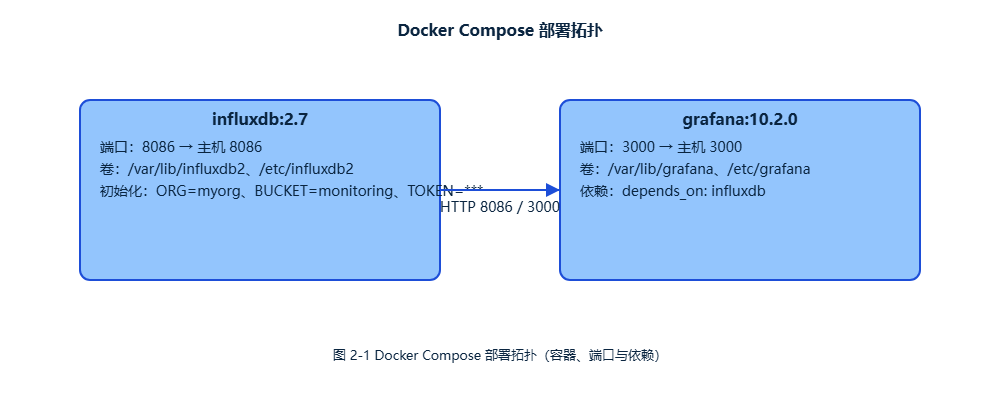
2.1 Docker快速部署
最简单的方式是用Docker Compose一键部署整套环境。
yaml
version: '3.8'

services:
  influxdb:
    image: influxdb:2.7
    container_name: influxdb
    ports:
      - "8086:8086"
    environment:
      - DOCKER_INFLUXDB_INIT_MODE=setup
      - DOCKER_INFLUXDB_INIT_USERNAME=admin
      - DOCKER_INFLUXDB_INIT_PASSWORD=password123
      - DOCKER_INFLUXDB_INIT_ORG=myorg
      - DOCKER_INFLUXDB_INIT_BUCKET=monitoring
      - DOCKER_INFLUXDB_INIT_ADMIN_TOKEN=my-super-secret-auth-token
    volumes:
      - influxdb-data:/var/lib/influxdb2
      - influxdb-config:/etc/influxdb2

  grafana:
    image: grafana/grafana:10.2.0
    container_name: grafana
    ports:
      - "3000:3000"
    environment:
      - GF_SECURITY_ADMIN_PASSWORD=admin123
      - GF_INSTALL_PLUGINS=grafana-clock-panel,grafana-simple-json-datasource
    volumes:
      - grafana-data:/var/lib/grafana
      - grafana-config:/etc/grafana
    depends_on:
      - influxdb

volumes:
  influxdb-data:
  influxdb-config:
  grafana-data:
  grafana-config:
启动命令很简单:
bash
docker-compose up -d等容器启动完成后,访问 http://localhost:3000 就能看到Grafana登录界面,用户名admin,密码admin123。
2.2 数据源配置
在Grafana中添加InfluxDB数据源是第一步。进入Configuration → Data Sources → Add data source,选择InfluxDB。
InfluxDB 2.x配置参数:
- URL: http://influxdb:8086
- Organization: myorg
- Token: my-super-secret-auth-token
- Default Bucket: monitoring
配置完成后点击"Save & Test",看到绿色的"Data source is working"就说明连接成功了。
3 Java应用集成Grafana
3.1 监控数据生产者
首先我们需要一个Java应用来产生监控数据。这里创建一个完整的监控数据生产者。
java
import com.influxdb.client.InfluxDBClient;
import com.influxdb.client.InfluxDBClientFactory;
import com.influxdb.client.WriteApiBlocking;
import com.influxdb.client.domain.WritePrecision;
import com.influxdb.client.write.Point;
import org.springframework.boot.SpringApplication;
import org.springframework.boot.autoconfigure.SpringBootApplication;
import org.springframework.scheduling.annotation.EnableScheduling;
import org.springframework.scheduling.annotation.Scheduled;
import org.springframework.stereotype.Component;

import javax.annotation.PostConstruct;
import javax.annotation.PreDestroy;
import java.lang.management.ManagementFactory;
import java.lang.management.MemoryMXBean;
import java.lang.management.OperatingSystemMXBean;
import java.time.Instant;
import java.util.Random;
import java.util.concurrent.ThreadLocalRandom;

@SpringBootApplication
@EnableScheduling
public class MonitoringApplication {
    public static void main(String[] args) {
        SpringApplication.run(MonitoringApplication.class, args);
    }
}

@Component
public class MetricsProducer {

    private InfluxDBClient influxDBClient;
    private WriteApiBlocking writeApi;
    private final Random random = new Random();
    private final String hostname = "demo-server";

    @PostConstruct
    public void init() {
        this.influxDBClient = InfluxDBClientFactory.create(
            "http://localhost:8086",
            "my-super-secret-auth-token".toCharArray(),
            "myorg",
            "monitoring"
        );
        this.writeApi = influxDBClient.getWriteApiBlocking();
    }

    @Scheduled(fixedRate = 5000) // 每5秒执行一次
    public void collectSystemMetrics() {
        try {
            Instant timestamp = Instant.now();

            // 收集真实的系统指标
            OperatingSystemMXBean osBean = ManagementFactory.getOperatingSystemMXBean();
            MemoryMXBean memoryBean = ManagementFactory.getMemoryMXBean();

            // CPU使用率(模拟数据,因为Java获取CPU使用率比较复杂)
            double cpuUsage = 20 + random.nextGaussian() * 10;
            cpuUsage = Math.max(0, Math.min(100, cpuUsage));

            Point cpuPoint = Point.measurement("system_metrics")
                .addTag("host", hostname)
                .addTag("metric_type", "cpu")
                .addField("usage_percent", cpuUsage)
                .time(timestamp, WritePrecision.NS);

            // 内存使用率
            long usedMemory = memoryBean.getHeapMemoryUsage().getUsed();
            long maxMemory = memoryBean.getHeapMemoryUsage().getMax();
            double memoryUsage = (double) usedMemory / maxMemory * 100;

            Point memoryPoint = Point.measurement("system_metrics")
                .addTag("host", hostname)
                .addTag("metric_type", "memory")
                .addField("used_bytes", usedMemory)
                .addField("max_bytes", maxMemory)
                .addField("usage_percent", memoryUsage)
                .time(timestamp, WritePrecision.NS);

            // 磁盘使用率(模拟数据)
            double diskUsage = 45 + random.nextGaussian() * 5;
            diskUsage = Math.max(0, Math.min(100, diskUsage));

            Point diskPoint = Point.measurement("system_metrics")
                .addTag("host", hostname)
                .addTag("metric_type", "disk")
                .addTag("mount_point", "/")
                .addField("usage_percent", diskUsage)
                .time(timestamp, WritePrecision.NS);

            // 网络流量(模拟数据)
            long networkIn = ThreadLocalRandom.current().nextLong(1000000, 10000000);
            long networkOut = ThreadLocalRandom.current().nextLong(500000, 5000000);

            Point networkPoint = Point.measurement("network_metrics")
                .addTag("host", hostname)
                .addTag("interface", "eth0")
                .addField("bytes_in", networkIn)
                .addField("bytes_out", networkOut)
                .time(timestamp, WritePrecision.NS);

            // 批量写入
            writeApi.writePoints(Arrays.asList(cpuPoint, memoryPoint, diskPoint, networkPoint));

        } catch (Exception e) {
            System.err.println("收集系统指标失败: " + e.getMessage());
        }
    }

    @Scheduled(fixedRate = 10000) // 每10秒执行一次
    public void collectApplicationMetrics() {
        try {
            Instant timestamp = Instant.now();

            // 模拟应用性能指标
            double responseTime = 100 + random.nextGaussian() * 50;
            responseTime = Math.max(10, responseTime);

            int requestCount = ThreadLocalRandom.current().nextInt(50, 200);
            int errorCount = ThreadLocalRandom.current().nextInt(0, 5);
            double errorRate = (double) errorCount / requestCount * 100;

            Point appPoint = Point.measurement("application_metrics")
                .addTag("service", "user-service")
                .addTag("endpoint", "/api/users")
                .addField("response_time_ms", responseTime)
                .addField("request_count", requestCount)
                .addField("error_count", errorCount)
                .addField("error_rate_percent", errorRate)
                .time(timestamp, WritePrecision.NS);

            // 数据库连接池指标
            int activeConnections = ThreadLocalRandom.current().nextInt(5, 20);
            int idleConnections = ThreadLocalRandom.current().nextInt(10, 30);
            int totalConnections = activeConnections + idleConnections;

            Point dbPoint = Point.measurement("database_metrics")
                .addTag("pool_name", "hikari-pool")
                .addField("active_connections", activeConnections)
                .addField("idle_connections", idleConnections)
                .addField("total_connections", totalConnections)
                .time(timestamp, WritePrecision.NS);

            writeApi.writePoints(Arrays.asList(appPoint, dbPoint));

        } catch (Exception e) {
            System.err.println("收集应用指标失败: " + e.getMessage());
        }
    }

    @Scheduled(fixedRate = 30000) // 每30秒执行一次
    public void collectBusinessMetrics() {
        try {
            Instant timestamp = Instant.now();

            // 模拟业务指标
            int userRegistrations = ThreadLocalRandom.current().nextInt(0, 10);
            int orderCount = ThreadLocalRandom.current().nextInt(20, 100);
            double revenue = ThreadLocalRandom.current().nextDouble(1000, 5000);
            int activeUsers = ThreadLocalRandom.current().nextInt(500, 2000);

            Point businessPoint = Point.measurement("business_metrics")
                .addTag("region", "beijing")
                .addTag("product", "mobile_app")
                .addField("user_registrations", userRegistrations)
                .addField("order_count", orderCount)
                .addField("revenue", revenue)
                .addField("active_users", activeUsers)
                .time(timestamp, WritePrecision.NS);

            writeApi.writePoint(businessPoint);

        } catch (Exception e) {
            System.err.println("收集业务指标失败: " + e.getMessage());
        }
    }

    @PreDestroy
    public void cleanup() {
        if (influxDBClient != null) {
            influxDBClient.close();
        }
    }
}
3.2 Grafana API集成
有时候我们需要通过程序来管理Grafana的仪表盘、数据源等。Grafana提供了完整的REST API。
java
import com.fasterxml.jackson.databind.JsonNode;
import com.fasterxml.jackson.databind.ObjectMapper;
import org.springframework.http.*;
import org.springframework.stereotype.Service;
import org.springframework.web.client.RestTemplate;

import java.util.HashMap;
import java.util.Map;

@Service
public class GrafanaApiService {

    private final RestTemplate restTemplate;
    private final ObjectMapper objectMapper;
    private final String grafanaUrl = "http://localhost:3000";
    private final String apiKey = "your-grafana-api-key"; // 需要在Grafana中生成

    public GrafanaApiService() {
        this.restTemplate = new RestTemplate();
        this.objectMapper = new ObjectMapper();
    }

    private HttpHeaders createHeaders() {
        HttpHeaders headers = new HttpHeaders();
        headers.setContentType(MediaType.APPLICATION_JSON);
        headers.setBearerAuth(apiKey);
        return headers;
    }

    // 创建数据源
    public String createDataSource(String name, String url, String token, String org, String bucket) {
        try {
            Map<String, Object> dataSource = new HashMap<>();
            dataSource.put("name", name);
            dataSource.put("type", "influxdb");
            dataSource.put("url", url);
            dataSource.put("access", "proxy");
            dataSource.put("isDefault", false);

            Map<String, Object> jsonData = new HashMap<>();
            jsonData.put("version", "Flux");
            jsonData.put("organization", org);
            jsonData.put("defaultBucket", bucket);
            jsonData.put("httpMode", "POST");
            dataSource.put("jsonData", jsonData);

            Map<String, Object> secureJsonData = new HashMap<>();
            secureJsonData.put("token", token);
            dataSource.put("secureJsonData", secureJsonData);

            HttpEntity<Map<String, Object>> request = new HttpEntity<>(dataSource, createHeaders());
            ResponseEntity<String> response = restTemplate.postForEntity(
                grafanaUrl + "/api/datasources", request, String.class);

            return response.getBody();

        } catch (Exception e) {
            throw new RuntimeException("创建数据源失败", e);
        }
    }

    // 创建仪表盘
    public String createDashboard(String title, String description) {
        try {
            Map<String, Object> dashboard = createSystemMonitoringDashboard(title, description);

            Map<String, Object> request = new HashMap<>();
            request.put("dashboard", dashboard);
            request.put("overwrite", true);
            request.put("message", "Created by Java API");

            HttpEntity<Map<String, Object>> httpRequest = new HttpEntity<>(request, createHeaders());
            ResponseEntity<String> response = restTemplate.postForEntity(
                grafanaUrl + "/api/dashboards/db", httpRequest, String.class);

            return response.getBody();

        } catch (Exception e) {
            throw new RuntimeException("创建仪表盘失败", e);
        }
    }

    private Map<String, Object> createSystemMonitoringDashboard(String title, String description) {
        Map<String, Object> dashboard = new HashMap<>();
        dashboard.put("title", title);
        dashboard.put("description", description);
        dashboard.put("tags", new String[]{"monitoring", "system"});
        dashboard.put("timezone", "browser");
        dashboard.put("refresh", "30s");

        // 时间范围设置
        Map<String, Object> time = new HashMap<>();
        time.put("from", "now-1h");
        time.put("to", "now");
        dashboard.put("time", time);

        // 创建面板
        dashboard.put("panels", createPanels());

        return dashboard;
    }

    private Object[] createPanels() {
        return new Object[] {
            createCpuPanel(),
            createMemoryPanel(),
            createDiskPanel(),
            createNetworkPanel(),
            createApplicationPanel()
        };
    }

    private Map<String, Object> createCpuPanel() {
        Map<String, Object> panel = new HashMap<>();
        panel.put("id", 1);
        panel.put("title", "CPU使用率");
        panel.put("type", "timeseries");
        panel.put("gridPos", Map.of("h", 8, "w", 12, "x", 0, "y", 0));

        // 查询配置
        Map<String, Object> target = new HashMap<>();
        target.put("query",
            "from(bucket: \"monitoring\") " +
            "|> range(start: v.timeRangeStart, stop: v.timeRangeStop) " +
            "|> filter(fn: (r) => r._measurement == \"system_metrics\") " +
            "|> filter(fn: (r) => r.metric_type == \"cpu\") " +
            "|> filter(fn: (r) => r._field == \"usage_percent\")");
        target.put("refId", "A");

        panel.put("targets", new Object[]{target});

        // 图表选项
        Map<String, Object> fieldConfig = new HashMap<>();
        Map<String, Object> defaults = new HashMap<>();
        defaults.put("unit", "percent");
        defaults.put("min", 0);
        defaults.put("max", 100);
        fieldConfig.put("defaults", defaults);
        panel.put("fieldConfig", fieldConfig);

        return panel;
    }

    private Map<String, Object> createMemoryPanel() {
        Map<String, Object> panel = new HashMap<>();
        panel.put("id", 2);
        panel.put("title", "内存使用率");
        panel.put("type", "timeseries");
        panel.put("gridPos", Map.of("h", 8, "w", 12, "x", 12, "y", 0));

        Map<String, Object> target = new HashMap<>();
        target.put("query",
            "from(bucket: \"monitoring\") " +
            "|> range(start: v.timeRangeStart, stop: v.timeRangeStop) " +
            "|> filter(fn: (r) => r._measurement == \"system_metrics\") " +
            "|> filter(fn: (r) => r.metric_type == \"memory\") " +
            "|> filter(fn: (r) => r._field == \"usage_percent\")");
        target.put("refId", "A");

        panel.put("targets", new Object[]{target});

        Map<String, Object> fieldConfig = new HashMap<>();
        Map<String, Object> defaults = new HashMap<>();
        defaults.put("unit", "percent");
        defaults.put("min", 0);
        defaults.put("max", 100);
        fieldConfig.put("defaults", defaults);
        panel.put("fieldConfig", fieldConfig);

        return panel;
    }

    private Map<String, Object> createDiskPanel() {
        Map<String, Object> panel = new HashMap<>();
        panel.put("id", 3);
        panel.put("title", "磁盘使用率");
        panel.put("type", "gauge");
        panel.put("gridPos", Map.of("h", 8, "w", 8, "x", 0, "y", 8));

        Map<String, Object> target = new HashMap<>();
        target.put("query",
            "from(bucket: \"monitoring\") " +
            "|> range(start: v.timeRangeStart, stop: v.timeRangeStop) " +
            "|> filter(fn: (r) => r._measurement == \"system_metrics\") " +
            "|> filter(fn: (r) => r.metric_type == \"disk\") " +
            "|> filter(fn: (r) => r._field == \"usage_percent\") " +
            "|> last()");
        target.put("refId", "A");

        panel.put("targets", new Object[]{target});

        Map<String, Object> fieldConfig = new HashMap<>();
        Map<String, Object> defaults = new HashMap<>();
        defaults.put("unit", "percent");
        defaults.put("min", 0);
        defaults.put("max", 100);

        // 阈值设置
        Map<String, Object> thresholds = new HashMap<>();
        thresholds.put("mode", "absolute");
        thresholds.put("steps", new Object[]{
            Map.of("color", "green", "value", 0),
            Map.of("color", "yellow", "value", 70),
            Map.of("color", "red", "value", 90)
        });
        defaults.put("thresholds", thresholds);

        fieldConfig.put("defaults", defaults);
        panel.put("fieldConfig", fieldConfig);

        return panel;
    }

    private Map<String, Object> createNetworkPanel() {
        Map<String, Object> panel = new HashMap<>();
        panel.put("id", 4);
        panel.put("title", "网络流量");
        panel.put("type", "timeseries");
        panel.put("gridPos", Map.of("h", 8, "w", 8, "x", 8, "y", 8));

        // 入站流量查询
        Map<String, Object> targetIn = new HashMap<>();
        targetIn.put("query",
            "from(bucket: \"monitoring\") " +
            "|> range(start: v.timeRangeStart, stop: v.timeRangeStop) " +
            "|> filter(fn: (r) => r._measurement == \"network_metrics\") " +
            "|> filter(fn: (r) => r._field == \"bytes_in\") " +
            "|> derivative(unit: 1s, nonNegative: true)");
        targetIn.put("refId", "A");
        targetIn.put("alias", "入站流量");

        // 出站流量查询
        Map<String, Object> targetOut = new HashMap<>();
        targetOut.put("query",
            "from(bucket: \"monitoring\") " +
            "|> range(start: v.timeRangeStart, stop: v.timeRangeStop) " +
            "|> filter(fn: (r) => r._measurement == \"network_metrics\") " +
            "|> filter(fn: (r) => r._field == \"bytes_out\") " +
            "|> derivative(unit: 1s, nonNegative: true)");
        targetOut.put("refId", "B");
        targetOut.put("alias", "出站流量");

        panel.put("targets", new Object[]{targetIn, targetOut});

        Map<String, Object> fieldConfig = new HashMap<>();
        Map<String, Object> defaults = new HashMap<>();
        defaults.put("unit", "Bps");
        fieldConfig.put("defaults", defaults);
        panel.put("fieldConfig", fieldConfig);

        return panel;
    }

    private Map<String, Object> createApplicationPanel() {
        Map<String, Object> panel = new HashMap<>();
        panel.put("id", 5);
        panel.put("title", "应用响应时间");
        panel.put("type", "stat");
        panel.put("gridPos", Map.of("h", 8, "w", 8, "x", 16, "y", 8));

        Map<String, Object> target = new HashMap<>();
        target.put("query",
            "from(bucket: \"monitoring\") " +
            "|> range(start: v.timeRangeStart, stop: v.timeRangeStop) " +
            "|> filter(fn: (r) => r._measurement == \"application_metrics\") " +
            "|> filter(fn: (r) => r._field == \"response_time_ms\") " +
            "|> mean()");
        target.put("refId", "A");

        panel.put("targets", new Object[]{target});

        Map<String, Object> fieldConfig = new HashMap<>();
        Map<String, Object> defaults = new HashMap<>();
        defaults.put("unit", "ms");
        defaults.put("displayName", "平均响应时间");
        fieldConfig.put("defaults", defaults);
        panel.put("fieldConfig", fieldConfig);

        return panel;
    }

    // 获取仪表盘列表
    public String getDashboards() {
        try {
            HttpEntity<String> request = new HttpEntity<>(createHeaders());
            ResponseEntity<String> response = restTemplate.exchange(
                grafanaUrl + "/api/search?type=dash-db",
                HttpMethod.GET,
                request,
                String.class);

            return response.getBody();

        } catch (Exception e) {
            throw new RuntimeException("获取仪表盘列表失败", e);
        }
    }

    // 删除仪表盘
    public String deleteDashboard(String uid) {
        try {
            HttpEntity<String> request = new HttpEntity<>(createHeaders());
            ResponseEntity<String> response = restTemplate.exchange(
                grafanaUrl + "/api/dashboards/uid/" + uid,
                HttpMethod.DELETE,
                request,
                String.class);

            return response.getBody();

        } catch (Exception e) {
            throw new RuntimeException("删除仪表盘失败", e);
        }
    }
}
3.3 自动化仪表盘管理
我们可以创建一个管理服务,自动化地创建和更新Grafana仪表盘。
java
@Service
public class DashboardManagementService {

    private final GrafanaApiService grafanaApiService;
    private final ObjectMapper objectMapper;

    public DashboardManagementService(GrafanaApiService grafanaApiService) {
        this.grafanaApiService = grafanaApiService;
        this.objectMapper = new ObjectMapper();
    }

    @PostConstruct
    public void initializeDashboards() {
        try {
            // 创建系统监控仪表盘
            createSystemMonitoringDashboard();

            // 创建应用性能仪表盘
            createApplicationPerformanceDashboard();

            // 创建业务指标仪表盘
            createBusinessMetricsDashboard();

        } catch (Exception e) {
            System.err.println("初始化仪表盘失败: " + e.getMessage());
        }
    }

    private void createSystemMonitoringDashboard() {
        try {
            String result = grafanaApiService.createDashboard(
                "系统监控总览",
                "服务器系统资源监控,包括CPU、内存、磁盘、网络等指标"
            );

            JsonNode response = objectMapper.readTree(result);
            if (response.has("uid")) {
                System.out.println("系统监控仪表盘创建成功,UID: " + response.get("uid").asText());
            }

        } catch (Exception e) {
            System.err.println("创建系统监控仪表盘失败: " + e.getMessage());
        }
    }

    private void createApplicationPerformanceDashboard() {
        // 这里可以创建专门的应用性能监控仪表盘
        // 包含响应时间、吞吐量、错误率等指标
    }

    private void createBusinessMetricsDashboard() {
        // 这里可以创建业务指标监控仪表盘
        // 包含用户注册、订单量、收入等业务相关指标
    }

    // 定期更新仪表盘配置
    @Scheduled(cron = "0 0 2 * * ?") // 每天凌晨2点执行
    public void updateDashboards() {
        try {
            // 获取现有仪表盘列表
            String dashboardsJson = grafanaApiService.getDashboards();
            JsonNode dashboards = objectMapper.readTree(dashboardsJson);

            for (JsonNode dashboard : dashboards) {
                String title = dashboard.get("title").asText();
                String uid = dashboard.get("uid").asText();

                // 根据标题判断是否需要更新
                if (title.contains("系统监控")) {
                    updateSystemMonitoringDashboard(uid);
                }
            }

        } catch (Exception e) {
            System.err.println("更新仪表盘失败: " + e.getMessage());
        }
    }

    private void updateSystemMonitoringDashboard(String uid) {
        // 这里可以实现仪表盘的更新逻辑
        // 比如添加新的面板、修改查询语句等
    }
}
4 高级可视化技巧
4.1 动态仪表盘变量
Grafana支持变量功能,可以让用户动态选择要查看的服务器、时间范围等。这样一个仪表盘就能适应不同的查看需求。
java
@Service
public class DynamicDashboardService {

    public Map<String, Object> createDashboardWithVariables() {
        Map<String, Object> dashboard = new HashMap<>();
        dashboard.put("title", "动态系统监控");

        // 创建变量
        Object[] templating = createTemplatingVariables();
        dashboard.put("templating", Map.of("list", templating));

        // 创建使用变量的面板
        dashboard.put("panels", createDynamicPanels());

        return dashboard;
    }

    private Object[] createTemplatingVariables() {
        return new Object[] {
            createHostVariable(),
            createMetricTypeVariable(),
            createTimeRangeVariable()
        };
    }

    private Map<String, Object> createHostVariable() {
        Map<String, Object> variable = new HashMap<>();
        variable.put("name", "host");
        variable.put("type", "query");
        variable.put("label", "服务器");
        variable.put("multi", true);
        variable.put("includeAll", true);

        // 查询所有主机名
        Map<String, Object> query = new HashMap<>();
        query.put("query",
            "from(bucket: \"monitoring\") " +
            "|> range(start: -24h) " +
            "|> filter(fn: (r) => r._measurement == \"system_metrics\") " +
            "|> keep(columns: [\"host\"]) " +
            "|> distinct(column: \"host\")");
        query.put("refId", "hosts");

        variable.put("query", query);
        variable.put("refresh", 1); // 每次打开仪表盘时刷新

        return variable;
    }

    private Map<String, Object> createMetricTypeVariable() {
        Map<String, Object> variable = new HashMap<>();
        variable.put("name", "metric_type");
        variable.put("type", "custom");
        variable.put("label", "指标类型");
        variable.put("multi", false);

        // 自定义选项
        variable.put("options", new Object[] {
            Map.of("text", "CPU", "value", "cpu"),
            Map.of("text", "内存", "value", "memory"),
            Map.of("text", "磁盘", "value", "disk")
        });

        variable.put("current", Map.of("text", "CPU", "value", "cpu"));

        return variable;
    }

    private Map<String, Object> createTimeRangeVariable() {
        Map<String, Object> variable = new HashMap<>();
        variable.put("name", "time_range");
        variable.put("type", "interval");
        variable.put("label", "时间间隔");

        variable.put("options", new Object[] {
            Map.of("text", "1分钟", "value", "1m"),
            Map.of("text", "5分钟", "value", "5m"),
            Map.of("text", "15分钟", "value", "15m"),
            Map.of("text", "1小时", "value", "1h")
        });

        variable.put("current", Map.of("text", "5分钟", "value", "5m"));

        return variable;
    }

    private Object[] createDynamicPanels() {
        return new Object[] {
            createDynamicMetricPanel()
        };
    }

    private Map<String, Object> createDynamicMetricPanel() {
        Map<String, Object> panel = new HashMap<>();
        panel.put("id", 1);
        panel.put("title", "动态指标监控 - $metric_type");
        panel.put("type", "timeseries");
        panel.put("gridPos", Map.of("h", 8, "w", 24, "x", 0, "y", 0));

        // 使用变量的查询
        Map<String, Object> target = new HashMap<>();
        target.put("query",
            "from(bucket: \"monitoring\") " +
            "|> range(start: v.timeRangeStart, stop: v.timeRangeStop) " +
            "|> filter(fn: (r) => r._measurement == \"system_metrics\") " +
            "|> filter(fn: (r) => r.metric_type == \"$metric_type\") " +
            "|> filter(fn: (r) => r.host =~ /^$host$/) " +
            "|> filter(fn: (r) => r._field == \"usage_percent\") " +
            "|> aggregateWindow(every: $time_range, fn: mean, createEmpty: false)");
        target.put("refId", "A");

        panel.put("targets", new Object[]{target});

        return panel;
    }
}
4.2 告警规则配置
Grafana的告警功能可以基于查询结果触发通知。我们可以通过API来配置告警规则。
java
@Service
public class AlertRuleService {

    private final GrafanaApiService grafanaApiService;

    public AlertRuleService(GrafanaApiService grafanaApiService) {
        this.grafanaApiService = grafanaApiService;
    }

    public void createCpuAlertRule() {
        Map<String, Object> alertRule = new HashMap<>();
        alertRule.put("uid", "cpu-high-alert");
        alertRule.put("title", "CPU使用率过高告警");
        alertRule.put("condition", "A");
        alertRule.put("data", createCpuAlertData());
        alertRule.put("noDataState", "NoData");
        alertRule.put("execErrState", "Alerting");
        alertRule.put("for", "5m"); // 持续5分钟才触发告警

        // 告警注解
        Map<String, String> annotations = new HashMap<>();
        annotations.put("summary", "服务器CPU使用率超过阈值");
        annotations.put("description", "服务器 {{ $labels.host }} CPU使用率为 {{ $value }}%,超过80%阈值");
        alertRule.put("annotations", annotations);

        // 告警标签
        Map<String, String> labels = new HashMap<>();
        labels.put("severity", "warning");
        labels.put("team", "infrastructure");
        alertRule.put("labels", labels);

        // 这里需要调用Grafana的告警API
        // 实际实现需要根据Grafana版本调整
    }

    private Object[] createCpuAlertData() {
        Map<String, Object> query = new HashMap<>();
        query.put("refId", "A");
        query.put("queryType", "");
        query.put("model", Map.of(
            "query",
            "from(bucket: \"monitoring\") " +
            "|> range(start: -5m) " +
            "|> filter(fn: (r) => r._measurement == \"system_metrics\") " +
            "|> filter(fn: (r) => r.metric_type == \"cpu\") " +
            "|> filter(fn: (r) => r._field == \"usage_percent\") " +
            "|> mean()",
            "refId", "A"
        ));

        Map<String, Object> condition = new HashMap<>();
        condition.put("refId", "B");
        condition.put("queryType", "");
        condition.put("model", Map.of(
            "conditions", new Object[] {
                Map.of(
                    "evaluator", Map.of("params", new double[]{80}, "type", "gt"),
                    "operator", Map.of("type", "and"),
                    "query", Map.of("params", new String[]{"A"}),
                    "reducer", Map.of("params", new Object[]{}, "type", "last"),
                    "type", "query"
                )
            },
            "refId", "B"
        ));

        return new Object[]{query, condition};
    }

    public void createMemoryAlertRule() {
        // 类似CPU告警的内存告警规则
    }

    public void createResponseTimeAlertRule() {
        // 应用响应时间告警规则
    }
}
5 性能优化与最佳实践
5.1 查询优化
Grafana的性能很大程度上取决于底层查询的效率。优化查询是提升仪表盘性能的关键。
java
@Service
public class QueryOptimizationService {

    // 使用聚合窗口减少数据点
    public String createOptimizedTimeSeriesQuery(String measurement, String field, String timeRange) {
        return String.format(
            "from(bucket: \"monitoring\") " +
            "|> range(start: %s) " +
            "|> filter(fn: (r) => r._measurement == \"%s\") " +
            "|> filter(fn: (r) => r._field == \"%s\") " +
            "|> aggregateWindow(every: %s, fn: mean, createEmpty: false)",
            timeRange, measurement, field, calculateAggregationInterval(timeRange)
        );
    }

    private String calculateAggregationInterval(String timeRange) {
        // 根据时间范围自动计算合适的聚合间隔
        if (timeRange.contains("1h")) return "30s";
        if (timeRange.contains("6h")) return "2m";
        if (timeRange.contains("24h")) return "5m";
        if (timeRange.contains("7d")) return "30m";
        return "1m";
    }

    // 使用下采样减少数据传输
    public String createDownsampledQuery(String measurement, String field, String timeRange) {
        return String.format(
            "from(bucket: \"monitoring\") " +
            "|> range(start: %s) " +
            "|> filter(fn: (r) => r._measurement == \"%s\") " +
            "|> filter(fn: (r) => r._field == \"%s\") " +
            "|> aggregateWindow(every: 1m, fn: mean) " +
            "|> limit(n: 1000)", // 限制返回的数据点数量
            timeRange, measurement, field
        );
    }

    // 并行查询多个指标
    public Map<String, String> createParallelQueries(String[] metrics, String timeRange) {
        Map<String, String> queries = new HashMap<>();

        for (int i = 0; i < metrics.length; i++) {
            String refId = String.valueOf((char)('A' + i));
            queries.put(refId, createOptimizedTimeSeriesQuery("system_metrics", metrics[i], timeRange));
        }

        return queries;
    }
}
5.2 缓存策略
对于更新频率不高的数据,可以使用缓存来提升查询性能。
java
@Service
public class DashboardCacheService {

    private final RedisTemplate<String, String> redisTemplate;
    private final InfluxDBClient influxDBClient;

    public DashboardCacheService(RedisTemplate<String, String> redisTemplate,
                               InfluxDBClient influxDBClient) {
        this.redisTemplate = redisTemplate;
        this.influxDBClient = influxDBClient;
    }

    @Cacheable(value = "dashboard-data", key = "#query + '-' + #timeRange")
    public String getCachedQueryResult(String query, String timeRange) {
        try {
            QueryApi queryApi = influxDBClient.getQueryApi();
            List<FluxTable> tables = queryApi.query(query);

            // 将查询结果转换为JSON格式
            return convertTablesToJson(tables);

        } catch (Exception e) {
            throw new RuntimeException("查询失败", e);
        }
    }

    private String convertTablesToJson(List<FluxTable> tables) {
        // 实现FluxTable到JSON的转换
        ObjectMapper mapper = new ObjectMapper();
        List<Map<String, Object>> result = new ArrayList<>();

        for (FluxTable table : tables) {
            for (FluxRecord record : table.getRecords()) {
                Map<String, Object> point = new HashMap<>();
                point.put("time", record.getTime());
                point.put("value", record.getValue());
                point.put("measurement", record.getMeasurement());
                point.put("field", record.getField());

                // 添加所有标签
                record.getValues().forEach((key, value) -> {
                    if (key.startsWith("_") || key.equals("result") || key.equals("table")) {
                        return;
                    }
                    point.put(key, value);
                });

                result.add(point);
            }
        }

        try {
            return mapper.writeValueAsString(result);
        } catch (Exception e) {
            throw new RuntimeException("JSON转换失败", e);
        }
    }

    // 预热缓存
    @Scheduled(fixedRate = 300000) // 每5分钟执行一次
    public void warmupCache() {
        String[] commonQueries = {
            "from(bucket: \"monitoring\") |> range(start: -1h) |> filter(fn: (r) => r._measurement == \"system_metrics\")",
            "from(bucket: \"monitoring\") |> range(start: -24h) |> filter(fn: (r) => r._measurement == \"application_metrics\")"
        };

        for (String query : commonQueries) {
            try {
                getCachedQueryResult(query, "-1h");
            } catch (Exception e) {
                System.err.println("预热缓存失败: " + e.getMessage());
            }
        }
    }

    // 清理过期缓存
    @CacheEvict(value = "dashboard-data", allEntries = true)
    @Scheduled(cron = "0 0 */6 * * ?") // 每6小时清理一次
    public void clearExpiredCache() {
        System.out.println("清理仪表盘缓存");
    }
}
这套InfluxDB配合Grafana的可视化方案提供了完整的监控数据展示能力。从数据收集到可视化展示,再到告警通知,形成了一个闭环的监控体系。
关键是要根据实际业务需求来设计仪表盘,不要为了炫酷而炫酷。好的监控仪表盘应该能让人一眼就看出系统的健康状况,快速定位问题所在。记住,简洁明了比花里胡哨更重要。