项目概述
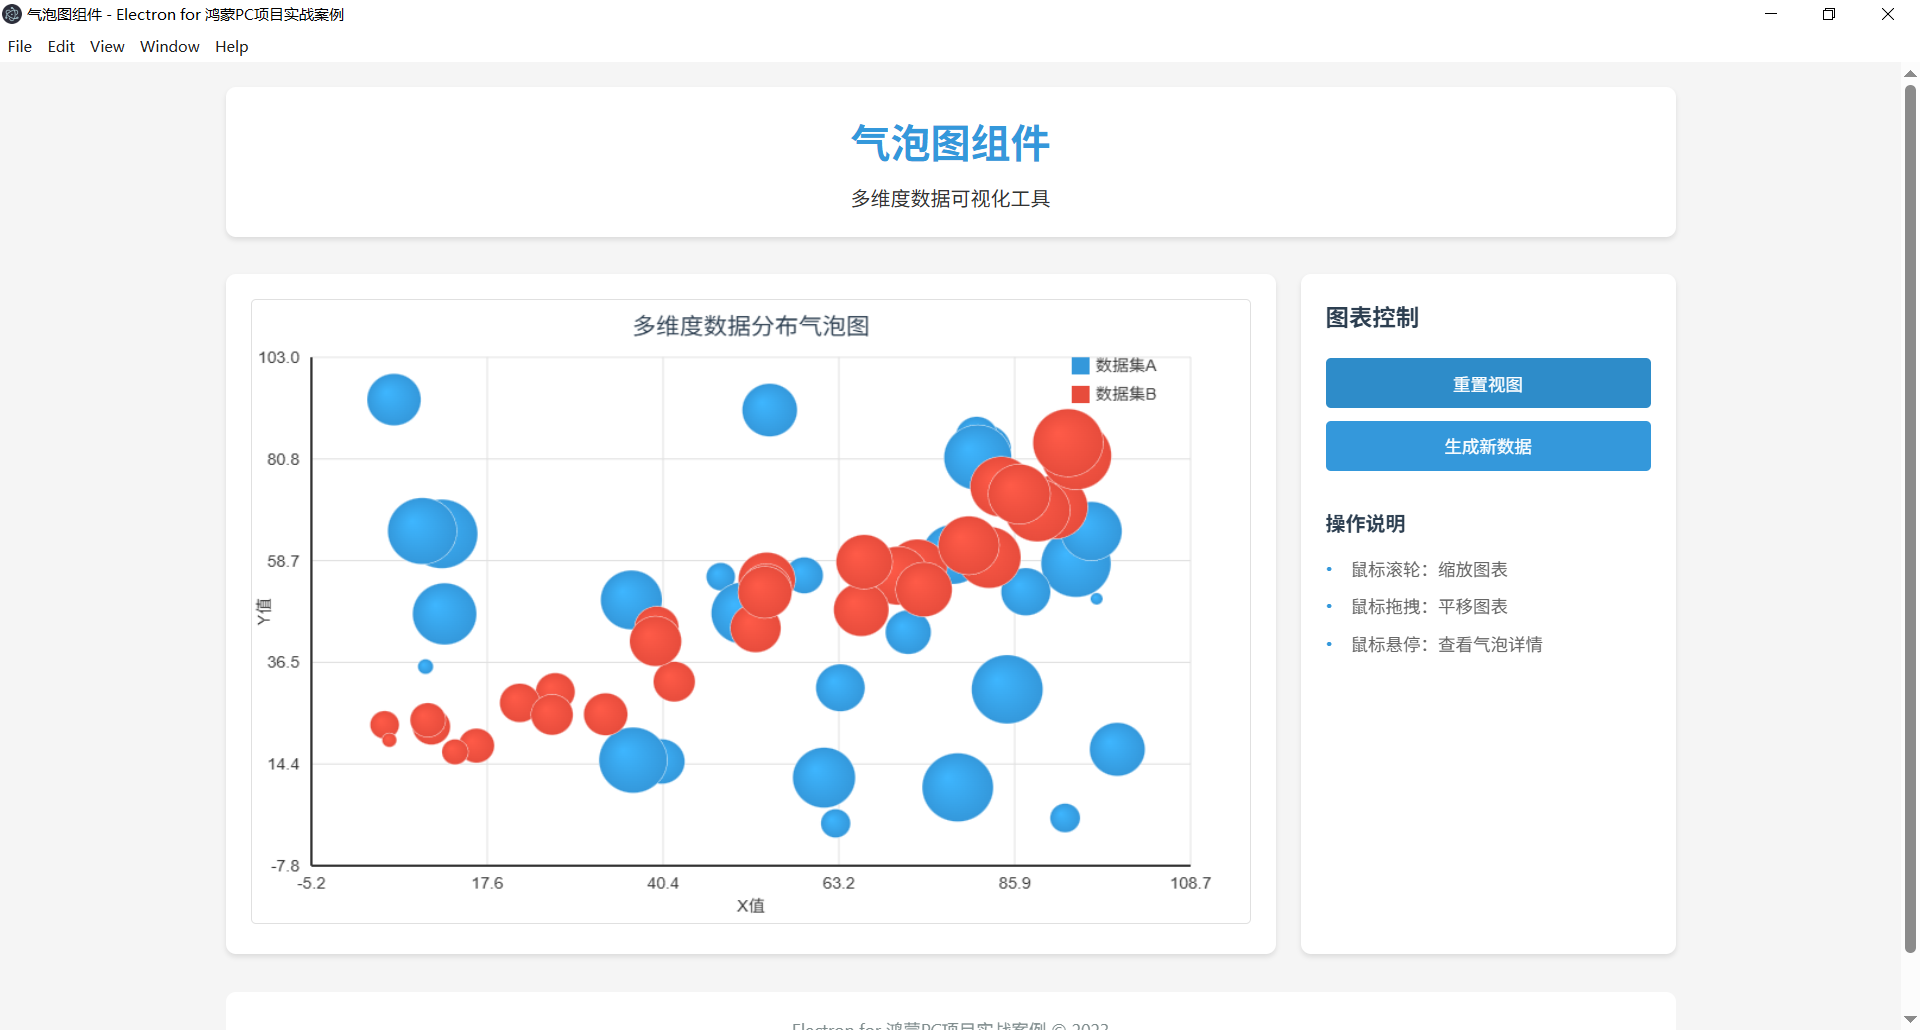
本项目是一个基于Electron框架开发的气泡图组件应用,为鸿蒙PC平台提供三维数据可视化功能。气泡图通过点的位置和大小同时展示三个维度的数据信息,适用于展示多维度数据的分布和关联关系。这是Electron初学者学习高级数据可视化的理想示例。
功能特点
- 气泡图渲染:使用Canvas API绘制精美的气泡图
- 三维数据可视化:同时展示X、Y坐标和气泡大小三个维度的数据
- 颜色映射:支持基于数据值的颜色映射功能
- 交互功能:支持气泡悬停提示、缩放、平移等交互操作
- 气泡大小映射:支持自定义气泡大小映射规则
- 网格与坐标轴:支持网格线和坐标轴的自定义配置
- 数据导入导出:支持CSV格式数据导入和JSON格式导出
- 响应式设计:适配不同窗口大小的界面布局
- 鸿蒙PC适配:针对鸿蒙PC平台优化的用户体验
技术架构
核心架构
- 主进程 (Main Process) :由
main.js实现,负责应用程序生命周期管理和窗口创建 - 渲染进程 (Renderer Process) :由
renderer.js实现,负责气泡图渲染和用户交互 - 预加载脚本 (Preload Script) :由
preload.js实现,提供安全的进程间通信桥接
文件结构
98-bubble-chart/
├── main.js         # 主进程文件,应用入口
├── preload.js      # 预加载脚本,进程通信
├── index.html      # 应用界面
├── style.css       # 样式文件
├── renderer.js     # 渲染进程逻辑
└── README.md       # 项目说明文档
核心代码解析
主进程 (main.js)
主进程负责创建和管理应用窗口,处理文件系统操作:
javascript
const { app, BrowserWindow } = require('electron');
const path = require('path');

function createWindow() {
  // 创建浏览器窗口并配置安全选项
  const win = new BrowserWindow({
    width: 800,
    height: 600,
    title: '气泡图组件 - Electron for 鸿蒙PC项目实战案例',
    webPreferences: {
      preload: path.join(__dirname, 'preload.js'),
      nodeIntegration: false,
      contextIsolation: true,
      sandbox: true
    }
  });

  win.loadFile('index.html');
}

// 应用生命周期管理
app.whenReady().then(() => {
  createWindow();

  app.on('activate', () => {
    if (BrowserWindow.getAllWindows().length === 0) createWindow();
  });
});

app.on('window-all-closed', () => {
  if (process.platform !== 'darwin') app.quit();
});
渲染进程 (renderer.js)
渲染进程负责气泡图的核心渲染逻辑:
javascript
class BubbleChart {
  constructor(canvasId, options = {}) {
    this.canvas = document.getElementById(canvasId);
    this.ctx = this.canvas.getContext('2d');
    this.data = options.data || [];
    this.title = options.title || '气泡图';
    this.xLabel = options.xLabel || 'X轴';
    this.yLabel = options.yLabel || 'Y轴';
    this.zLabel = options.zLabel || '气泡大小';
    this.colors = options.colors || ['#3498db', '#e74c3c', '#2ecc71', '#f39c12', '#9b59b6'];
    this.minRadius = options.minRadius || 3;
    this.maxRadius = options.maxRadius || 25;
    this.margin = options.margin || { top: 50, right: 50, bottom: 50, left: 50 };
    this.zoom = 1;
    this.pan = { x: 0, y: 0 };
    this.isDragging = false;
    this.lastMousePos = { x: 0, y: 0 };
    this.tooltip = null;
    this.init();
  }

  // 初始化图表
  init() {
    this.calculateDimensions();
    this.calculateScales();
    this.render();
    this.bindEvents();
    this.createTooltip();
  }

  // 计算画布尺寸
  calculateDimensions() {
    this.width = this.canvas.width - this.margin.left - this.margin.right;
    this.height = this.canvas.height - this.margin.top - this.margin.bottom;
  }

  // 计算坐标轴刻度和气泡大小映射
  calculateScales() {
    if (this.data.length === 0) return;

    // 找出数据的最小值和最大值
    let minX = Infinity, maxX = -Infinity;
    let minY = Infinity, maxY = -Infinity;
    let minZ = Infinity, maxZ = -Infinity;

    this.data.forEach(dataset => {
      dataset.points.forEach(point => {
        minX = Math.min(minX, point.x);
        maxX = Math.max(maxX, point.x);
        minY = Math.min(minY, point.y);
        maxY = Math.max(maxY, point.y);
        minZ = Math.min(minZ, point.z);
        maxZ = Math.max(maxZ, point.z);
      });
    });

    // 添加一些边距
    const xPadding = (maxX - minX) * 0.1 || 1;
    const yPadding = (maxY - minY) * 0.1 || 1;

    this.xScale = {
      min: minX - xPadding,
      max: maxX + xPadding,
      range: maxX - minX + 2 * xPadding
    };

    this.yScale = {
      min: minY - yPadding,
      max: maxY + yPadding,
      range: maxY - minY + 2 * yPadding
    };

    this.zScale = {
      min: minZ,
      max: maxZ,
      range: maxZ - minZ || 1
    };
  }

  // 坐标转换
  toCanvasX(x) {
    return this.margin.left + ((x - this.xScale.min) / this.xScale.range * this.width) * this.zoom + this.pan.x;
  }

  toCanvasY(y) {
    return this.margin.top + (this.height - (y - this.yScale.min) / this.yScale.range * this.height) * this.zoom + this.pan.y;
  }

  // 计算气泡半径
  calculateRadius(z) {
    // 使用平方根映射,使气泡面积与z值成正比
    const zRatio = (z - this.zScale.min) / this.zScale.range;
    const radiusRange = this.maxRadius - this.minRadius;
    return this.minRadius + Math.sqrt(zRatio) * radiusRange;
  }

  // 绘制气泡图
  render() {
    // 清空画布
    this.ctx.clearRect(0, 0, this.canvas.width, this.canvas.height);

    // 绘制标题
    this.drawTitle();

    // 绘制坐标轴标签
    this.drawAxisLabels();

    // 绘制坐标轴和网格
    this.drawAxesAndGrid();

    // 绘制气泡
    this.data.forEach((dataset, index) => {
      const color = this.colors[index % this.colors.length];
      dataset.points.forEach(point => {
        this.drawBubble(point, color);
      });
    });

    // 绘制图例
    this.drawLegend();
  }

  // 绘制气泡
  drawBubble(point, color) {
    const x = this.toCanvasX(point.x);
    const y = this.toCanvasY(point.y);
    const radius = this.calculateRadius(point.z);

    // 绘制气泡外边框
    this.ctx.beginPath();
    this.ctx.arc(x, y, radius, 0, 2 * Math.PI);
    this.ctx.strokeStyle = '#fff';
    this.ctx.lineWidth = 1;
    this.ctx.stroke();

    // 绘制渐变填充
    const gradient = this.ctx.createRadialGradient(
      x - radius * 0.3, y - radius * 0.3, 0,
      x, y, radius
    );

    // 解析颜色,创建亮暗变体
    const baseColor = point.color || color;
    const lighterColor = this.lightenColor(baseColor, 20);

    gradient.addColorStop(0, lighterColor);
    gradient.addColorStop(1, baseColor);

    this.ctx.fillStyle = gradient;
    this.ctx.fill();
  }

  // 颜色加亮辅助函数
  lightenColor(color, percent) {
    // 简单实现,将十六进制颜色转为RGB并调整亮度
    let r = parseInt(color.slice(1, 3), 16);
    let g = parseInt(color.slice(3, 5), 16);
    let b = parseInt(color.slice(5, 7), 16);

    r = Math.min(255, Math.floor(r * (1 + percent / 100)));
    g = Math.min(255, Math.floor(g * (1 + percent / 100)));
    b = Math.min(255, Math.floor(b * (1 + percent / 100)));

    return `#${r.toString(16).padStart(2, '0')}${g.toString(16).padStart(2, '0')}${b.toString(16).padStart(2, '0')}`;
  }

  // 绘制坐标轴和网格
  drawAxesAndGrid() {
    this.ctx.save();

    // 绘制网格线
    this.ctx.strokeStyle = '#e0e0e0';
    this.ctx.lineWidth = 1;

    // 垂直线
    for (let i = 0; i <= 5; i++) {
      const x = this.toCanvasX(this.xScale.min + (this.xScale.range * i / 5));
      this.ctx.beginPath();
      this.ctx.moveTo(x, this.margin.top);
      this.ctx.lineTo(x, this.margin.top + this.height);
      this.ctx.stroke();

      // 绘制刻度标签
      this.ctx.fillStyle = '#333';
      this.ctx.textAlign = 'center';
      this.ctx.fillText(
        (this.xScale.min + (this.xScale.range * i / 5)).toFixed(1),
        x,
        this.margin.top + this.height + 20
      );
    }

    // 水平线
    for (let i = 0; i <= 5; i++) {
      const y = this.toCanvasY(this.yScale.max - (this.yScale.range * i / 5));
      this.ctx.beginPath();
      this.ctx.moveTo(this.margin.left, y);
      this.ctx.lineTo(this.margin.left + this.width, y);
      this.ctx.stroke();

      // 绘制刻度标签
      this.ctx.fillStyle = '#333';
      this.ctx.textAlign = 'right';
      this.ctx.fillText(
        (this.yScale.max - (this.yScale.range * i / 5)).toFixed(1),
        this.margin.left - 10,
        y + 5
      );
    }

    // 绘制坐标轴
    this.ctx.strokeStyle = '#333';
    this.ctx.lineWidth = 2;

    // X轴
    this.ctx.beginPath();
    this.ctx.moveTo(this.margin.left, this.margin.top + this.height);
    this.ctx.lineTo(this.margin.left + this.width, this.margin.top + this.height);
    this.ctx.stroke();

    // Y轴
    this.ctx.beginPath();
    this.ctx.moveTo(this.margin.left, this.margin.top);
    this.ctx.lineTo(this.margin.left, this.margin.top + this.height);
    this.ctx.stroke();

    this.ctx.restore();
  }

  // 创建提示框
  createTooltip() {
    this.tooltip = document.createElement('div');
    this.tooltip.className = 'bubble-chart-tooltip';
    this.tooltip.style.cssText = `
      position: absolute;
      background: rgba(0, 0, 0, 0.7);
      color: white;
      padding: 8px 12px;
      border-radius: 4px;
      font-size: 12px;
      pointer-events: none;
      z-index: 1000;
      display: none;
    `;
    document.body.appendChild(this.tooltip);
  }

  // 显示提示框
  showTooltip(x, y, content) {
    this.tooltip.style.left = x + 'px';
    this.tooltip.style.top = y + 'px';
    this.tooltip.innerHTML = content;
    this.tooltip.style.display = 'block';
  }

  // 隐藏提示框
  hideTooltip() {
    this.tooltip.style.display = 'none';
  }

  // 查找鼠标位置下的气泡
  findBubbleAtPosition(mouseX, mouseY) {
    const rect = this.canvas.getBoundingClientRect();
    const canvasX = mouseX - rect.left;
    const canvasY = mouseY - rect.top;

    // 反向循环,先检查顶层气泡
    for (let datasetIndex = this.data.length - 1; datasetIndex >= 0; datasetIndex--) {
      const dataset = this.data[datasetIndex];
      for (let pointIndex = 0; pointIndex < dataset.points.length; pointIndex++) {
        const point = dataset.points[pointIndex];
        const x = this.toCanvasX(point.x);
        const y = this.toCanvasY(point.y);
        const radius = this.calculateRadius(point.z);

        // 计算距离
        const distance = Math.sqrt(
          Math.pow(canvasX - x, 2) + Math.pow(canvasY - y, 2)
        );

        if (distance <= radius) {
          return { dataset, point, datasetIndex, pointIndex };
        }
      }
    }

    return null;
  }

  // 绑定交互事件
  bindEvents() {
    // 鼠标悬停显示提示框
    this.canvas.addEventListener('mousemove', (e) => {
      if (!this.isDragging) {
        const bubble = this.findBubbleAtPosition(e.clientX, e.clientY);

        if (bubble) {
          const content = `
            <strong>${bubble.dataset.name}</strong><br>
            ${this.xLabel}: ${bubble.point.x.toFixed(2)}<br>
            ${this.yLabel}: ${bubble.point.y.toFixed(2)}<br>
            ${this.zLabel}: ${bubble.point.z.toFixed(2)}
          `;
          this.showTooltip(e.clientX + 10, e.clientY - 10, content);
          this.canvas.style.cursor = 'pointer';
        } else {
          this.hideTooltip();
          this.canvas.style.cursor = 'default';
        }
      }
    });

    // 鼠标离开隐藏提示框
    this.canvas.addEventListener('mouseleave', () => {
      this.hideTooltip();
      this.canvas.style.cursor = 'default';
    });

    // 鼠标滚轮缩放
    this.canvas.addEventListener('wheel', (e) => {
      e.preventDefault();
      const rect = this.canvas.getBoundingClientRect();
      const mouseX = e.clientX - rect.left;
      const mouseY = e.clientY - rect.top;

      // 根据滚轮方向调整缩放因子
      const scaleFactor = e.deltaY > 0 ? 0.9 : 1.1;
      this.zoom *= scaleFactor;

      // 调整平移以保持鼠标位置不变
      this.pan.x = mouseX - (mouseX - this.pan.x) * scaleFactor;
      this.pan.y = mouseY - (mouseY - this.pan.y) * scaleFactor;

      this.render();
    });

    // 鼠标拖拽平移
    this.canvas.addEventListener('mousedown', (e) => {
      this.isDragging = true;
      const rect = this.canvas.getBoundingClientRect();
      this.lastMousePos = {
        x: e.clientX - rect.left,
        y: e.clientY - rect.top
      };
      this.hideTooltip();
    });

    this.canvas.addEventListener('mousemove', (e) => {
      if (this.isDragging) {
        const rect = this.canvas.getBoundingClientRect();
        const currentMousePos = {
          x: e.clientX - rect.left,
          y: e.clientY - rect.top
        };

        // 计算拖拽距离
        this.pan.x += currentMousePos.x - this.lastMousePos.x;
        this.pan.y += currentMousePos.y - this.lastMousePos.y;

        this.lastMousePos = currentMousePos;
        this.render();
      }
    });

    this.canvas.addEventListener('mouseup', () => {
      this.isDragging = false;
    });

    this.canvas.addEventListener('mouseleave', () => {
      this.isDragging = false;
    });
  }

  // 其他方法:绘制标题、坐标轴标签、图例等
}

// 应用初始化
window.addEventListener('DOMContentLoaded', () => {
  // 生成示例数据
  const generateRandomBubble = () => ({
    x: Math.random() * 100,
    y: Math.random() * 100,
    z: Math.random() * 100 + 10 // 确保气泡大小不为零
  });

  const dataset1 = {
    name: '数据集A',
    points: Array.from({ length: 30 }, generateRandomBubble)
  };

  const dataset2 = {
    name: '数据集B',
    points: Array.from({ length: 30 }, () => {
      const x = Math.random() * 100;
      const y = x * 0.7 + Math.random() * 20; // 添加一些相关性
      return {
        x: x,
        y: y,
        z: Math.sqrt(x * y) + Math.random() * 20 // 气泡大小基于X和Y的乘积
      };
    })
  };

  // 创建气泡图实例
  const bubbleChart = new BubbleChart('bubbleChart', {
    data: [dataset1, dataset2],
    title: '多维度数据分布气泡图',
    xLabel: 'X值',
    yLabel: 'Y值',
    zLabel: '气泡大小',
    minRadius: 5,
    maxRadius: 30
  });

  // 绑定控制事件
  document.getElementById('resetViewButton').addEventListener('click', () => {
    bubbleChart.zoom = 1;
    bubbleChart.pan = { x: 0, y: 0 };
    bubbleChart.render();
  });
});
如何运行
- 克隆本项目
- 安装依赖:
npm install - 启动应用:
npm start
鸿蒙PC适配改造指南
1. 环境准备
-
系统要求:Windows 10/11、8GB RAM以上、20GB可用空间
-
工具安装 :
DevEco Studio 5.0+(安装鸿蒙SDK API 20+)
-
Node.js 18.x+
2. 获取Electron鸿蒙编译产物
-
下载Electron 34+版本的Release包(.zip格式)
-
解压到项目目录,确认
electron/libs/arm64-v8a/下包含核心.so库
3. 部署应用代码
将Electron应用代码按以下目录结构放置:
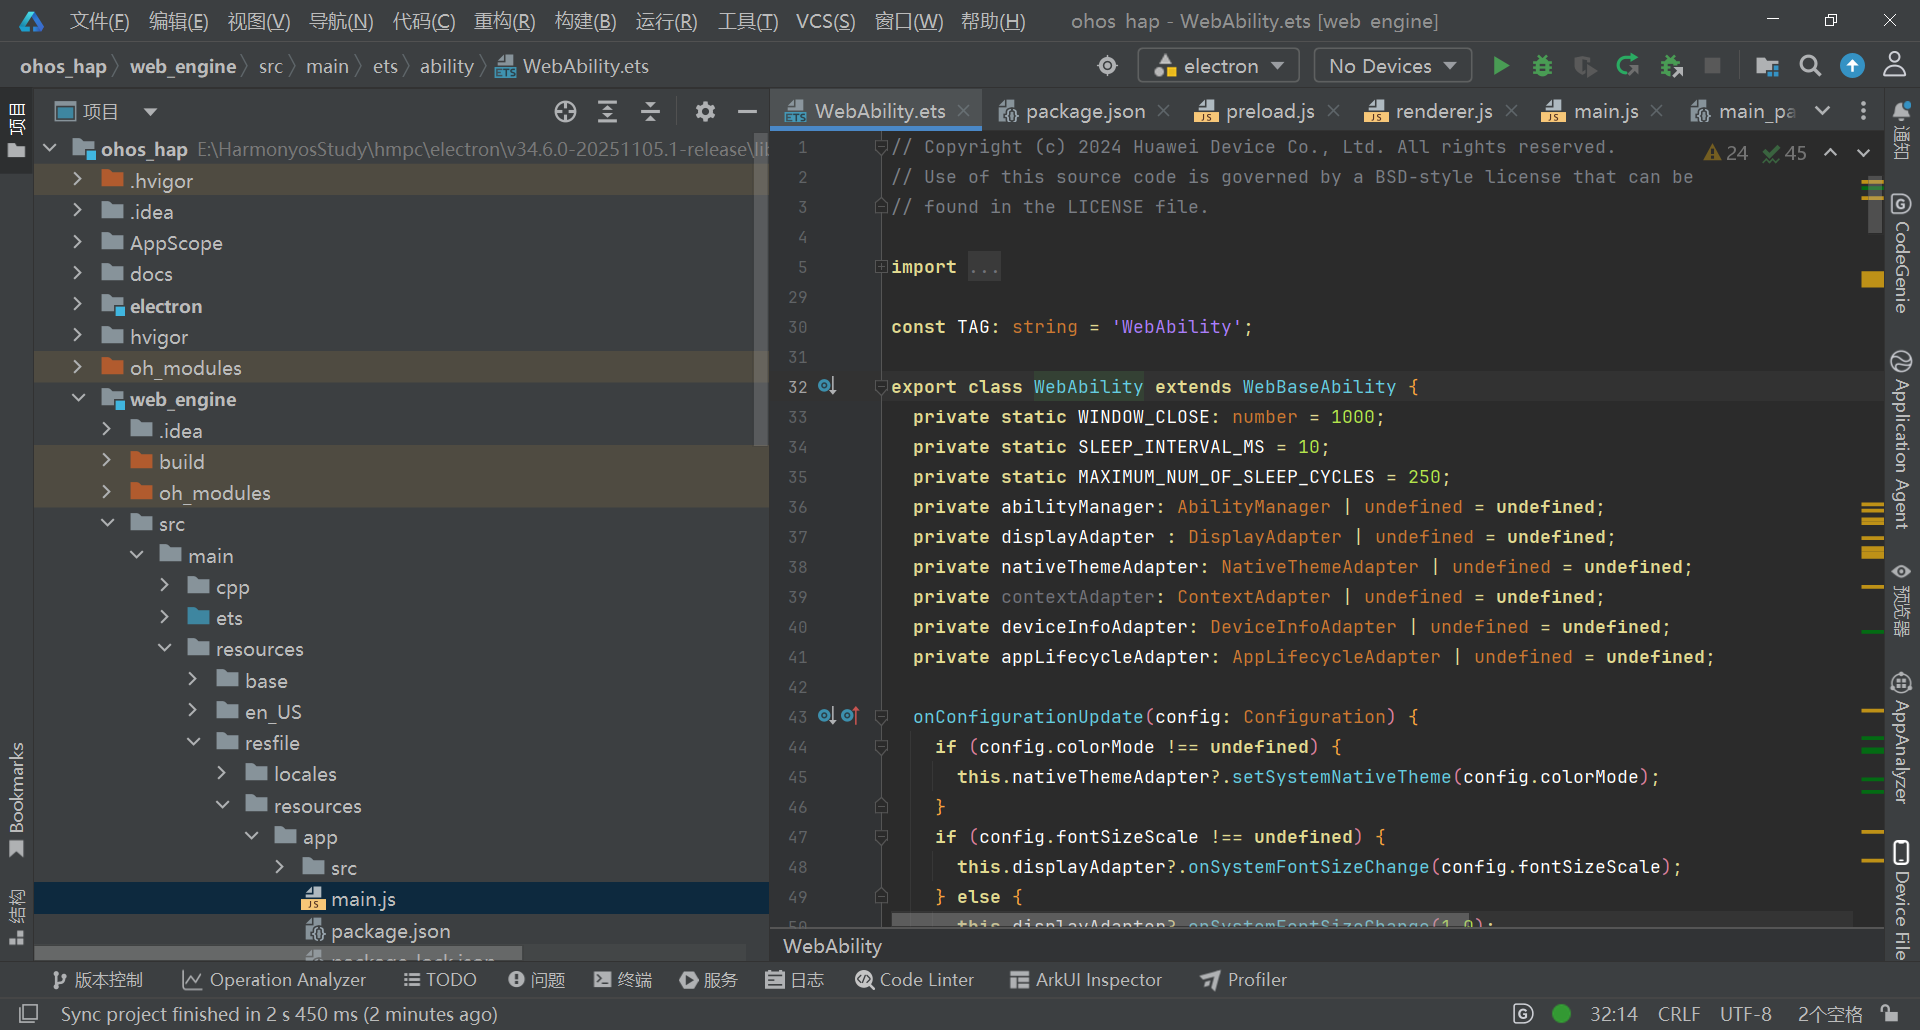
plaintext
web_engine/src/main/resources/resfile/resources/app/
├── main.js
├── package.json
└── src/
    ├── index.html
    ├── preload.js
    ├── renderer.js
    └── style.css
4. 配置与运行
-
打开项目:在DevEco Studio中打开ohos_hap目录
-
配置签名 :
进入File → Project Structure → Signing Configs
-
自动生成调试签名或导入已有签名
-
连接设备 :
启用鸿蒙设备开发者模式和USB调试
-
通过USB Type-C连接电脑
-
编译运行:点击Run按钮或按Shift+F10
5. 验证检查项
-
✅ 应用窗口正常显示
-
✅ 窗口大小可调整,响应式布局生效
-
✅ 控制台无"SysCap不匹配"或"找不到.so文件"错误
-
✅ 动画效果正常播放
跨平台兼容性
| 平台 | 适配策略 | 特殊处理 |
|---|---|---|
| Windows | 标准Electron运行 | 无特殊配置 |
| macOS | 标准Electron运行 | 保留dock图标激活逻辑 |
| Linux | 标准Electron运行 | 确保系统依赖库完整 |
| 鸿蒙PC | 通过Electron鸿蒙适配层 | 禁用硬件加速,使用特定目录结构 |
鸿蒙开发调试技巧
1. 日志查看
在DevEco Studio的Log面板中过滤"Electron"关键词,查看应用运行日志和错误信息。
2. 常见问题解决
-
"SysCap不匹配"错误:检查module.json5中的reqSysCapabilities,只保留必要系统能力
-
"找不到.so文件"错误:确认arm64-v8a目录下四个核心库文件完整
-
窗口不显示:在main.js中添加app.disableHardwareAcceleration()
-
动画卡顿:简化CSS动画效果,减少重绘频率