QCustomPlot绘制曲线
- 1、前言
- [2、下载 QCustomPlot 库](#2、下载 QCustomPlot 库)
- 3、在项目中使用QCustomPlot库
-
- [3.1 把 QCustomPlot 加入你的 .pro 文件](#3.1 把 QCustomPlot 加入你的 .pro 文件)
- [3.2 UI 里放一个 Widget 并提升为 QCustomPlot](#3.2 UI 里放一个 Widget 并提升为 QCustomPlot)
- [3.3 初始化 QCustomPlot](#3.3 初始化 QCustomPlot)
- 4、项目文件
-
- [4.1 .pro文件](#4.1 .pro文件)
- [4.2 .h文件](#4.2 .h文件)
- [4.3 .cpp文件](#4.3 .cpp文件)
- 5、总结
1、前言
|------------------------------------------------|
| 记录一下QCustomPlot绘制曲线的实现方法,方便自己回顾,也可以给有需要的人提供帮助。 |
2、下载 QCustomPlot 库
|---------------------|
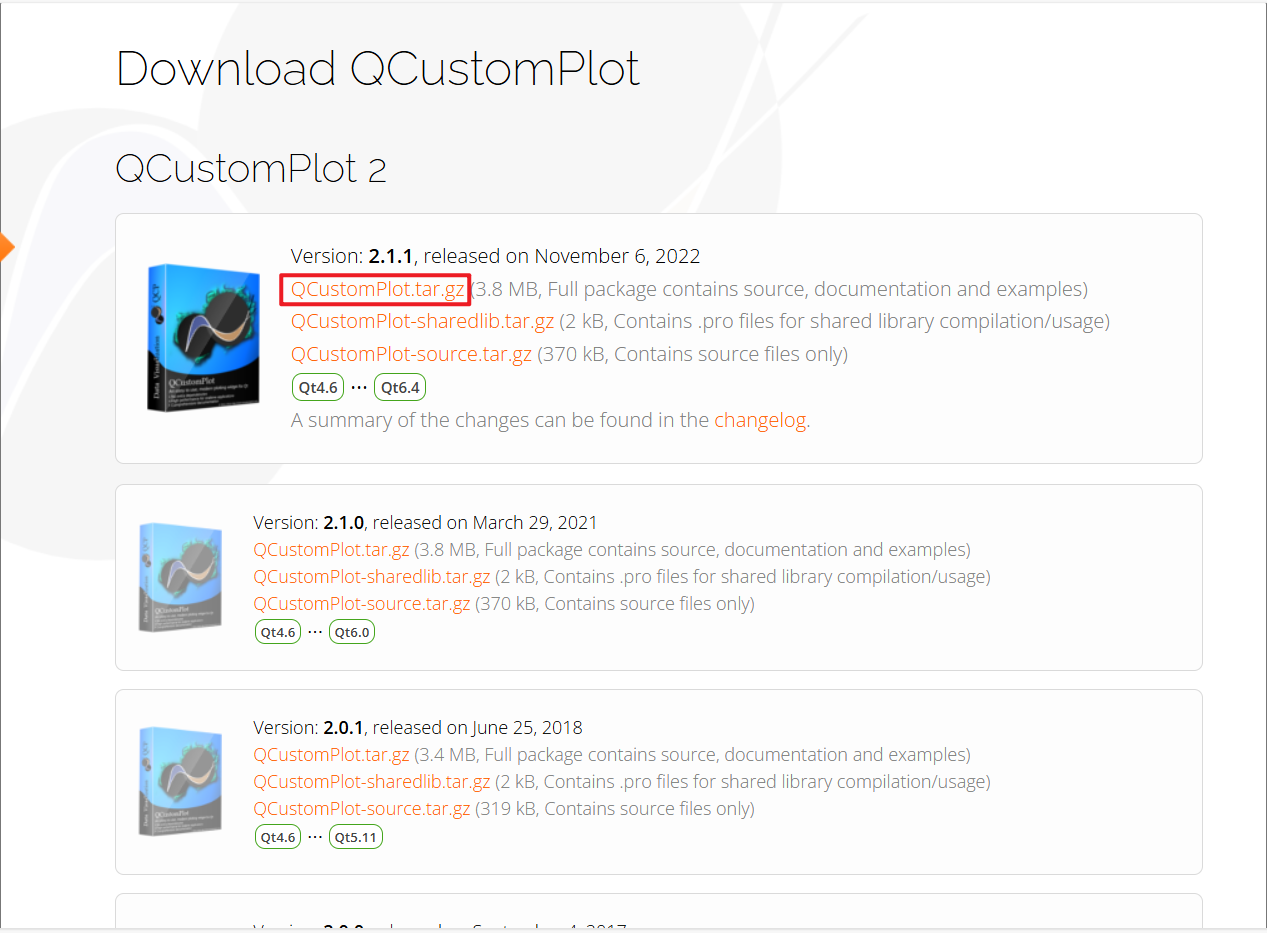
| 先从官网下载QCustomPlot 库 |
|------------|
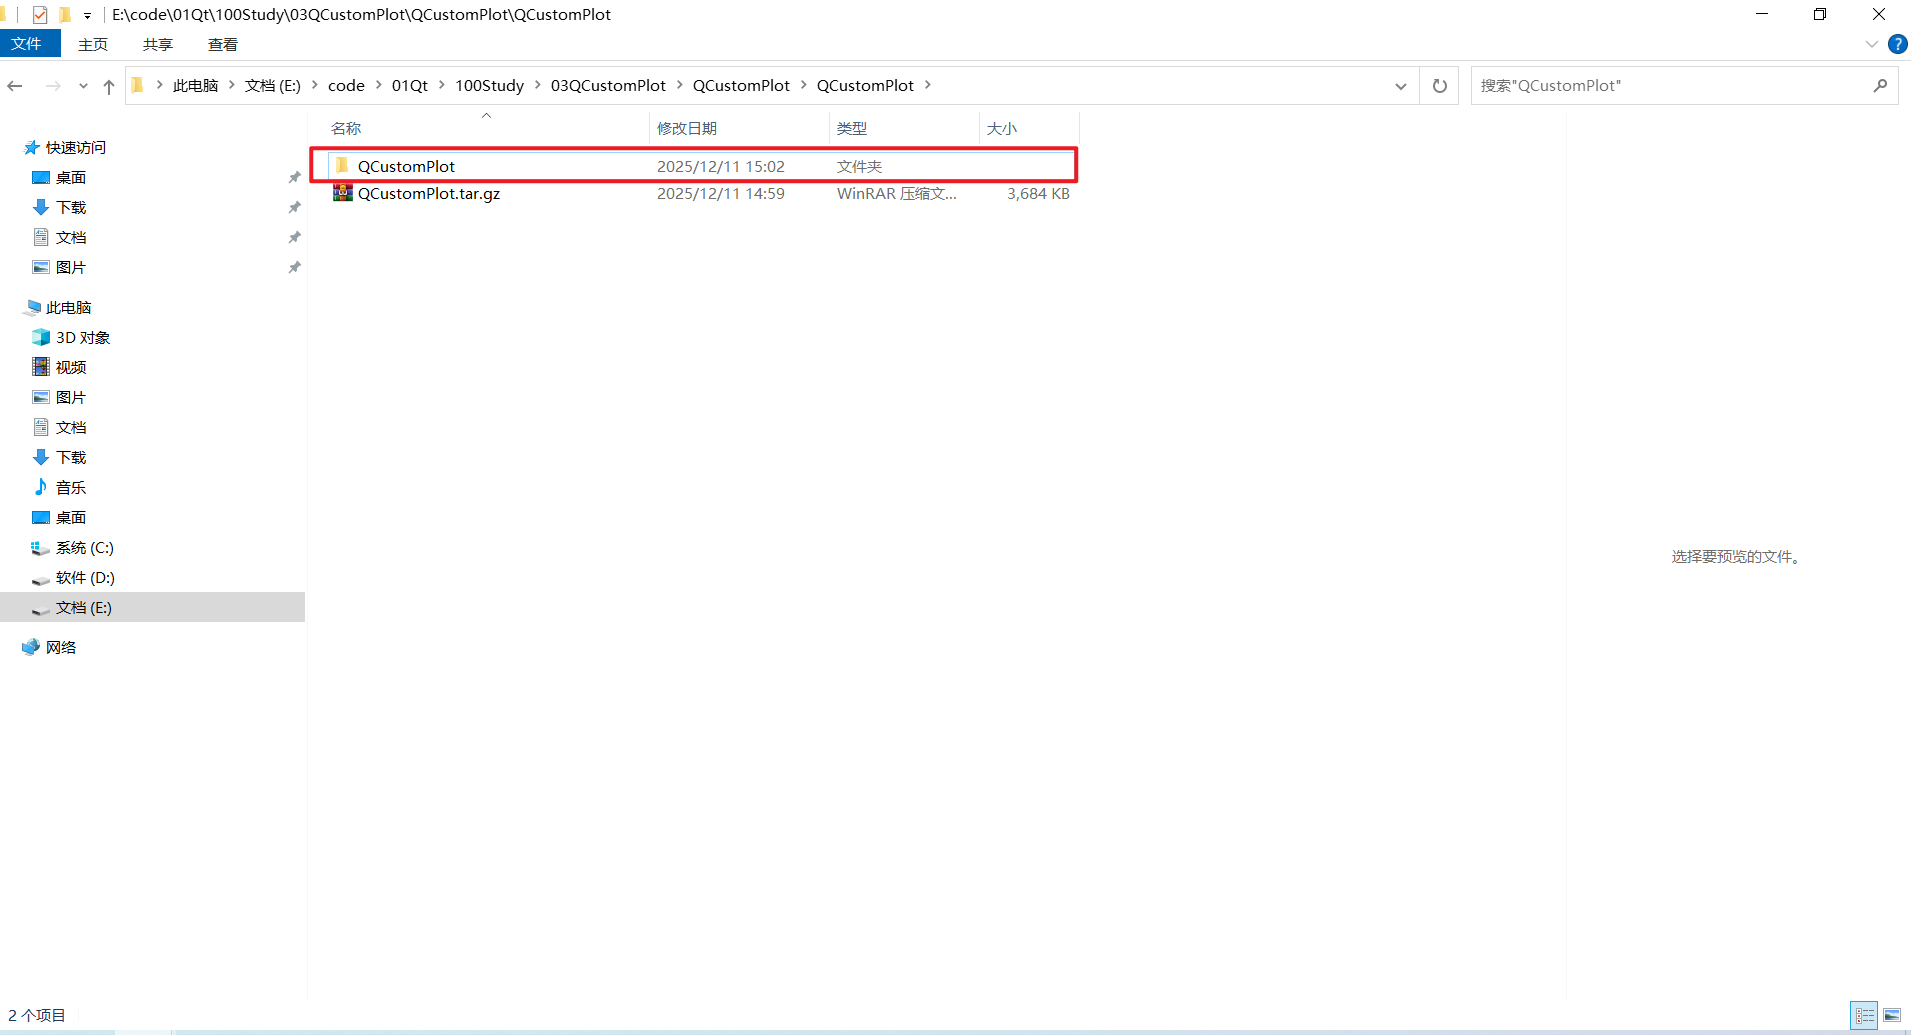
| 把下载好的压缩包解压 |
|-------------------|
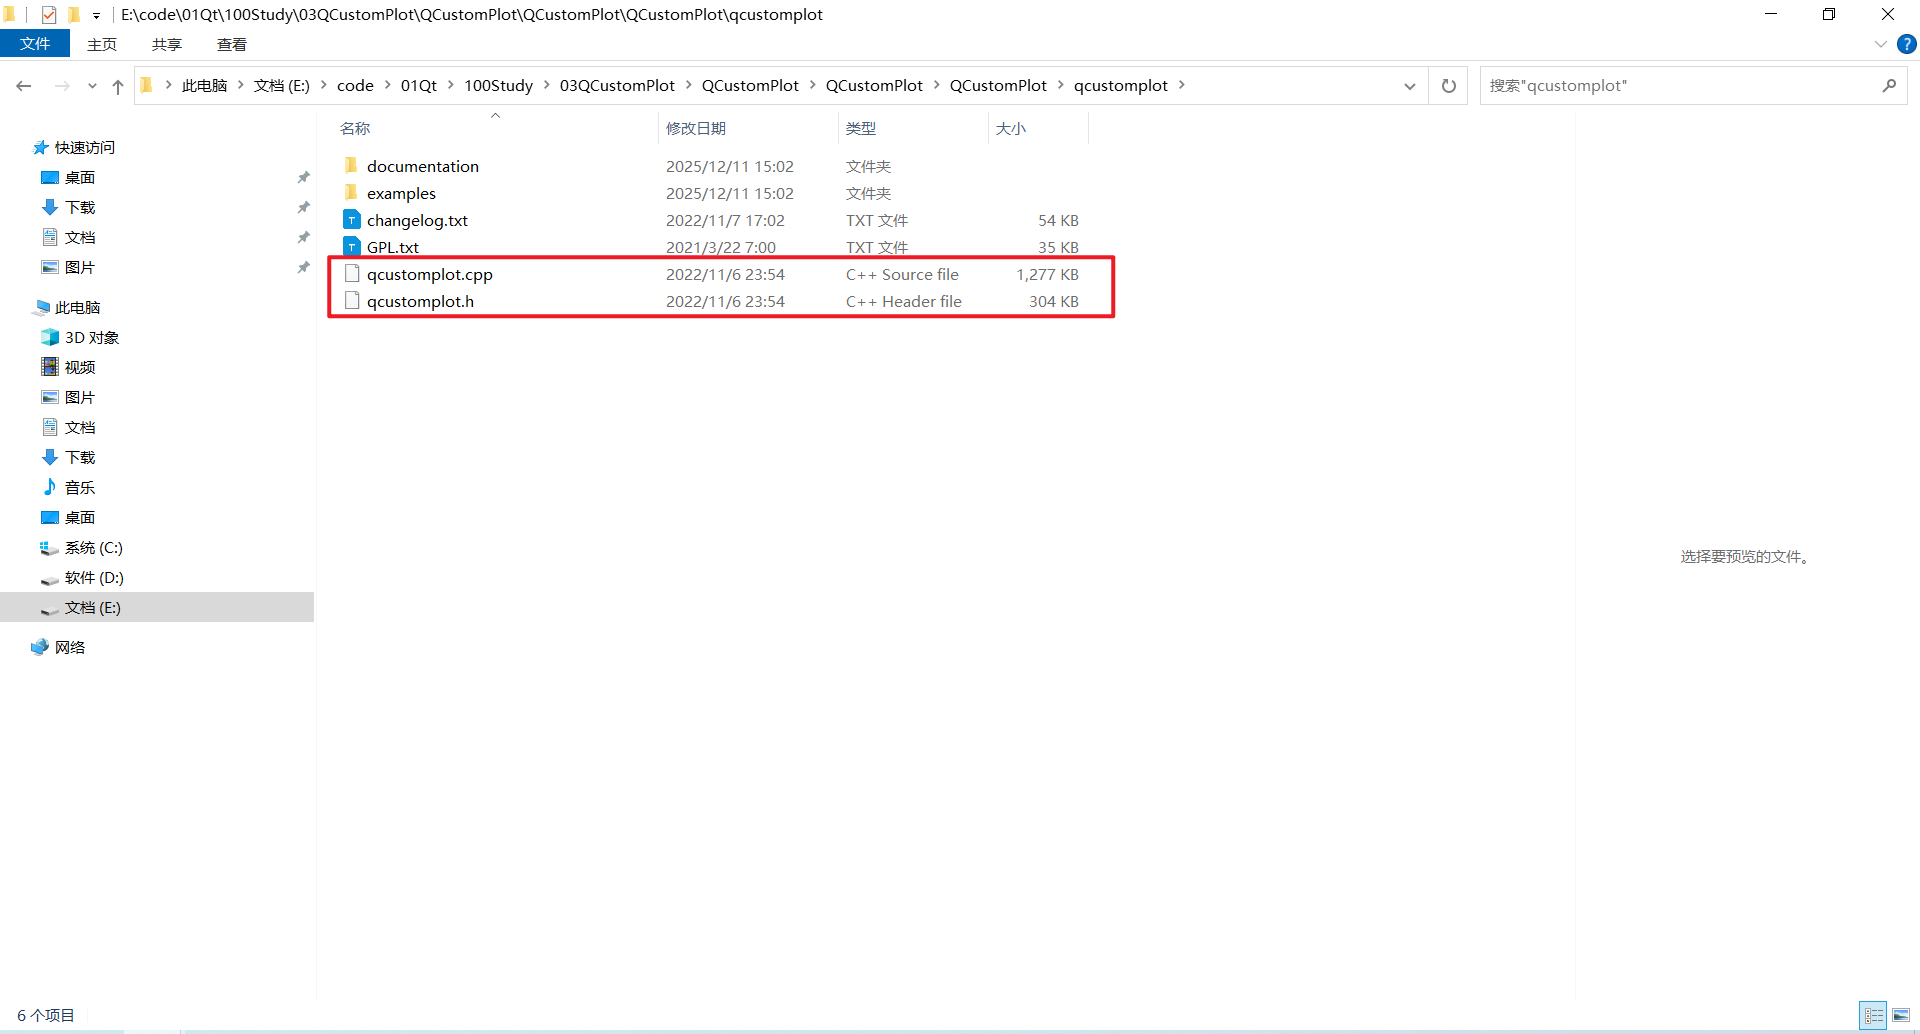
| 进入解压后的压缩包,找到这两个文件 |
|--------------------|
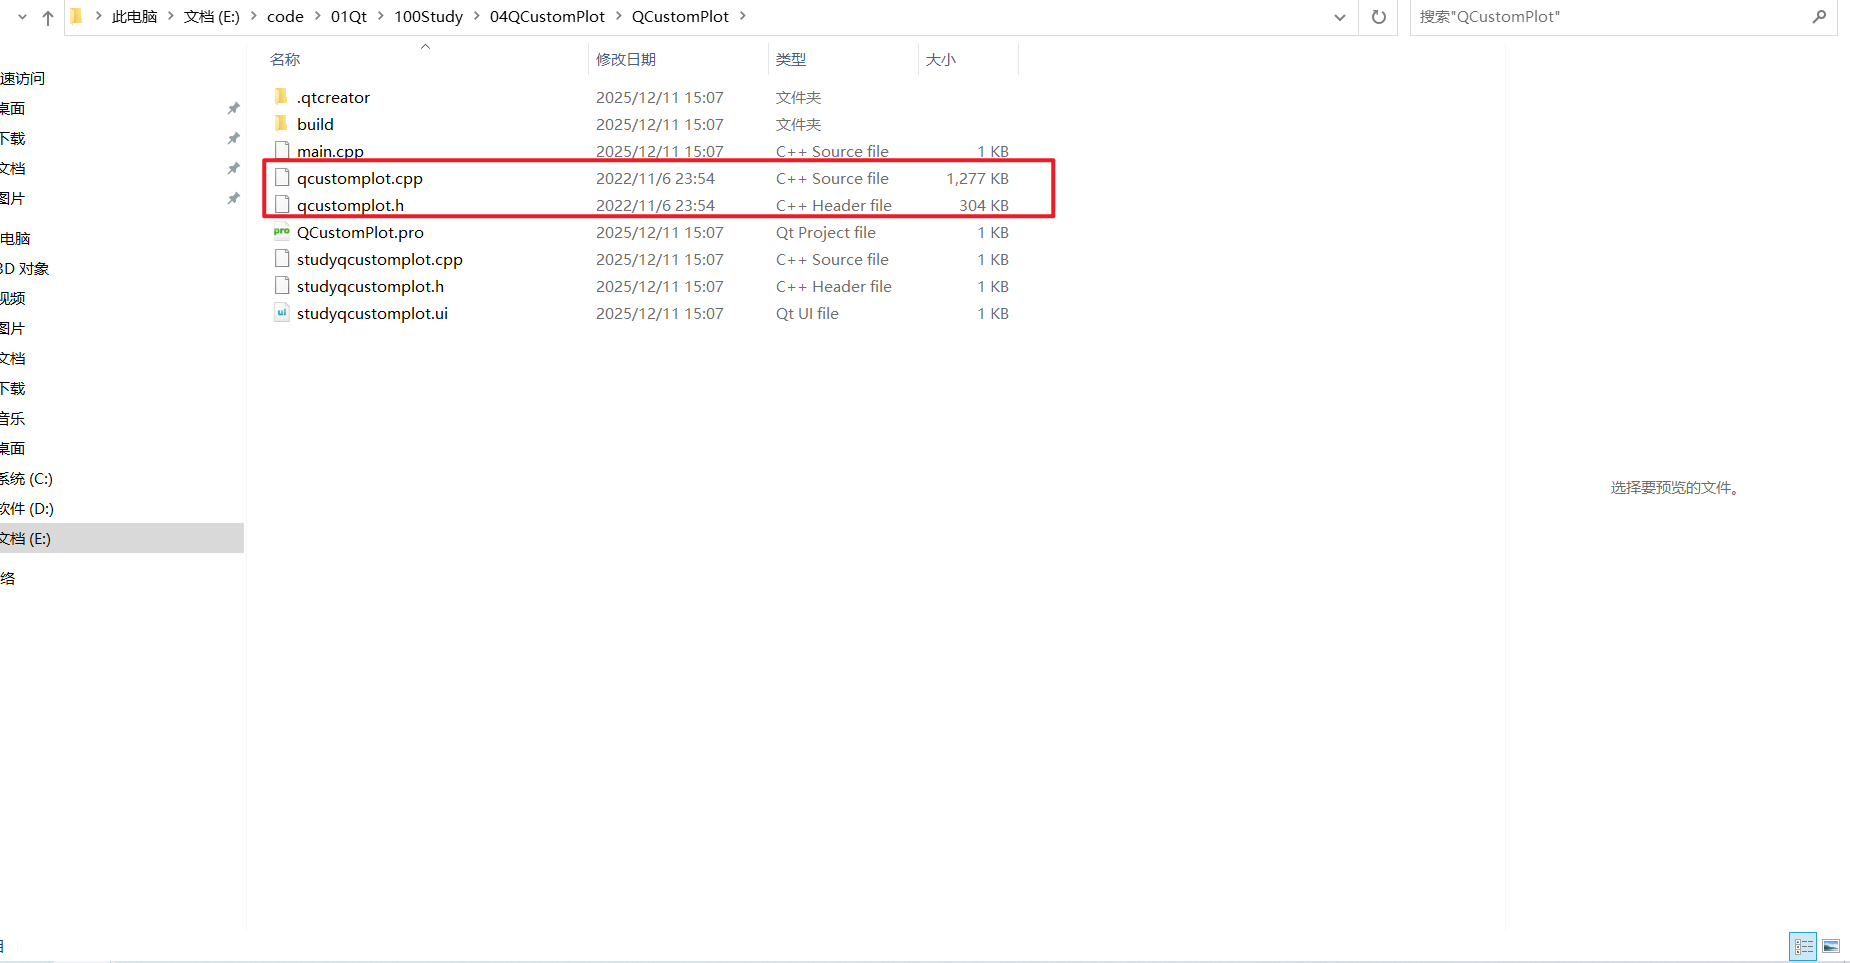
| 把这两个文件复制粘贴到项目同级目录下 |
3、在项目中使用QCustomPlot库
3.1 把 QCustomPlot 加入你的 .pro 文件
|----------------------|
| 把PrintSupport 模块添加进来 |
cpp
QT += core gui printsupport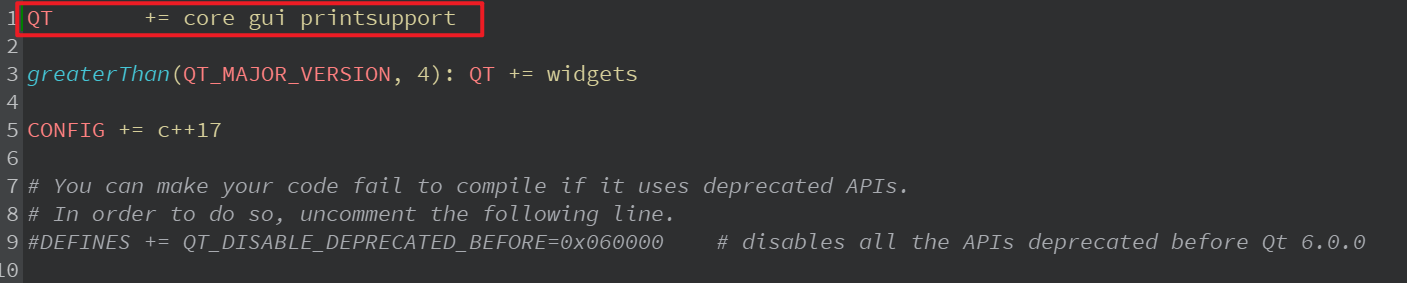
|-------------------------|
| 把前面那两个文件添加到,pro文件中,然后构建 |
cpp
SOURCES += \
    main.cpp \
    studyqcustomplot.cpp \
    qcustomplot.cpp

HEADERS += \
    studyqcustomplot.h \
    qcustomplot.h

FORMS += \
    studyqcustomplot.ui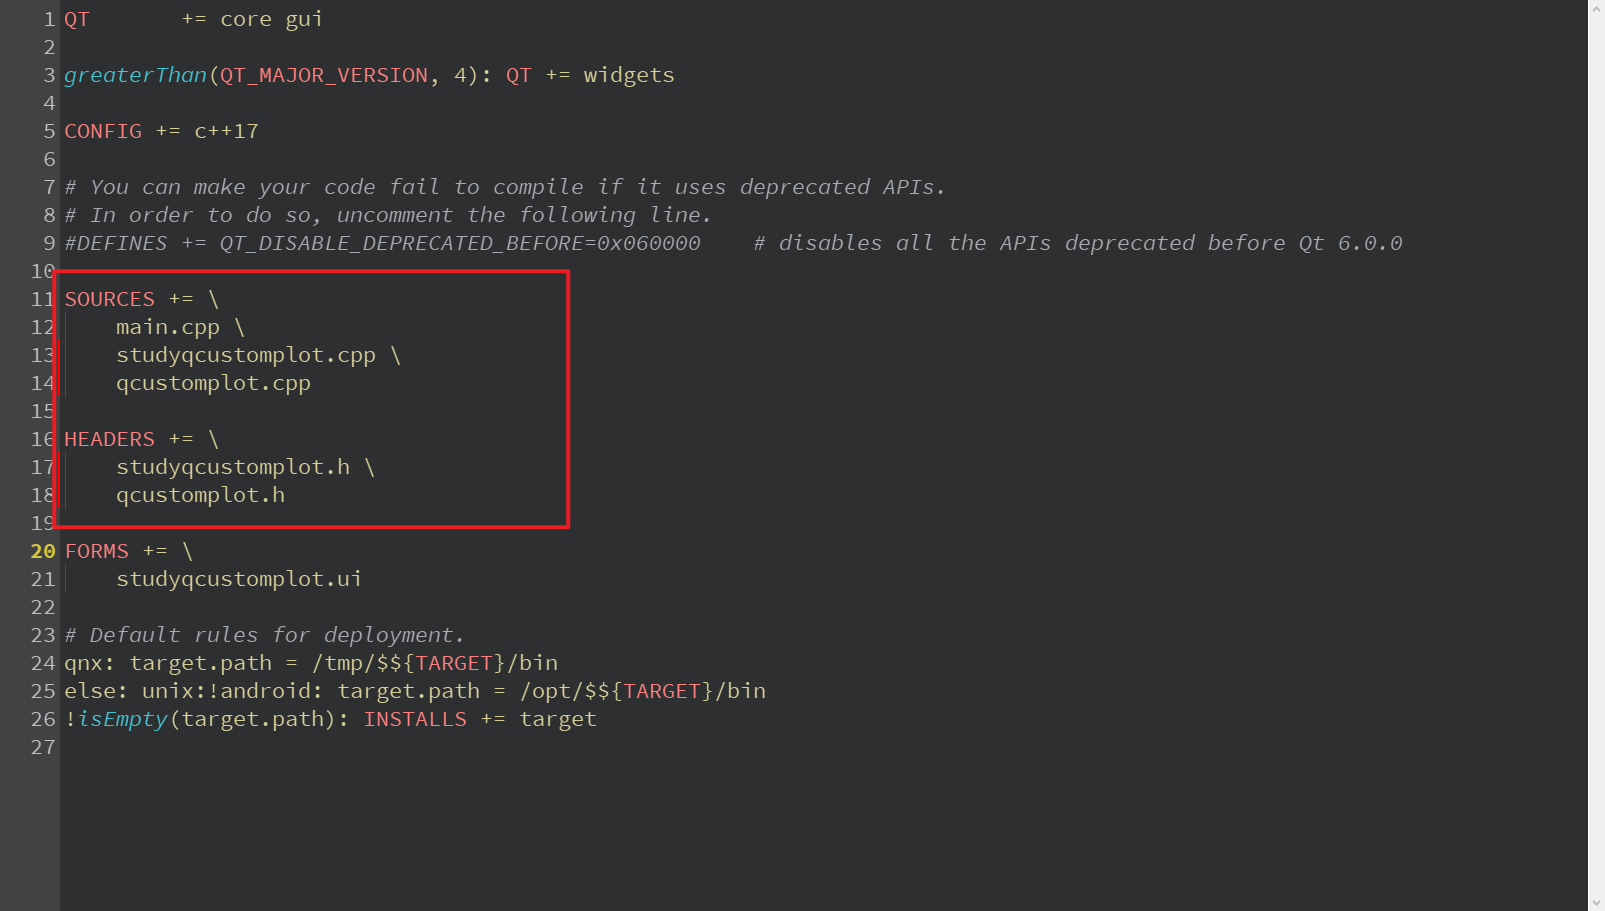
3.2 UI 里放一个 Widget 并提升为 QCustomPlot
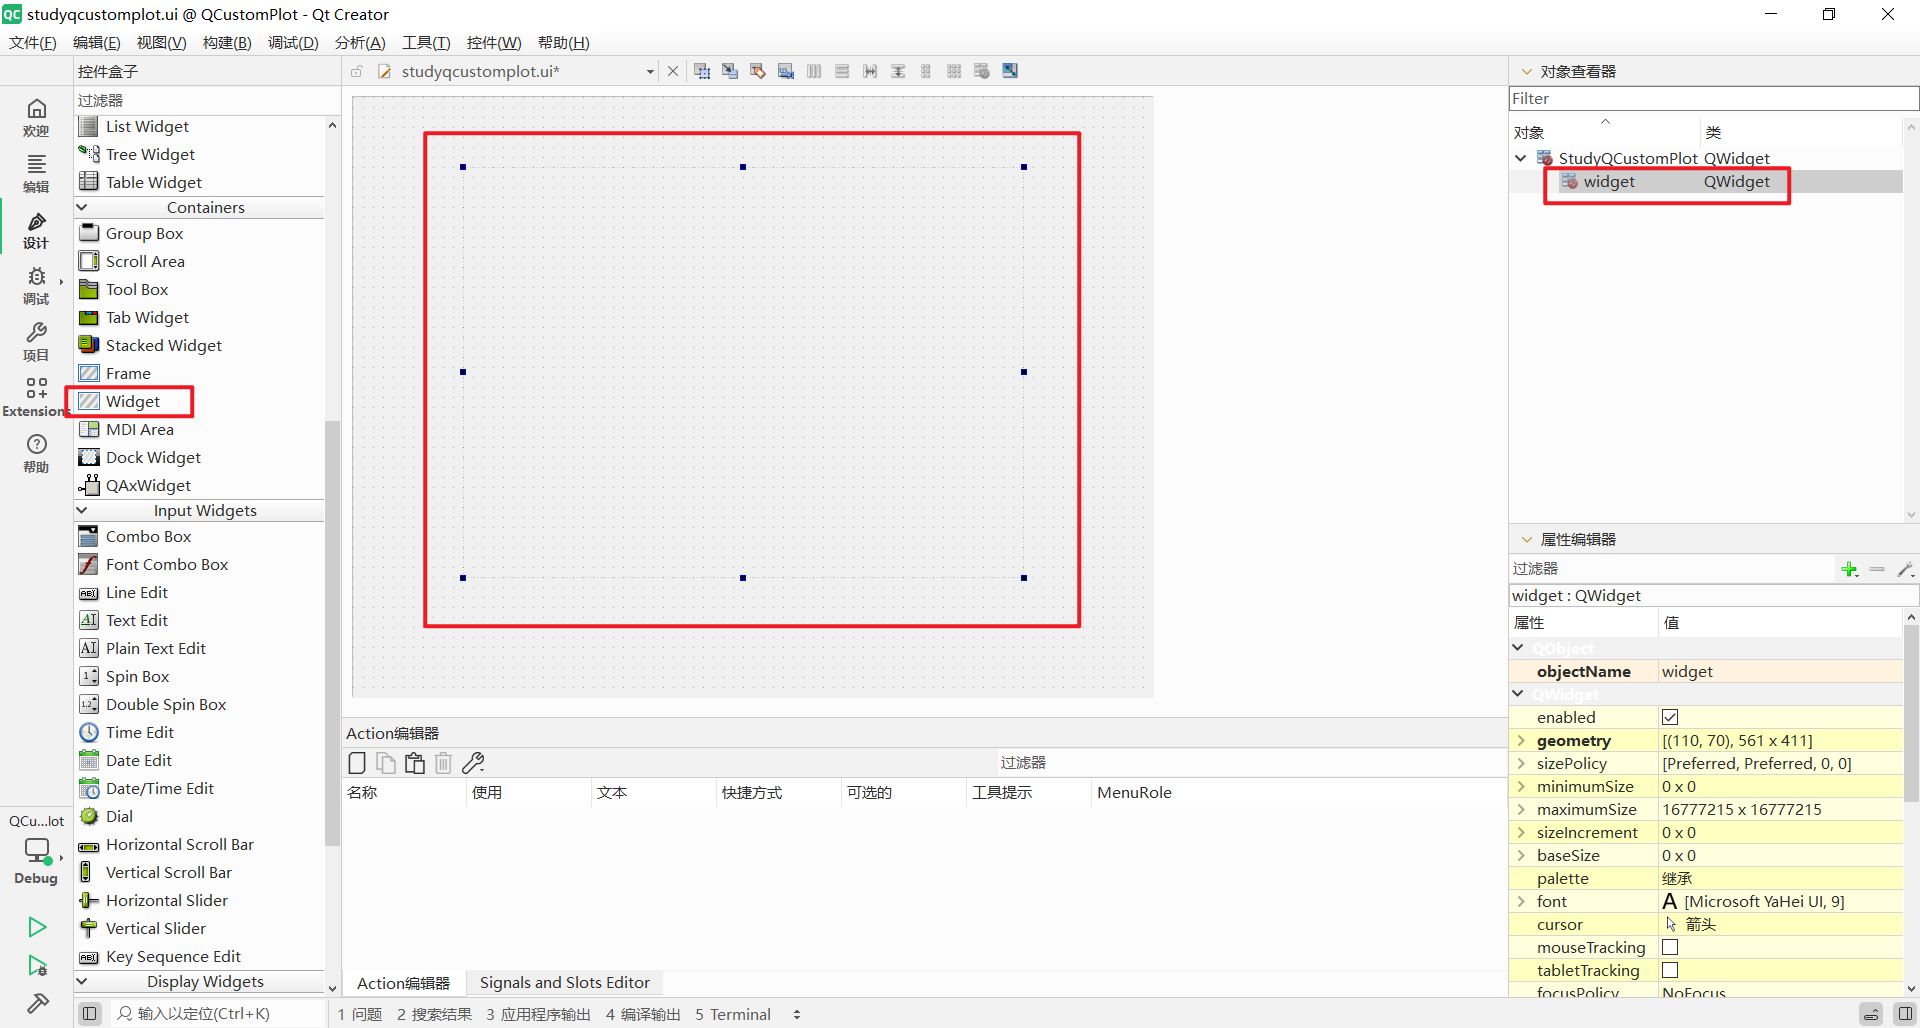
|------------------------------|
| 在Qt Designer(UI)中添加一个QWidget |
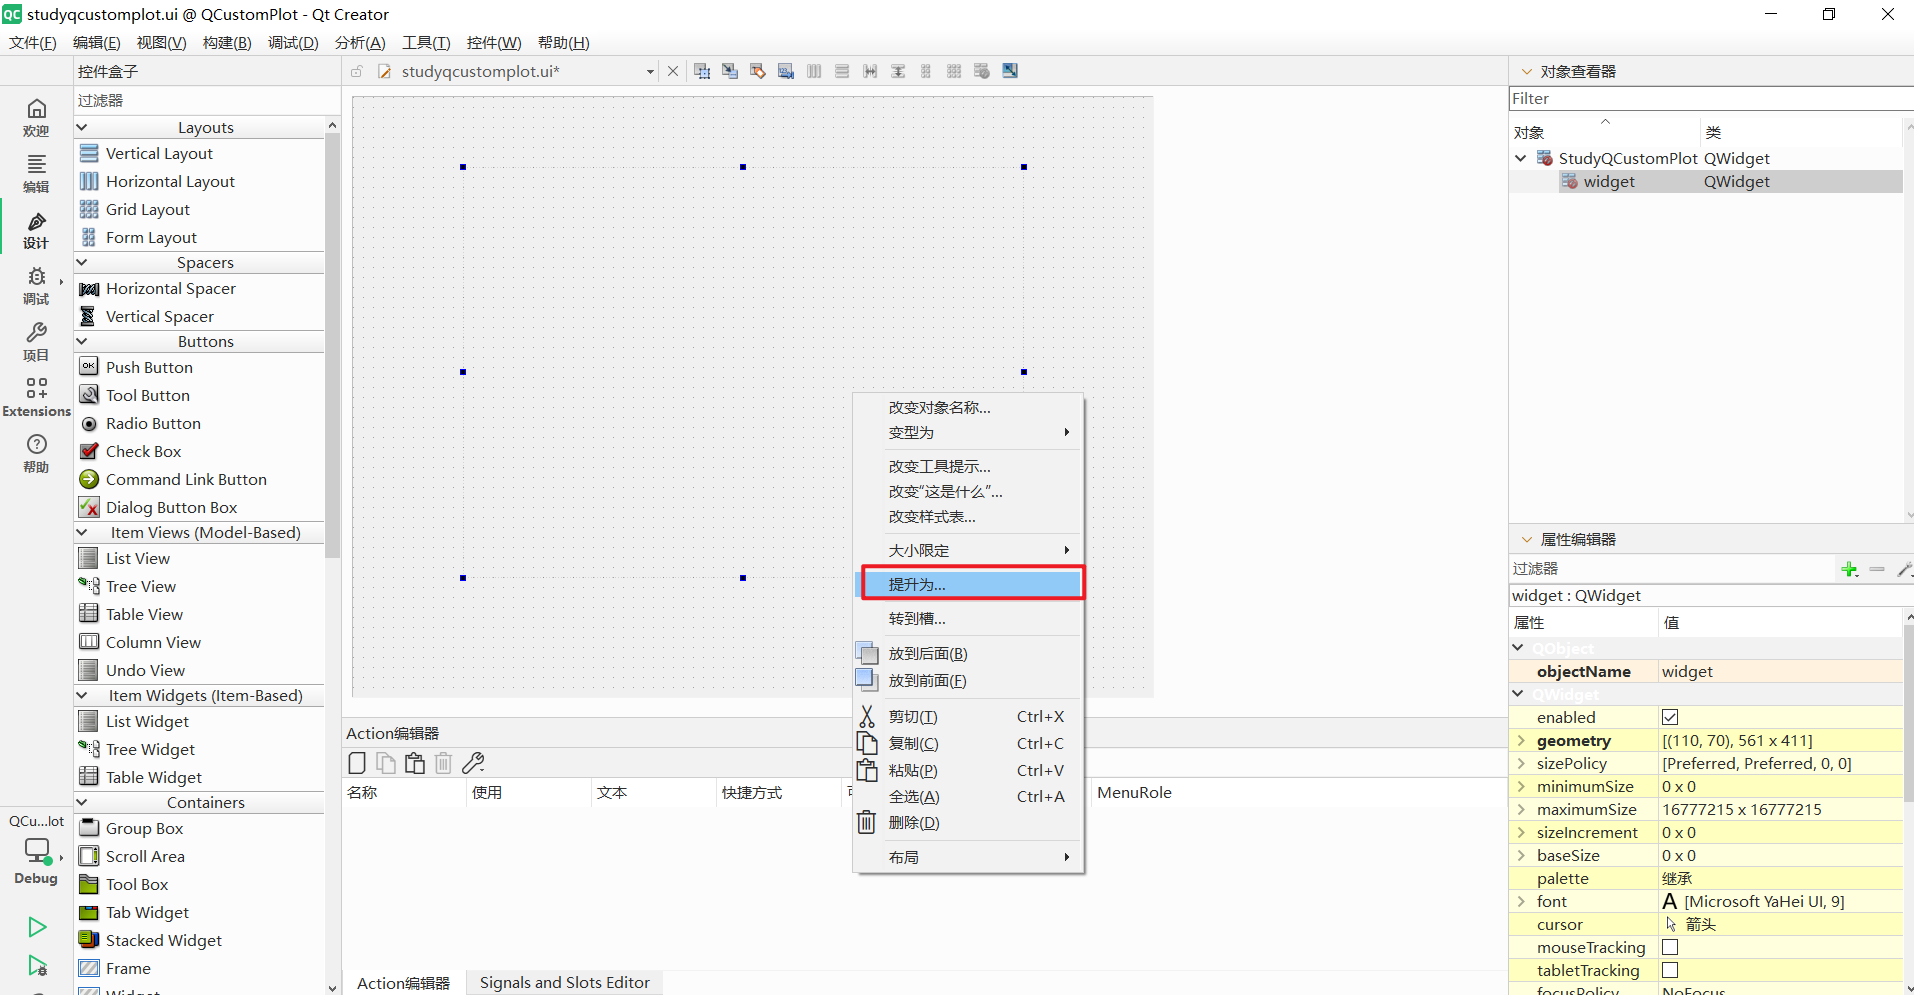
|-------------------|
| 右键这个QWidget,点击提升为 |
|----------------------|
| 输入QCustomPlot,接着点击添加 |
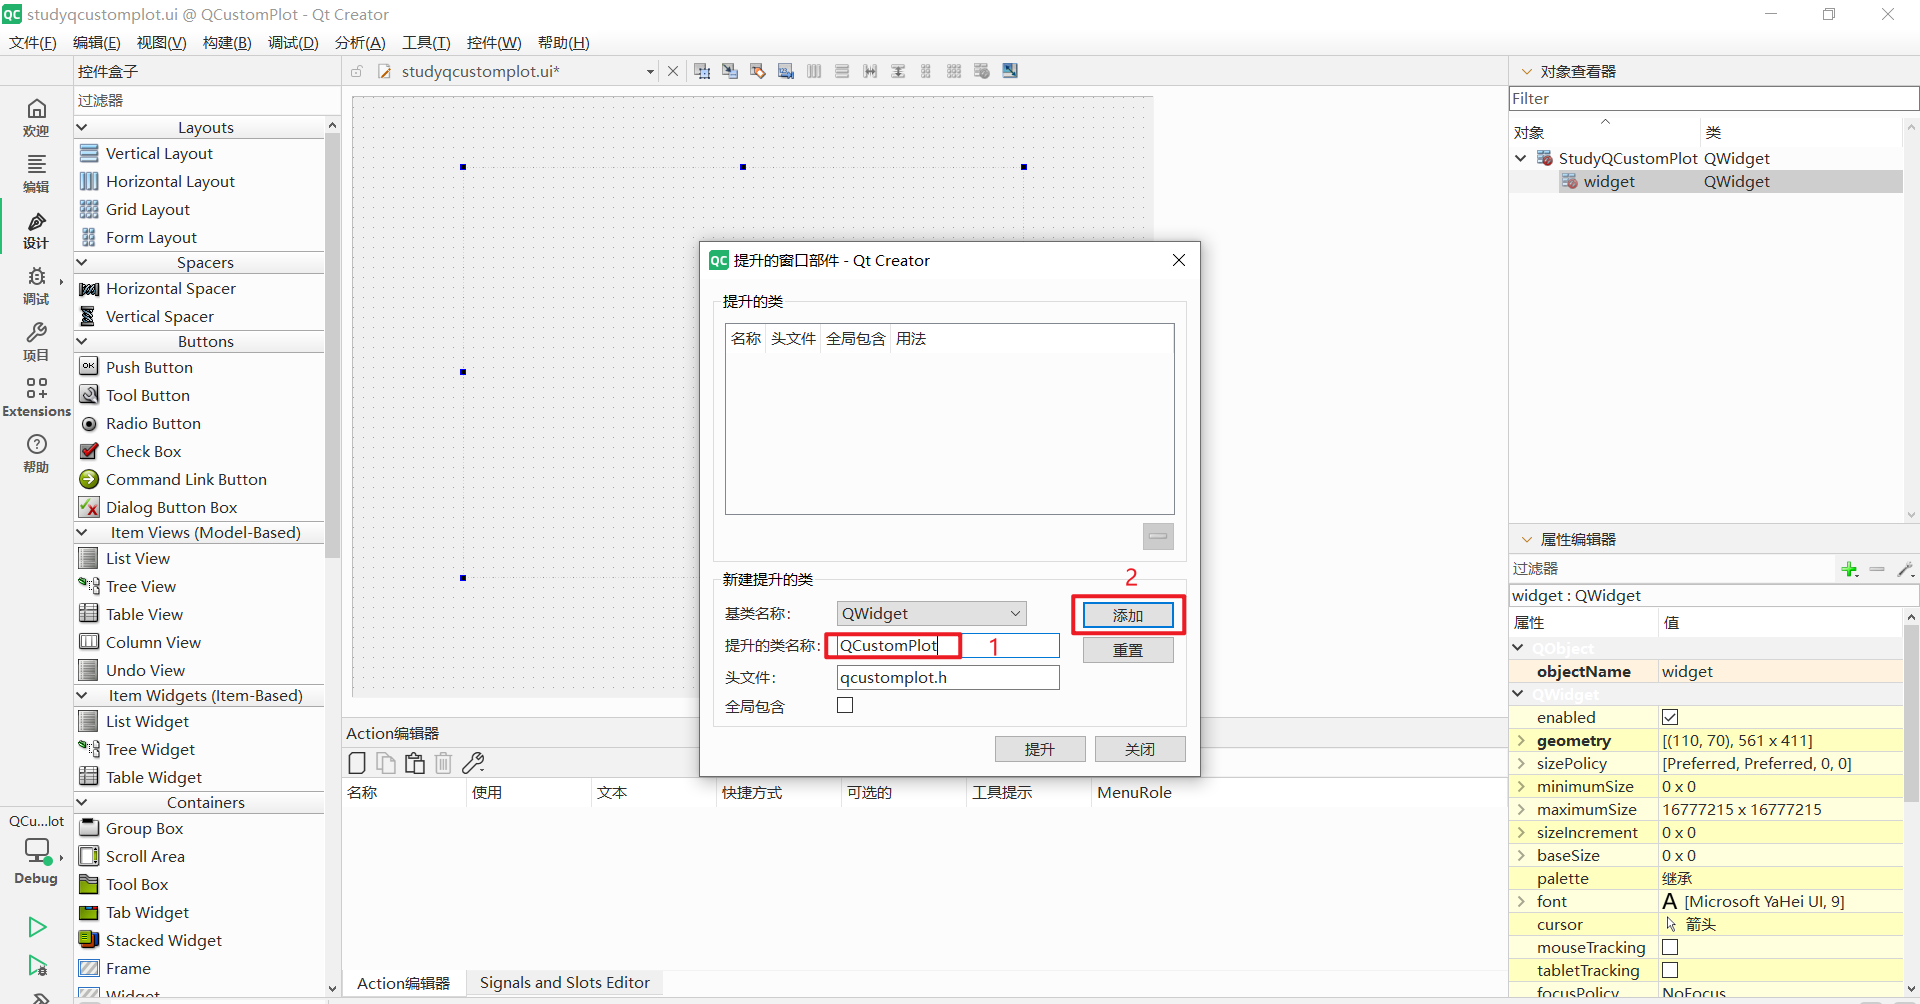
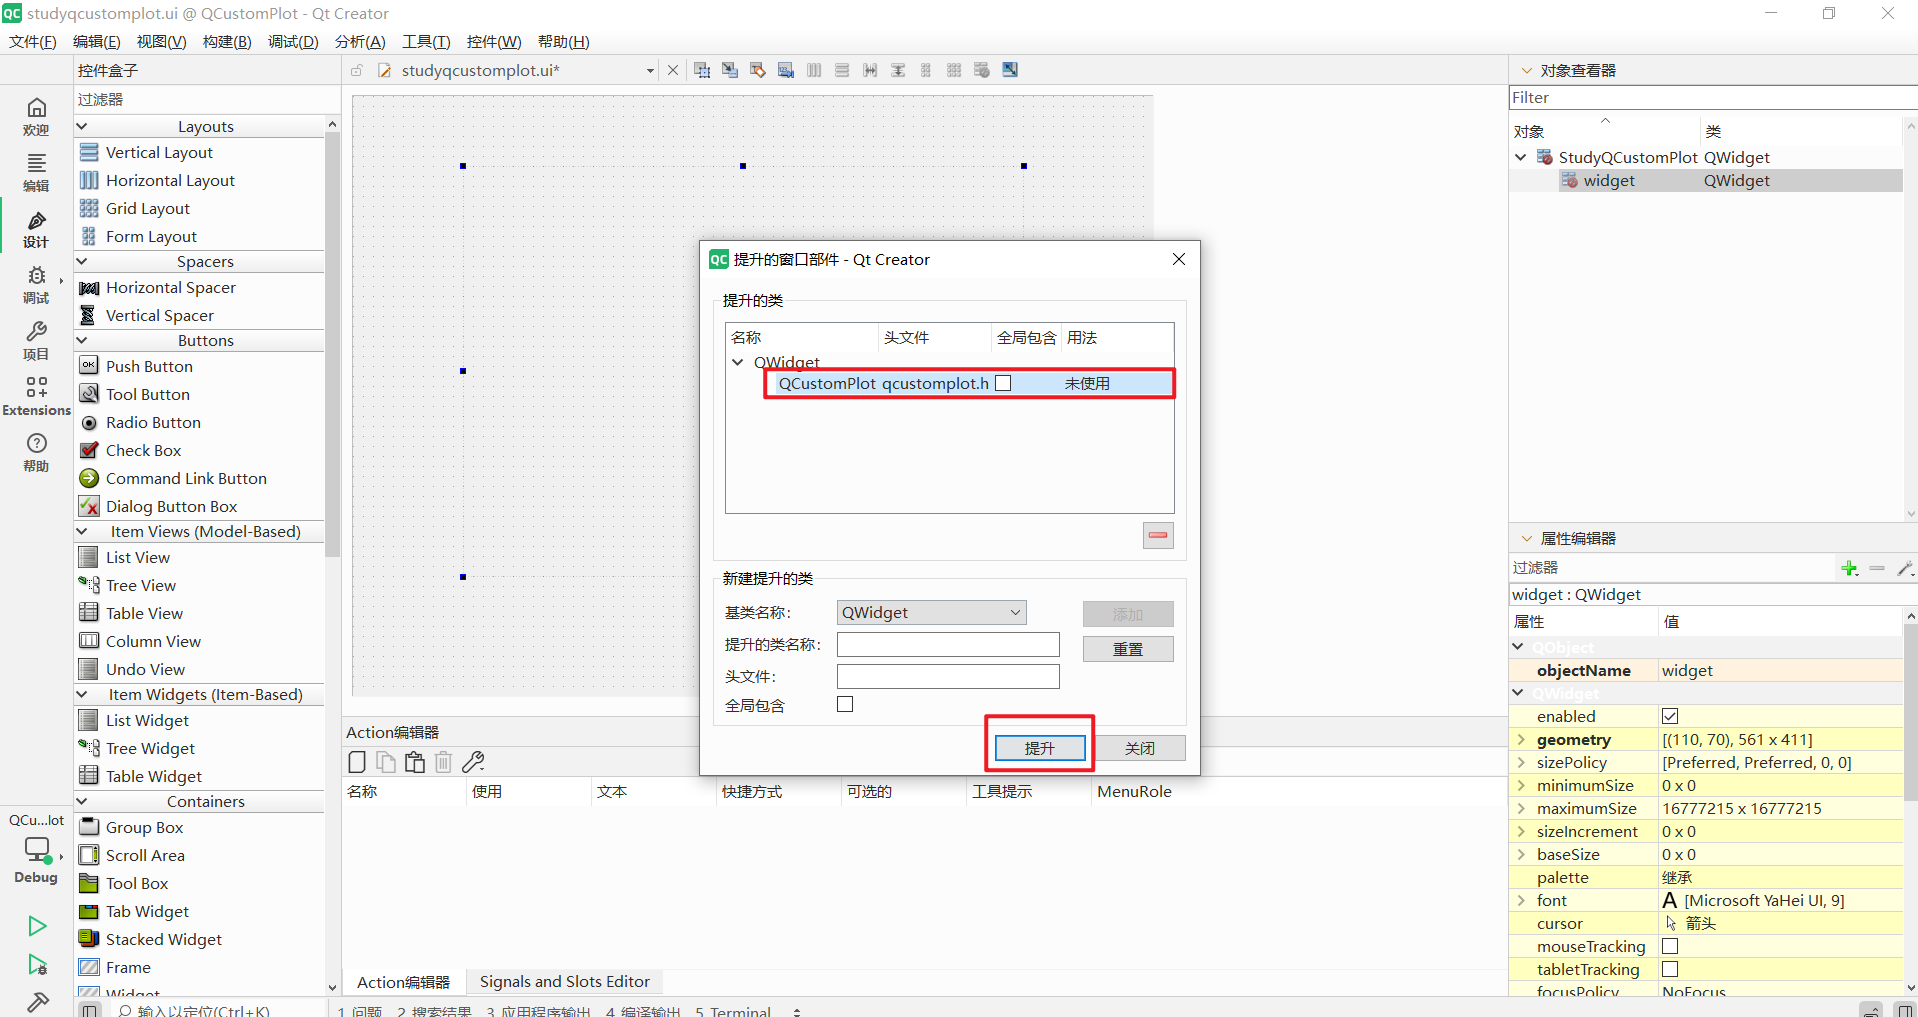
|------|
| 点击提升 |
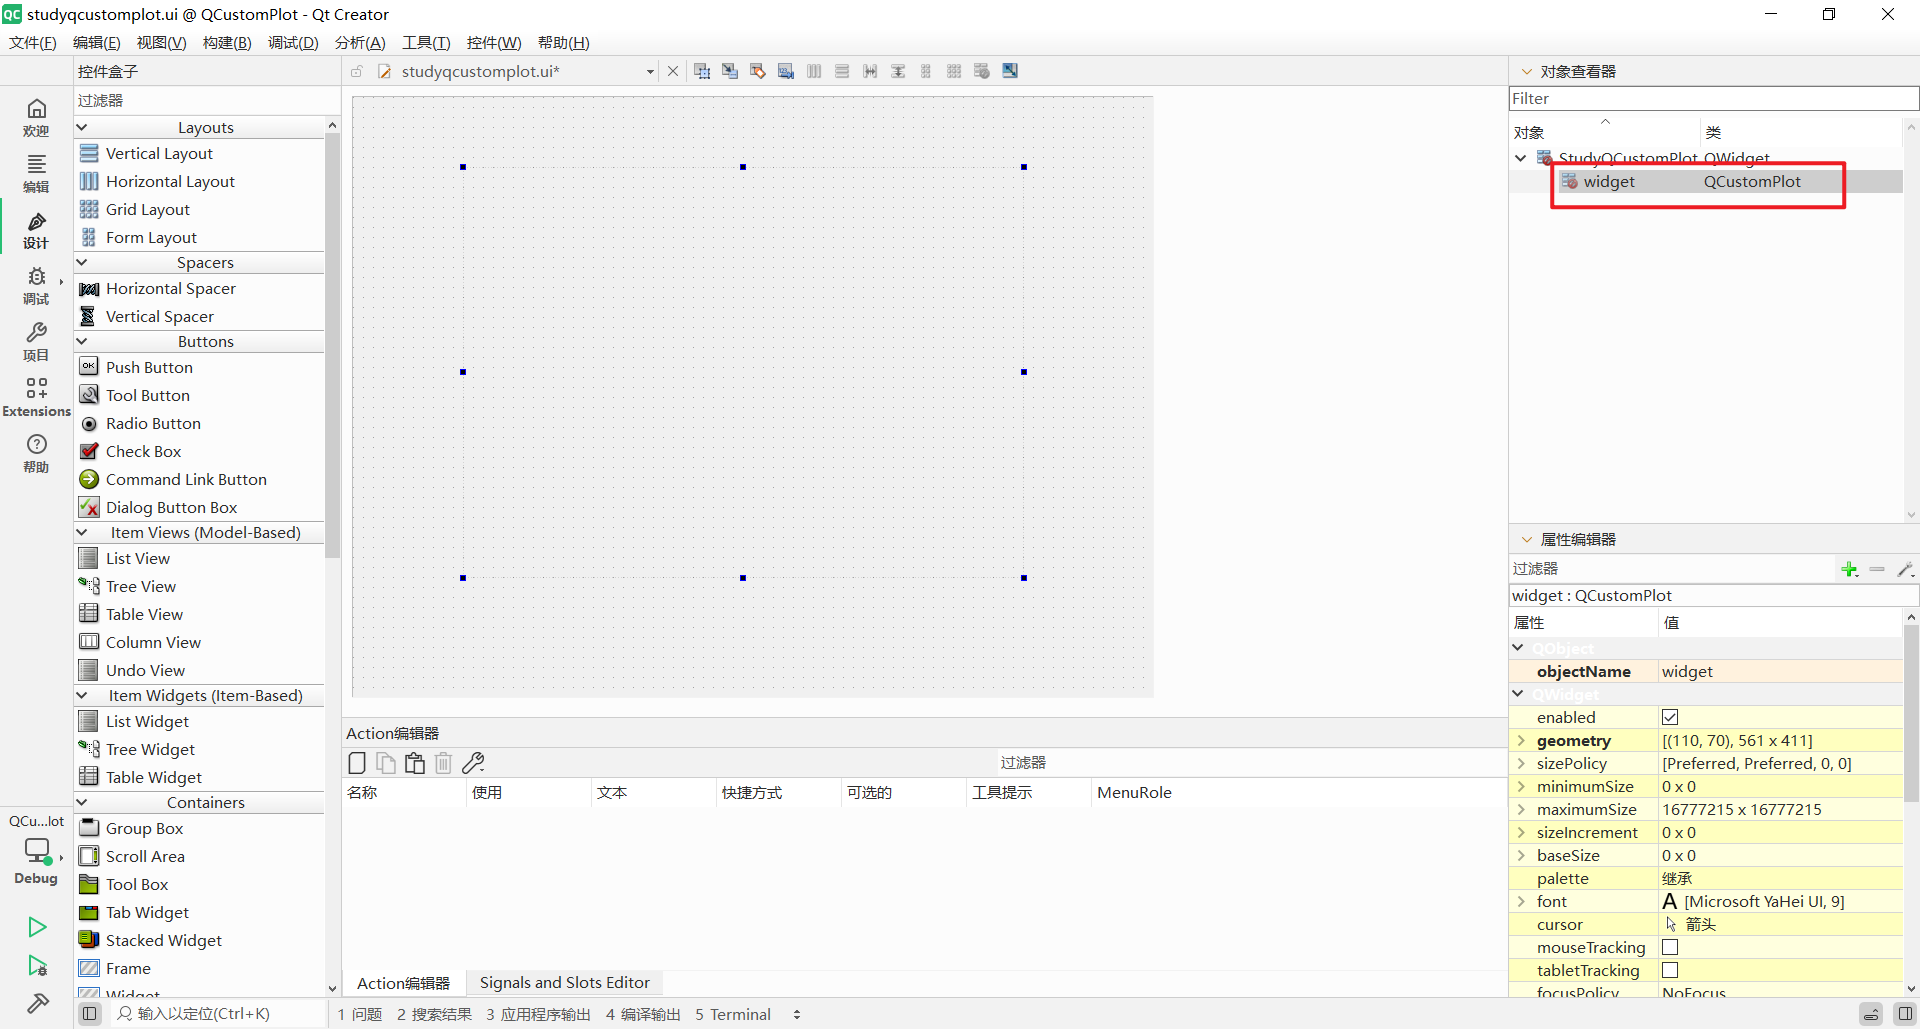
|-------------------------------|
| 可以看到这个QWidget被提升为了QCustomPlot |
3.3 初始化 QCustomPlot
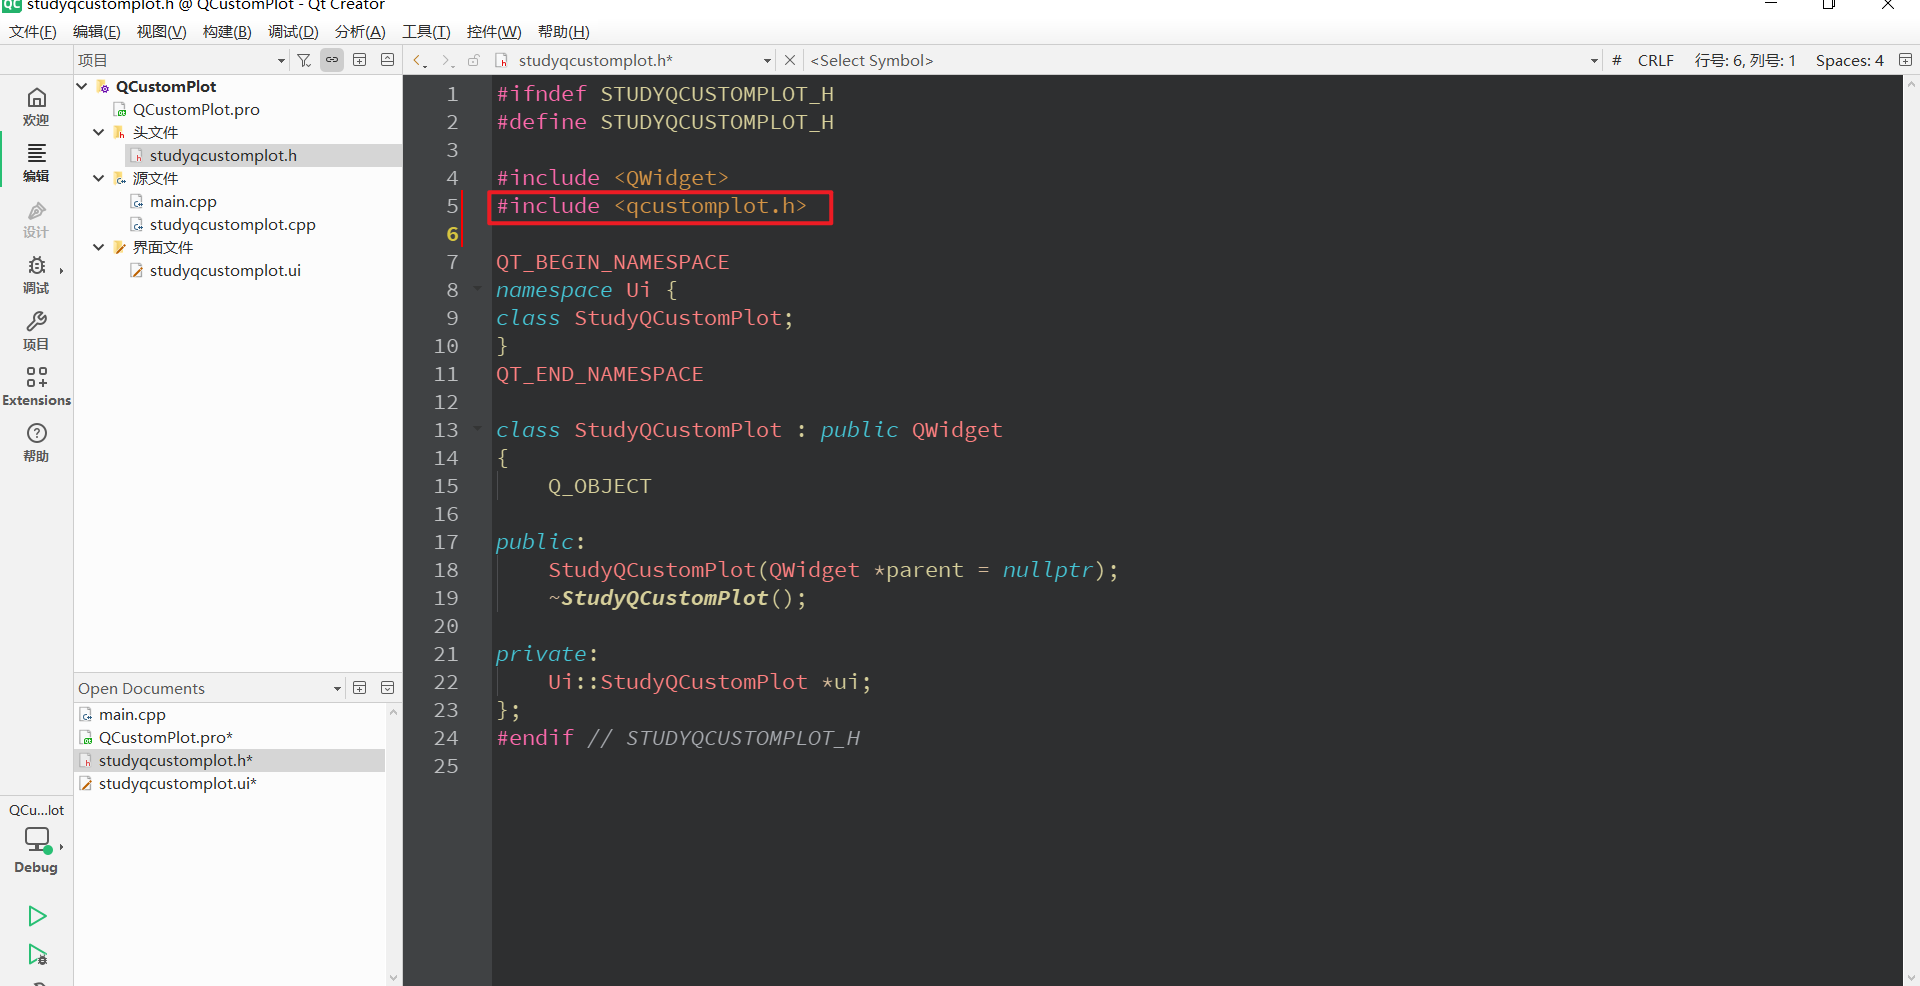
|-------|
| 添加头文件 |
|------|
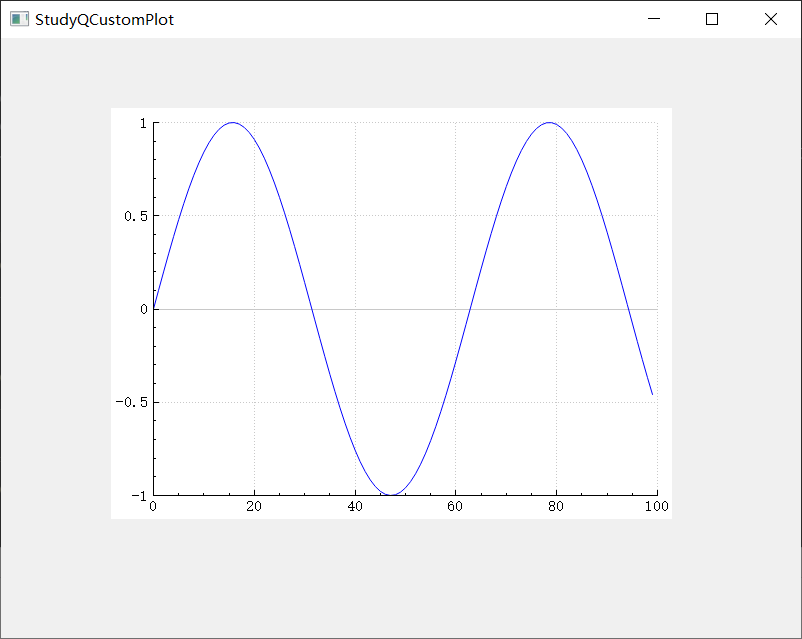
| 绘制曲线 |
cpp
// 生成 100 个 X/Y 点
QVector<double> x(100), y(100);
for (int i = 0; i < 100; ++i)
{
    x[i] = i;
    y[i] = qSin(i / 10.0);   // 画一条正弦曲线
}

// 添加一条曲线
ui->widget->addGraph();
ui->widget->graph(0)->setData(x, y);

// 设置坐标轴范围
ui->widget->xAxis->setRange(0, 100);
ui->widget->yAxis->setRange(-1, 1);

// 绘制
ui->widget->replot();
|------------|
| 如下图所示,成功绘制 |
4、项目文件
|-------------------------------|
| 为了方便大家参考,把.pro,.h,.cpp文件放在下面了 |
4.1 .pro文件
cpp
QT       += core gui printsupport

greaterThan(QT_MAJOR_VERSION, 4): QT += widgets

CONFIG += c++17

# You can make your code fail to compile if it uses deprecated APIs.
# In order to do so, uncomment the following line.
#DEFINES += QT_DISABLE_DEPRECATED_BEFORE=0x060000    # disables all the APIs deprecated before Qt 6.0.0

SOURCES += \
    main.cpp \
    studyqcustomplot.cpp \
    qcustomplot.cpp

HEADERS += \
    studyqcustomplot.h \
    qcustomplot.h

FORMS += \
    studyqcustomplot.ui

# Default rules for deployment.
qnx: target.path = /tmp/$${TARGET}/bin
else: unix:!android: target.path = /opt/$${TARGET}/bin
!isEmpty(target.path): INSTALLS += target
4.2 .h文件
cpp
#ifndef STUDYQCUSTOMPLOT_H
#define STUDYQCUSTOMPLOT_H

#include <QWidget>
#include <qcustomplot.h>

QT_BEGIN_NAMESPACE
namespace Ui {
class StudyQCustomPlot;
}
QT_END_NAMESPACE

class StudyQCustomPlot : public QWidget
{
    Q_OBJECT

public:
    StudyQCustomPlot(QWidget *parent = nullptr);
    ~StudyQCustomPlot();

private:
    Ui::StudyQCustomPlot *ui;
};
#endif // STUDYQCUSTOMPLOT_H
4.3 .cpp文件
cpp
#include "studyqcustomplot.h"
#include "ui_studyqcustomplot.h"

StudyQCustomPlot::StudyQCustomPlot(QWidget *parent)
    : QWidget(parent)
    , ui(new Ui::StudyQCustomPlot)
{
    ui->setupUi(this);

    // 生成 100 个 X/Y 点
    QVector<double> x(100), y(100);
    for (int i = 0; i < 100; ++i)
    {
        x[i] = i;
        y[i] = qSin(i / 10.0);   // 画一条正弦曲线
    }

    // 添加一条曲线
    ui->widget->addGraph();
    ui->widget->graph(0)->setData(x, y);

    // 设置坐标轴范围
    ui->widget->xAxis->setRange(0, 100);
    ui->widget->yAxis->setRange(-1, 1);

    // 绘制
    ui->widget->replot();
}

StudyQCustomPlot::~StudyQCustomPlot()
{
    delete ui;
}
5、总结
|-----------------------------------------------------------------------------------------------------|
| 以上就是QCustomPlot绘制曲线的整个过程了,浏览过程中,如若发现错误,欢迎大家指正,有问题的可以评论区留言或者私信。最后,如果大家觉得有所帮助的话,可以点个赞,谢谢大家!祉猷并茂,顺遂无虞! |