文章目录
- ELK企业日志分析系统
-
- 1.概述
- 2.案例环境:配置ELK日志分析系统
- 3.配置elasticsearch环境
- 4.安装logstash
-
- 安装Apahce服务(httpd)
- 安装Java环境
- 安装logstash
- logstash(apache节点)与elasticsearch(node节点)做对接测试
- [登录192.168.108.43 在Apache服务器上,输入采用标准输入 输出采用标准输出](#登录192.168.108.43 在Apache服务器上,输入采用标准输入 输出采用标准输出)
- 使用rubydebug显示详细输出,codec为一种编解码器
- [笔记本192.168.108.1 登陆](#笔记本192.168.108.1 登陆)
- 5.安装Kibana
ELK企业日志分析系统
1.概述
1.1前言
日志分析是运维工程师解决系统故障,发现问题的主要手段。日志主要包括系统日志、应用程序日志和安全日志。
系统运维和开发人员可以通过日志了解服务器软硬件信息、检查配置过程中的错误及错误发生的原因。经常分析日志可以了解服务器的负荷,性能安全性,从而及时采取措施纠正错误。通常,日志被分散的储存在不同的设备上。如果你管理数十上百台服务器,你还在使用依次登录每台机器的传统方法查阅日志,即繁琐又效率低下。为此,我们可以使用集中化的日志管理,例如:开源的syslog,将所有服务器上的日志收集汇总。
集中化管理日志后,日志的统计和检索又成为一件比较麻烦的事情,一般我们使用grep、awk和wc等Linux命令能实现检索和统计,但是对于更高要求的查询、排序和统计等,再加上庞大的机器数量,使用这样的方法依然难免有点力不从心。开源实时日志分析ELK平台能够完美的解决我们上述的问题,ELK由ElasticSearch、Logstash和Kiabana三个开源工具组成。官方网站:https://www.elastic.co/products
-
Elasticsearch是个开源分布式搜索引擎,它的特点有:分布式,零配置,自动发现,索引自动分片,索引副本机制,restful风格接口,多数据源,自动搜索负载等。
-
Logstash是一个完全开源的工具,它可以对你的日志进行收集、过滤,并将其存储,供以后使用(如,搜索)。
-
Kibana 也是一个开源和免费的工具,Kibana可以为 Logstash 和 ElasticSearch 提供友好的日志分析Web 界面,可以帮助您汇总、分析和搜索重要数据日志。
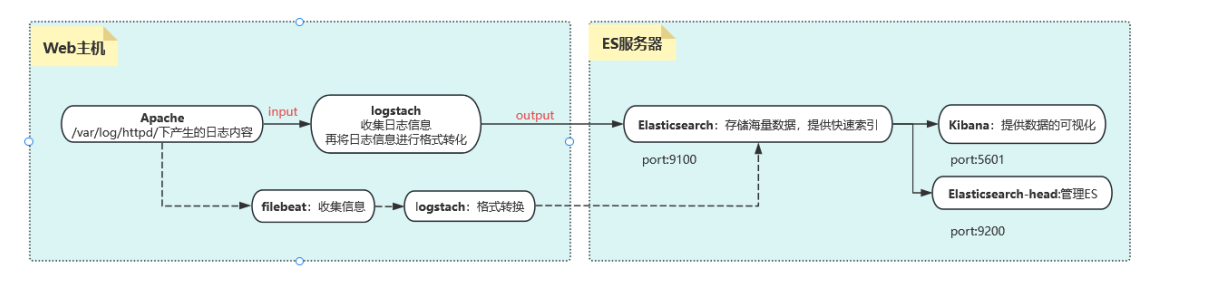
1.2.ELK工作原理展示图:
【APPServer集群】→→【logstash Agent 采集器】→→【ElasticSearch Cluster】→→【Kibana Server】→→【Browser】
Logstash收集AppServer产生的Log,并存放到ElasticSearch集群中,而Kibana则从ES集群中查询数据生成图表,再返回给Browser。简单来说,进行日志处理分析,一般需要经过以下几个步骤:
- 将日志进行集中化管理(beats)
- 将日志格式化(logstash)
- 对格式化后的数据进行索引和存储(elasticsearch)
- 前端数据的展示(kibana)
1.3.知识点概述
核心概念一览
首先,一个简单的类比来帮助你理解它们之间的关系:
想象一下银行系统:
-
Logstash 就像是各地的柜台职员和运钞车 。它负责从各个来源(ATM、柜台、网上银行)收集 货币(数据),进行清点、辨别真伪、分类整理 (解析和转换),然后运送到总行金库。
-
Elasticsearch 就是银行的巨型、高科技、超高效的金库和归档系统 。它不仅安全地存储 所有货币(数据),还建立了一套极其精细的索引。当需要查询时,它能在一瞬间从海量库存中精准地找到任何一张钞票或任何一笔交易记录。
-
Kibana 则是银行的数据分析和监控中心的大屏幕 。它连接到金库(Elasticsearch),让管理人员和分析师可以通过各种图表、仪表盘、地图 来可视化金融趋势、交易流水、风险状况,而不是去面对一堆枯燥的数字表格。
这个系统的核心数据流通常是:
日志/数据源 → Logstash(收集、处理) → Elasticsearch(存储、索引、搜索) → Kibana(可视化、分析)
Elasticsearch:分布式搜索和分析引擎
核心角色:大脑和心脏 - 负责海量数据的存储、检索和分析。
详细作用:
-
分布式存储与高可用性:
- Elasticsearch 是一个分布式 数据库。数据会被分散存储 across 多个服务器(节点)上。这意味着它可以处理PB****级别的海量数据,并且通过副本(replicas)机制,即使某个硬件发生故障,数据也不会丢失,服务也不会中断,实现了高可用性。
-
近乎实时的搜索:
- 这是它最核心的能力。数据从被写入到可以被搜索,只有毫秒级的延迟(约1秒内)。这对于需要实时监控和告警的场景至关重要。
-
强大的全文搜索引擎:
- 基于 Apache Lucene 构建,提供了无比强大和灵活的全文搜索功能。它不仅仅是简单的关键字匹配,还支持:
- 模糊搜索:即使拼写错误也能找到结果。
- 同义词处理:搜索"手机"也能找到包含"电话"的结果。
- 相关性评分:根据多种因素对搜索结果进行排序,将最相关的结果排在前面。
- 基于 Apache Lucene 构建,提供了无比强大和灵活的全文搜索功能。它不仅仅是简单的关键字匹配,还支持:
-
先进的索引技术:
- 数据在存储时会被倒排索引(Inverted Index)。这是一种类似书籍最后"索引"页的技术(例如,提到"数据库"这个词的页面是 10, 23, 45)。这使得它的查询速度极快,远远优于传统的逐行扫描数据库。
-
丰富的 RESTful API:
- 几乎所有操作,如数据的写入、查询、集群管理,都可以通过简单的 HTTP REST API 进行,这使得它非常容易与其他系统集成和开发。
-
强大的聚合分析能力:
- 除了搜索,它还能执行复杂的聚合(Aggregation)操作,相当于 SQL 中的 GROUP BY 再加上很多数学运算。例如:
- "统计过去5分钟内,错误日志的数量并按应用分组?"
- "计算网站访问量的95百分位延迟?"
- "绘制用户地理位置的分布图?"
- 除了搜索,它还能执行复杂的聚合(Aggregation)操作,相当于 SQL 中的 GROUP BY 再加上很多数学运算。例如:
简单总结:Elasticsearch 是一个专门为快速查找而设计的海量数据存储系统。它不擅长频繁更新事务(像MySQL那样),但极其擅长快速过滤、查询和分析巨量数据。
Logstash:服务器端数据处理管道
核心角色:搬运工和预处理车间 - 负责收集、解析、转换和输送数据。
详细作用:
Logstash 的工作流程被划分为三个阶段:Input → Filter → Output。
-
Input(输入):数据收集
- 从各种来源实时地收集 数据和日志。它拥有大量的插件,支持极其丰富的输入源,例如:
- 文件(如 *.log )
- 系统日志(Syslog)
- 消息队列(如 Kafka, Redis, RabbitMQ)
- 数据库(如 MySQL, PostgreSQL)
- 监控数据(如 Beats、JMX)
- 网络协议(如 TCP/UDP, HTTP)
- 从各种来源实时地收集 数据和日志。它拥有大量的插件,支持极其丰富的输入源,例如:
-
Filter(过滤):数据解析与 enrichment
- 这是 Logstash 最强大的部分。原始日志(比如一行文本)通常是非结构化的,Filter 插件将其解析成结构化的、有意义的字段 ,以便于在 Elasticsearch 中高效查询。常见操作包括:
- Grok:使用正则模式匹配来解析复杂的文本行。例如,从日志 "127.0.0.1 - -10/Oct/2023:14:16:39 +0000 "GET / HTTP/1.1" 200 3574" 中解析出client_ip , timestamp , http_method , response_code 等字段。
- Mutate:对字段进行修改,如重命名、删除、替换、转换数据类型。
- Date:解析时间戳,并设置为事件的正式 @timestamp 字段。
- GeoIP:根据 IP 地址查询出对应的国家、城市和经纬度信息,极大地丰富了数据维度。
- KV:解析 key=value 这样的数据。
- 这是 Logstash 最强大的部分。原始日志(比如一行文本)通常是非结构化的,Filter 插件将其解析成结构化的、有意义的字段 ,以便于在 Elasticsearch 中高效查询。常见操作包括:
-
Output(输出):数据发送
- 将处理好的数据发送到指定的目的地 。最常用的输出就是 Elasticsearch 。但它也支持输出到:
- 其他数据库(如 MongoDB)
- 消息队列(如 Kafka)
- 文件系统
- 监控系统(如 Nagios)
- 电子邮件等
- 将处理好的数据发送到指定的目的地 。最常用的输出就是 Elasticsearch 。但它也支持输出到:
简单总结:Logstash 是一个数据流引擎,负责将杂乱无章的原始数据加工成干净、结构化的数据,然后喂给 Elasticsearch。它是一个重量级工具,功能全面但资源消耗相对较高。
小提示 :在需要轻量级数据收集的场景下,Elastic 提供了 Beats(如 Filebeat, Metricbeat)来替代 Logstash 的 Input 功能,它们更轻量、更专一,通常将数据直接发送给 Logstash 做进一步处理或直接发送给 Elasticsearch。
Kibana:数据可视化与管理平台
核心角色:窗口和仪表盘 - 用于数据的探索、可视化和交互。
详细作用:
-
数据探索与发现(Discover):
- 提供一个交互式界面,让你能够直接查询和浏览存储在 Elasticsearch 中的原始数据。你可以使用搜索框(支持 Lucene 查询语法或 KQL),添加过滤器来动态地缩小数据范围,并查看匹配文档的详细内容。
-
可视化(Visualize):
- 提供丰富的可视化组件,让你可以将数据转化为各种直观的图表,包括:
- 柱状图、折线图、饼图
- 指标看板(显示单个数字,如总错误数)
- 数据表(用于聚合数据)
- 坐标地图(与 GeoIP 结合,在地图上显示数据点)
- 热力图 等
- 提供丰富的可视化组件,让你可以将数据转化为各种直观的图表,包括:
-
仪表盘(Dashboard):
- 可以将多个可视化组件拖放 组合成一个统一的、综合的仪表盘。这对于构建实时监控大屏非常有用,运维和开发团队可以在一个屏幕上全局掌握系统的健康状态、性能指标和业务趋势。
-
管理和维护:
- Kibana 还提供了 Stack Management 界面,用于管理和配置整个 Elastic Stack,例如:
- 索引生命周期管理(ILM)
- 用户和角色权限控制
- 导入/导出保存的可视化和仪表盘
- 配置 Kibana 本身
- Kibana 还提供了 Stack Management 界面,用于管理和配置整个 Elastic Stack,例如:
简单总结:Kibana 是 ELK Stack 的"面子",它将 Elasticsearch 中深奥的数据以人类易于理解的图形方式呈现出来,使得任何人都能轻松地进行数据分析和决策,而无需编写复杂的查询代码。
这就是 ELK/Elastic Stack 的强大之处------它将数据的收集、存储和可视化三个环节无缝衔接,提供了一个端到端的解决方案,广泛应用于日志分析、应用性能监控(APM)、安全信息与事件管理(SIEM)、业务指标分析等多个领域。
2.案例环境:配置ELK日志分析系统
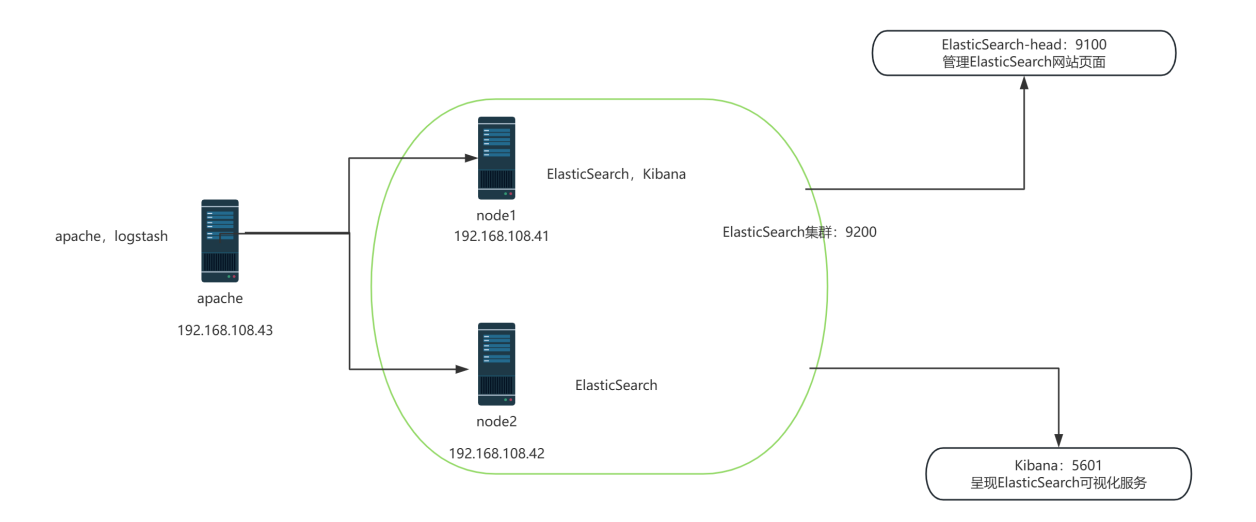
实验拓扑图:
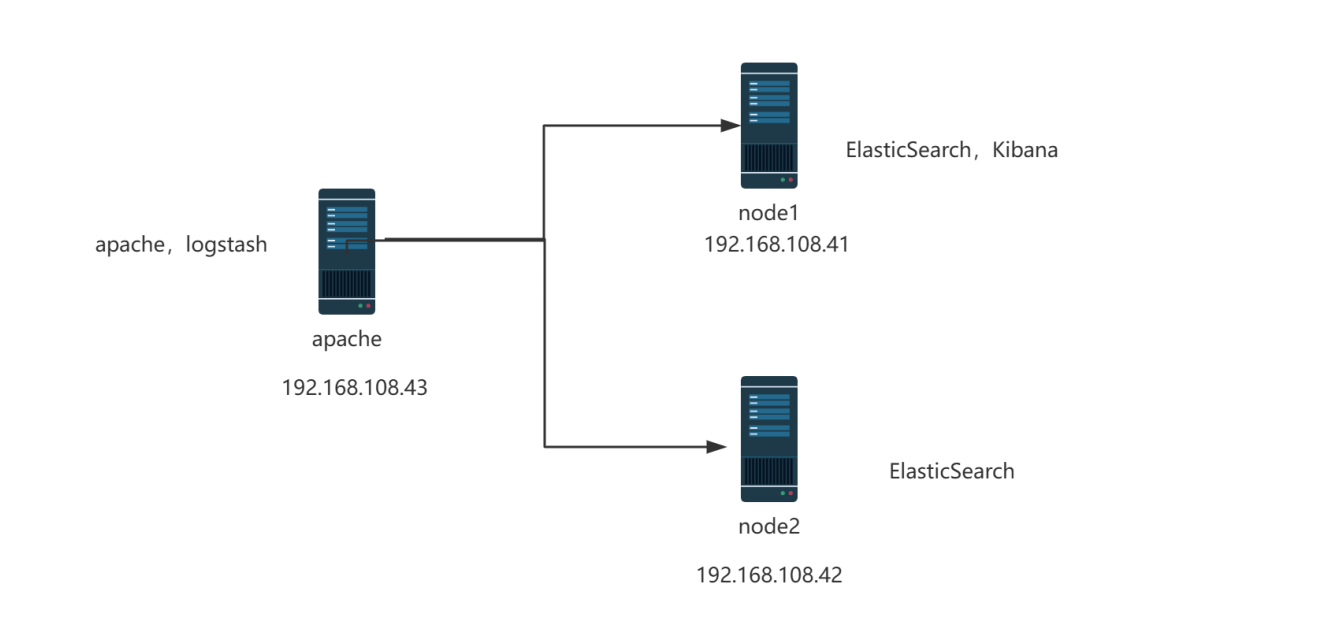
配置和安装ELK日志分析系统,安装集群方式,2个elasticsearch节点,并监控apache服务器日志
| 主机 | 操作系统 | 主机名 | IP地址 | 主要软件 |
|---|---|---|---|---|
| 服务器 | Centos7.9 | node1 | 192.168.108.41/24 | Elasticsearch Kibana |
| 服务器 | Centos7.9 | node2 | 192.168.108.42/24 | Elasticsearch |
| 服务器 | Centos7.9 | apache | 192.168.108.43/24 | Logstash Apache |
3.配置elasticsearch环境
准备主机名、域名、java环境
登录192.168.108.41(node1) 更改主机名 配置域名解析 查看Java环境
bash
[root@node1 ~]# systemctl stop firewalld.service
[root@node1 ~]# vim /etc/hosts
[root@node1 ~]# cat /etc/hosts
127.0.0.1   localhost localhost.localdomain localhost4 localhost4.localdomain4
::1         localhost localhost.localdomain localhost6 localhost6.localdomain6
`192.168.108.41 node1`
`192.168.108.42 node2`

[root@node1 ~]# java -version
openjdk version "1.8.0_262"
OpenJDK Runtime Environment (build 1.8.0_262-b10)
OpenJDK 64-Bit Server VM (build 25.262-b10, mixed mode)
登录192.168.108.42(node2) 更改主机名 配置域名解析 查看Java环境
bash
[root@node2 ~]# systemctl stop firewalld.service
[root@node2 ~]# vim /etc/hosts
[root@node2 ~]# cat /etc/hosts
127.0.0.1   localhost localhost.localdomain localhost4 localhost4.localdomain4
::1         localhost localhost.localdomain localhost6 localhost6.localdomain6
`192.168.108.41 node1`
`192.168.108.42 node2`

[root@node2 ~]# java -version
openjdk version "1.8.0_262"
OpenJDK Runtime Environment (build 1.8.0_262-b10)
OpenJDK 64-Bit Server VM (build 25.262-b10, mixed mode)
部署elasticsearch软件
1.登录192.168.108.41(node1)
-
安装elasticsearch---rpm包,上传elasticsearch-5.5.0.rpm到/opt目录下
bash[root@node1 ~]# cd /opt [root@node1 opt]# ls rh [root@node1 opt]# ls elasticsearch-5.5.0.rpm rh [root@node1 opt]# rpm -ivh elasticsearch-5.5.0.rpm warning: elasticsearch-5.5.0.rpm: Header V4 RSA/SHA512 Signature, key ID d88e42b4: NOKEY Preparing... ################################# [100%] Creating elasticsearch group... OK Creating elasticsearch user... OK Updating / installing... 1:elasticsearch-0:5.5.0-1 ################################# [100%] ### NOT starting on installation, please execute the following statements to configure elasticsearch service to start automatically using systemd sudo systemctl daemon-reload sudo systemctl enable elasticsearch.service ### You can start elasticsearch service by executing sudo systemctl start elasticsearch.service -
加载系统服务
bash[root@node1 opt]# systemctl daemon-reload [root@node1 opt]# systemctl enable elasticsearch.service Created symlink from /etc/systemd/system/multi-user.target.wants/elasticsearch.service to /usr/lib/systemd/system/elasticsearch.service. -
更改elasticsearch主配置文件
bash[root@node1 opt]# cd [root@node1 ~]# cp /etc/elasticsearch/elasticsearch.yml /etc/elasticsearch/elasticsearch.yml.bak [root@node1 ~]# vim /etc/elasticsearch/elasticsearch.yml 17 cluster.name: my-elk-cluster #集群名字 23 node.name: node1 #节点名字 33 path.data: /data/elk_data #数据存放路径 37 path.logs: /var/log/elasticsearch/ #日志存放路径 43 bootstrap.memory_lock: false #不在启动的时候锁定内存:锁定物理内存地址,防止es内存被交换出去,也就是避免es使用swap交换分区,频繁的交换,会导致IOPS变高。 55 network.host: 0.0.0.0 #提供服务绑定的IP地址,0.0.0.0代表所有地址 59 http.port: 9200 #侦听端口为9200 68 discovery.zen.ping.unicast.hosts: ["node1", "node2"] #集群发现通过单播实现 -
创建数据存放路径并授权
bash[root@node1 ~]# mkdir -p /data/elk_data [root@node1 ~]# chown elasticsearch:elasticsearch /data/elk_data/ -
启动elasticsearch是否成功开启
bash[root@node1 ~]# systemctl start elasticsearch.service [root@node1 ~]# netstat -antp |grep 9200 tcp6 0 0 :::9200 :::* LISTEN 51240/java -
查看节点信息 用真机192.168.108.1 的浏览器打开 http://192.168.108.41:9200 有文件打开 下面
是节点的信息
bash
{
  "name" : "node1",
  "cluster_name" : "my-elk-cluster",
  "cluster_uuid" : "g78kS99pTu2xYqCKRih86A",
  "version" : {
    "number" : "5.5.0",
    "build_hash" : "260387d",
    "build_date" : "2017-06-30T23:16:05.735Z",
    "build_snapshot" : false,
    "lucene_version" : "6.6.0"
  },
  "tagline" : "You Know, for Search"
2.登录192.168.108.42
-
安装elasticsearch---rpm包,上传elasticsearch-5.5.0.rpm到/opt目录下
bash[root@node2 opt]# cd /opt [root@node2 opt]# rpm -ivh elasticsearch-5.5.0.rpm warning: elasticsearch-5.5.0.rpm: Header V4 RSA/SHA512 Signature, key ID d88e42b4: NOKEY Preparing... ################################# [100%] Creating elasticsearch group... OK Creating elasticsearch user... OK Updating / installing... 1:elasticsearch-0:5.5.0-1 ################################# [100%] ### NOT starting on installation, please execute the following statements to configure elasticsearch service to start automatically using systemd sudo systemctl daemon-reload sudo systemctl enable elasticsearch.service ### You can start elasticsearch service by executing sudo systemctl start elasticsearch.service -
加载系统服务
bash[root@node2 opt]# systemctl daemon-reload [root@node2 opt]# systemctl enable elasticsearch.service Created symlink from /etc/systemd/system/multi-user.target.wants/elasticsearch.service to /usr/lib/systemd/system/elasticsearch.service. -
更改elasticsearch主配置文件
bash[root@node2 opt]# cd [root@node2 ~]# cp /etc/elasticsearch/elasticsearch.yml /etc/elasticsearch/elasticsearch.yml.bak [root@node2 ~]# vim /etc/elasticsearch/elasticsearch.yml 17 cluster.name: my-elk-cluster ####集群名字 23 node.name: node2 ####节点名字 33 path.data: /data/elk_data ####数据存放路径 37 path.logs: /var/log/elasticsearch/ ####日志存放路径 43 bootstrap.memory_lock: false ####不在启动的时候锁定内存 55 network.host: 0.0.0.0 ####提供服务绑定的IP地址,0.0.0.0代表所有地址 59 http.port: 9200 ####侦听端口为9200 68 discovery.zen.ping.unicast.hosts: ["node1", "node2"] ####集群发现通过单播实现 -
创建数据存放路径并授权
bash[root@node2 ~]# mkdir /data/elk_data -p [root@node2 ~]# chown elasticsearch:elasticsearch /data/elk_data/ -
启动elasticsearch是否成功开启
bash[root@node2 ~]# systemctl start elasticsearch.service [root@node2 ~]# netstat -antp |grep 9200 tcp6 0 0 :::9200 :::* LISTEN 51674/java -
查看节点信息 用真机192.168.108.41 的浏览器打开 http://192.168.108.42:9200 有文件打开 下
面是节点的信息
bash
{
  "name" : "node2",
  "cluster_name" : "my-elk-cluster",
  "cluster_uuid" : "g78kS99pTu2xYqCKRih86A",
  "version" : {
    "number" : "5.5.0",
    "build_hash" : "260387d",
    "build_date" : "2017-06-30T23:16:05.735Z",
    "build_snapshot" : false,
    "lucene_version" : "6.6.0"
  },
  "tagline" : "You Know, for Search"
3.集群检查健康和状态
在真机浏览器192.168.108.41 打开http://192.168.108.41:9200/_cluster/health?pretty检查群集健康情况
bash
{
  "cluster_name" : "my-elk-cluster",
  "status" : "green",
  "timed_out" : false,
 ` "number_of_nodes" : 2,`
  `"number_of_data_nodes" : 2,`
  "active_primary_shards" : 0,
  "active_shards" : 0,
  "relocating_shards" : 0,
  "initializing_shards" : 0,
  "unassigned_shards" : 0,
  "delayed_unassigned_shards" : 0,
  "number_of_pending_tasks" : 0,
  "number_of_in_flight_fetch" : 0,
  "task_max_waiting_in_queue_millis" : 0,
  "active_shards_percent_as_number" : 100.0
在真机浏览器192.168.108.1 打开http://192.168.108.41:9200/_cluster/state?pretty检查群集状态信息
bash
{
  "cluster_name" : "my-elk-cluster",
 ` "version" : 3,`
  "state_uuid" : "NDvZBaCrSqqhSW8Th-8d9A",
  "master_node" : "DdKpI-_CQZWCgcU1Xs9TBw",
  "blocks" : { },
  "nodes" : {
    "DdKpI-_CQZWCgcU1Xs9TBw" : {
      "name" : "node2",
      "ephemeral_id" : "9CUNsIw9Q8qrqMDJAubtGw",
      "transport_address" : `"192.168.108.42:9300",`
      "attributes" : { }
    },
    "kIHczsycTI-liz7TXBRMqg" : {
      "name" : "node1",
      "ephemeral_id" : "7CM6JJujQoCVeG3LX8l5uQ",
      "transport_address" : `"192.168.108.41:9300",`
      "attributes" : { }
    }
  },
  "metadata" : {
    "cluster_uuid" : "g78kS99pTu2xYqCKRih86A",
    "templates" : { },
    "indices" : { },
    "index-graveyard" : {
      "tombstones" : [ ]
    }
  },
  "routing_table" : {
    "indices" : { }
  },
  "routing_nodes" : {
    "unassigned" : [ ],
    "nodes" : {
      "DdKpI-_CQZWCgcU1Xs9TBw" : [ ],
      "kIHczsycTI-liz7TXBRMqg" : [ ]
    }
  }
}
4.安装elasticsearch-head插件
查看上述集群的方式,及其不方便,我们可以通过安装elasticsearch-head插件后,来管理集群
登录192.168.108.41 node1主机上传node-v8.2.1.tar.gz到/opt
bash
[root@node1 ~]# yum install -y gcc gcc-c++ make -y编译安装node组件依赖包,耗时比较长 30分钟
bash
[root@node1 ~]# cd /opt
[root@node1 opt]# tar xzzvf node-v8.2.1.tar.gz

[root@node1 opt]# cd node-v8.2.1/
[root@node1 node-v8.2.1]# ./configure

[root@node1 node-v8.2.1]# make -j4

[root@node1 node-v8.2.1]# make install
5.安装phantomjs端框架
上传软件包到/usr/local/src/
bash
[root@node1 node-v8.2.1]# cd /usr/local/src/
[root@node1 src]# tar xjvf phantomjs-2.1.1-linux-x86_64.tar.bz2
[root@node1 src]# cd phantomjs-2.1.1-linux-x86_64/bin
[root@node1 bin]# cp phantomjs /usr/local/bin
6.安装elasticsearch-head数据可视化工具
bash
[root@node1 bin]# cd /usr/local/src/
[root@node1 src]# tar xzvf elasticsearch-head.tar.gz
[root@node1 src]# cd elasticsearch-head/
[root@node1 elasticsearch-head]# npm install
npm WARN deprecated fsevents@1.2.13: Upgrade to fsevents v2 to mitigate potential security issues
npm WARN optional SKIPPING OPTIONAL DEPENDENCY: fsevents@^1.0.0 (node_modules/karma/node_modules/chokidar/node_modules/fsevents):
npm WARN notsup SKIPPING OPTIONAL DEPENDENCY: Unsupported platform for fsevents@1.2.13: wanted {"os":"darwin","arch":"any"} (current: {"os":"linux","arch":"x64"})
npm WARN elasticsearch-head@0.0.0 license should be a valid SPDX license expression

up to date in 6.53s
修改主配置文件
bash
[root@node1 elasticsearch-head]# cd
[root@node1 ~]# vim /etc/elasticsearch/elasticsearch.yml
[root@node1 ~]# systemctl restart elasticsearch.service
#下面配置文件,插末尾##
http.cors.enabled: true ##开启跨域访问支持,默认为false
http.cors.allow-origin: "*" ## 跨域访问允许的域名地址
[root@node2 elasticsearch-head]# systemctl restart elasticsearch.service
启动elasticsearch-head 启动服务器
bash
[root@node1 ~]# cd /usr/local/src/elasticsearch-head/

####切换到后台运行
[root@node1 elasticsearch-head]# npm run start &
[1] 98832
[root@node1 elasticsearch-head]#
> elasticsearch-head@0.0.0 start /usr/local/src/elasticsearch-head
> grunt server

Running "connect:server" (connect) task
Waiting forever...
Started connect web server on http://localhost:9100

[root@node1 elasticsearch-head]# netstat -lnupt |grep 9100
tcp        0      0 0.0.0.0:9100            0.0.0.0:*               LISTEN      98842/grunt
[root@node1 elasticsearch-head]# netstat -lnupt |grep 9200
tcp6       0      0 :::9200                 :::*                    LISTEN      98742/java
[root@node1 elasticsearch-head]#
登录192.168.108.42 node2主机,上传node-v8.2.1.tar.gz到/opt编译安装node组件依赖包耗时比较长20分钟
bash
[root@node2 ~]# yum install -y gcc gcc-c++ make
[root@node2 ~]# cd /opt
[root@node2 opt]# ls
elasticsearch-5.5.0.rpm  node-v8.2.1.tar.gz  rh
[root@node2 opt]# tar xzvf node-v8.2.1.tar.gz

[root@node2 opt]# cd node-v8.2.1/
[root@node2 node-v8.2.1]# ./configure
[root@node2 node-v8.2.1]# make -j4

[root@node2 node-v8.2.1]# make install
5.安装phantomjs
上传软件包到/usr/local/src/
bash
[root@node2 node-v8.2.1]# cd /usr/local/src/
[root@node2 src]# ls
phantomjs-2.1.1-linux-x86_64.tar.bz2
[root@node2 src]# tar xjvf phantomjs-2.1.1-linux-x86_64.tar.bz2

[root@node2 src]# cd phantomjs-2.1.1-linux-x86_64/bin
[root@node2 bin]# cp phantomjs /usr/local/bin
6.安装elasticsearch-head
bash
[root@node2 bin]# cd /usr/local/src/
[root@node2 src]# tar xzvf elasticsearch-head.tar.gz

[root@node2 src]# cd elasticsearch-head/
[root@node2 elasticsearch-head]# npm install
npm WARN deprecated fsevents@1.2.13: Upgrade to fsevents v2 to mitigate potential security issues
npm WARN optional SKIPPING OPTIONAL DEPENDENCY: fsevents@^1.0.0 (node_modules/karma/node_modules/chokidar/node_modules/fsevents):
npm WARN notsup SKIPPING OPTIONAL DEPENDENCY: Unsupported platform for fsevents@1.2.13: wanted {"os":"darwin","arch":"any"} (current: {"os":"linux","arch":"x64"})
npm WARN elasticsearch-head@0.0.0 license should be a valid SPDX license expression

up to date in 5.132s
修改主配置文件
bash
[root@node2 elasticsearch-head]# cd
[root@node2 ~]# vim /etc/elasticsearch/elasticsearch.yml
####下面配置文件,插末尾##
http.cors.enabled: true ##开启跨域访问支持,默认为false
http.cors.allow-origin: "*" ## 跨域访问允许的域名地址

[root@node2 ~]# systemctl restart elasticsearch.service
启动elasticsearch-head 启动服务器
bash
[root@node2 ~]# cd /usr/local/src/elasticsearch-head/
[root@node2 elasticsearch-head]# npm run start &
[1] 98766
[root@node2 elasticsearch-head]#
> elasticsearch-head@0.0.0 start /usr/local/src/elasticsearch-head
> grunt server

Running "connect:server" (connect) task
Waiting forever...
Started connect web server on http://localhost:9100

[root@node2 elasticsearch-head]# netstat -lnupt |grep 9100
tcp        0      0 0.0.0.0:9100            0.0.0.0:*               LISTEN      98776/grunt
[root@node2 elasticsearch-head]# netstat -lnupt |grep 9200
tcp6       0      0 :::9200                 :::*                    LISTEN      98805/java
7.验证结果
node1现象:
真机上打开浏览器输入http://192.168.108.41:9100/ 可以看见群集很健康是绿色
在Elasticsearch 后面的栏目中输入http://192.168.108.41:9200
然后点连接 会发现:集群健康值: green (0 of 0)
●node1信息动作
★node2信息动作

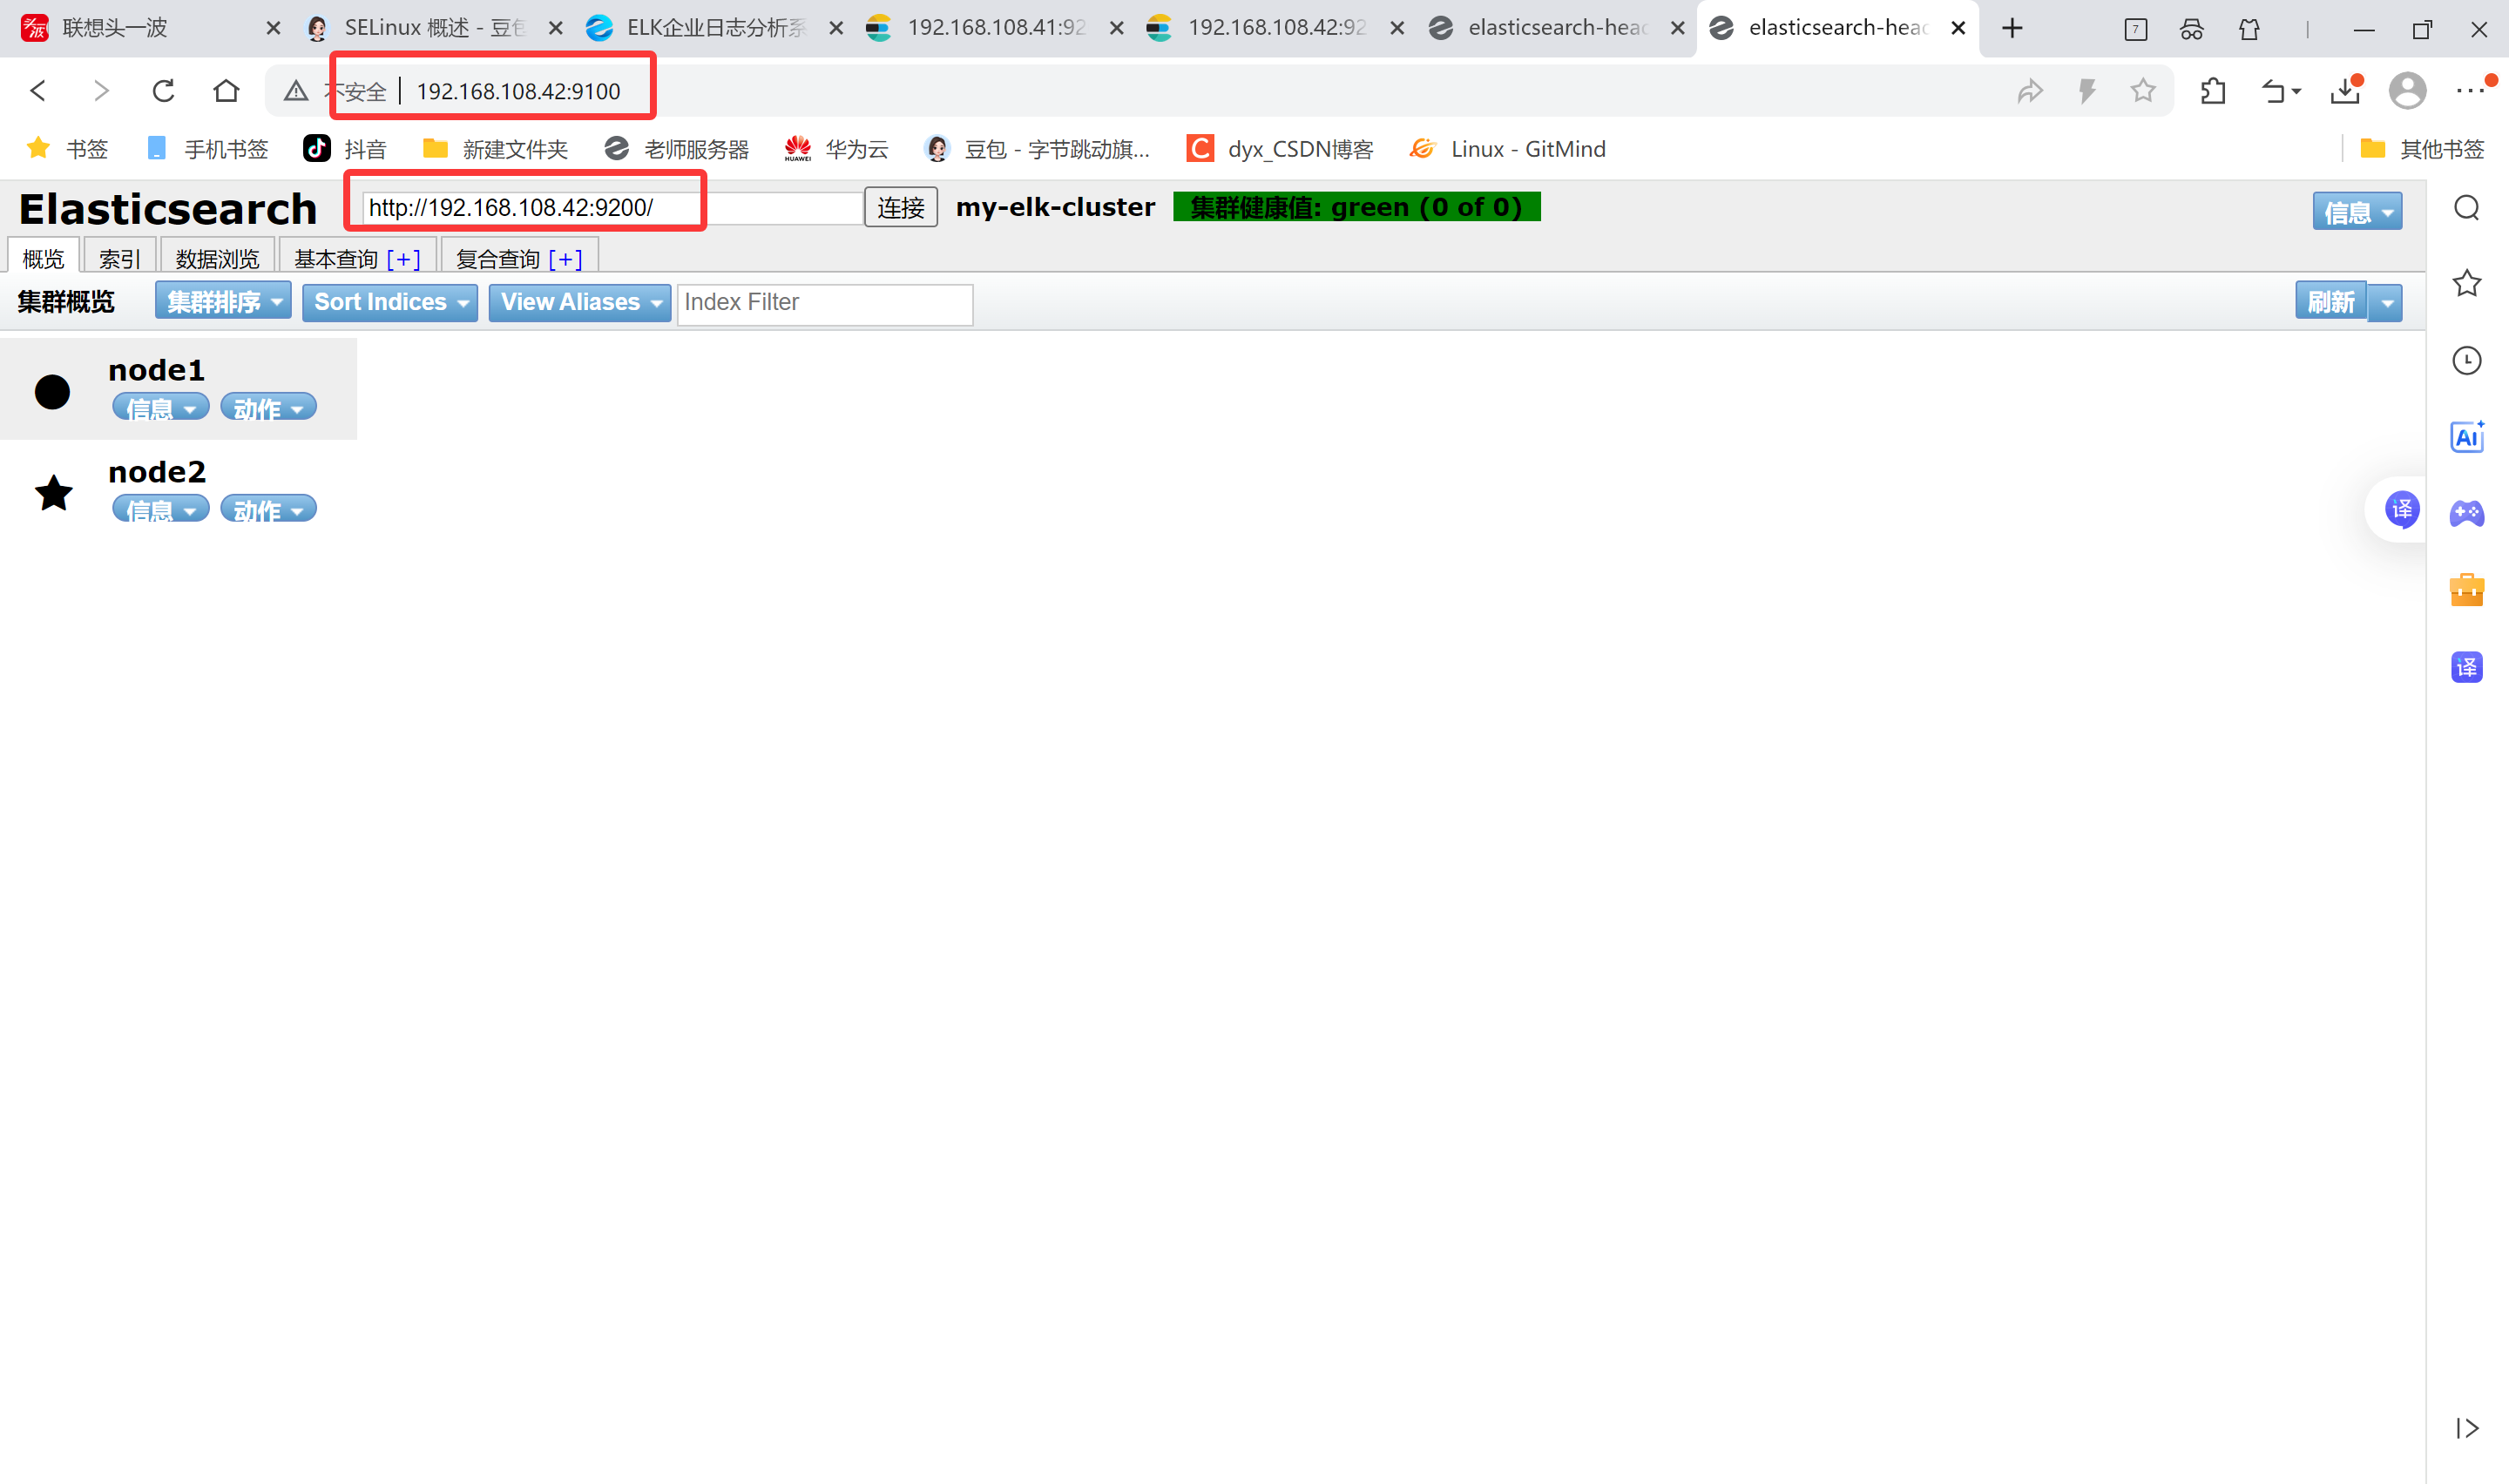
node2现象:
笔记本上打开浏览器输入http://192.168.108.42:9100/ 可以看见群集很健康是绿色
在Elasticsearch 后面的栏目中输入http://192.168.108.42:9200
然后点连接 会发现:集群健康值: green (0 of 0)
●node1信息动作
★node2信息动作
登录192.168.108.41 node1主机 索引为index-demo,类型为test,可以看到成功创建
bash
[root@node1 elasticsearch-head]# curl -XPUT 'localhost:9200/index-demo/test/1?pretty&pretty' -H 'content-Type: application/json' -d '{"user":"zhangsan","mesg":"hello world"}'
{
  "_index" : "index-demo",
  "_type" : "test",
  "_id" : "1",
  "_version" : 1,
  "result" : "created",
  "_shards" : {
    "total" : 2,
    "successful" : 2,
    "failed" : 0
  },
  "created" : true
}
在192.168.108.1 打开浏览器输入http://192.168100.41:9100/ 查看索引信息
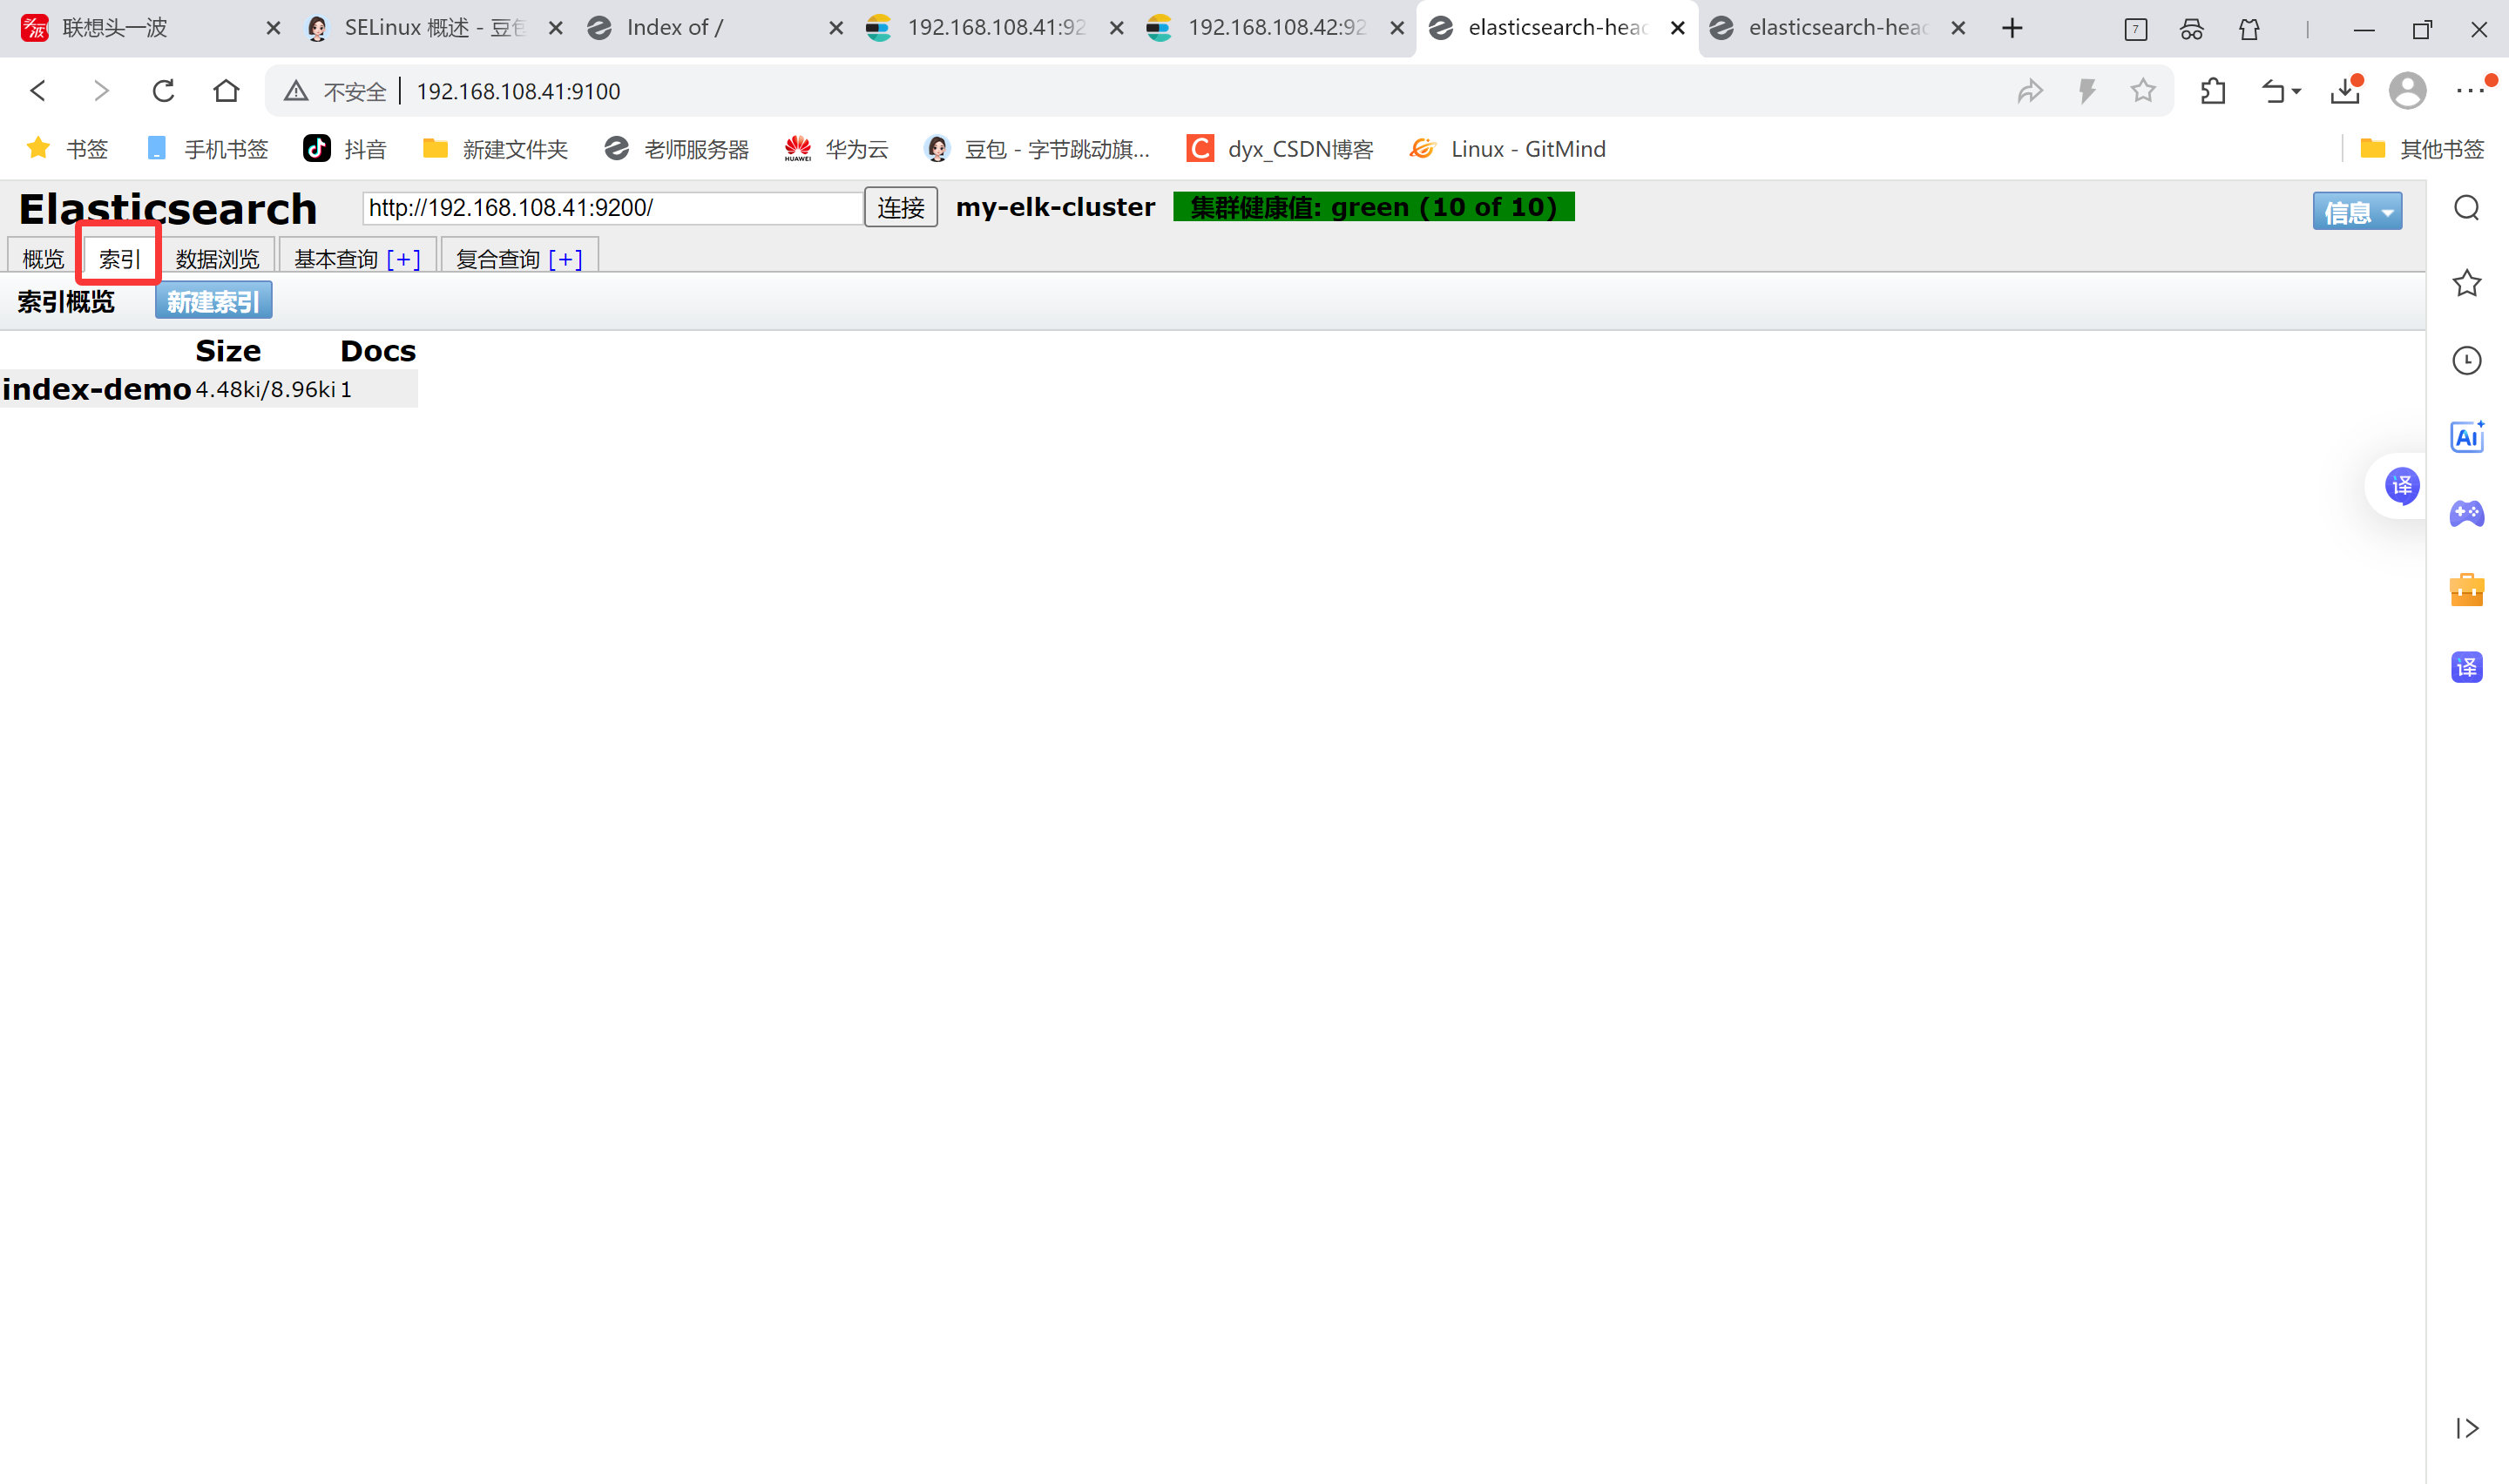
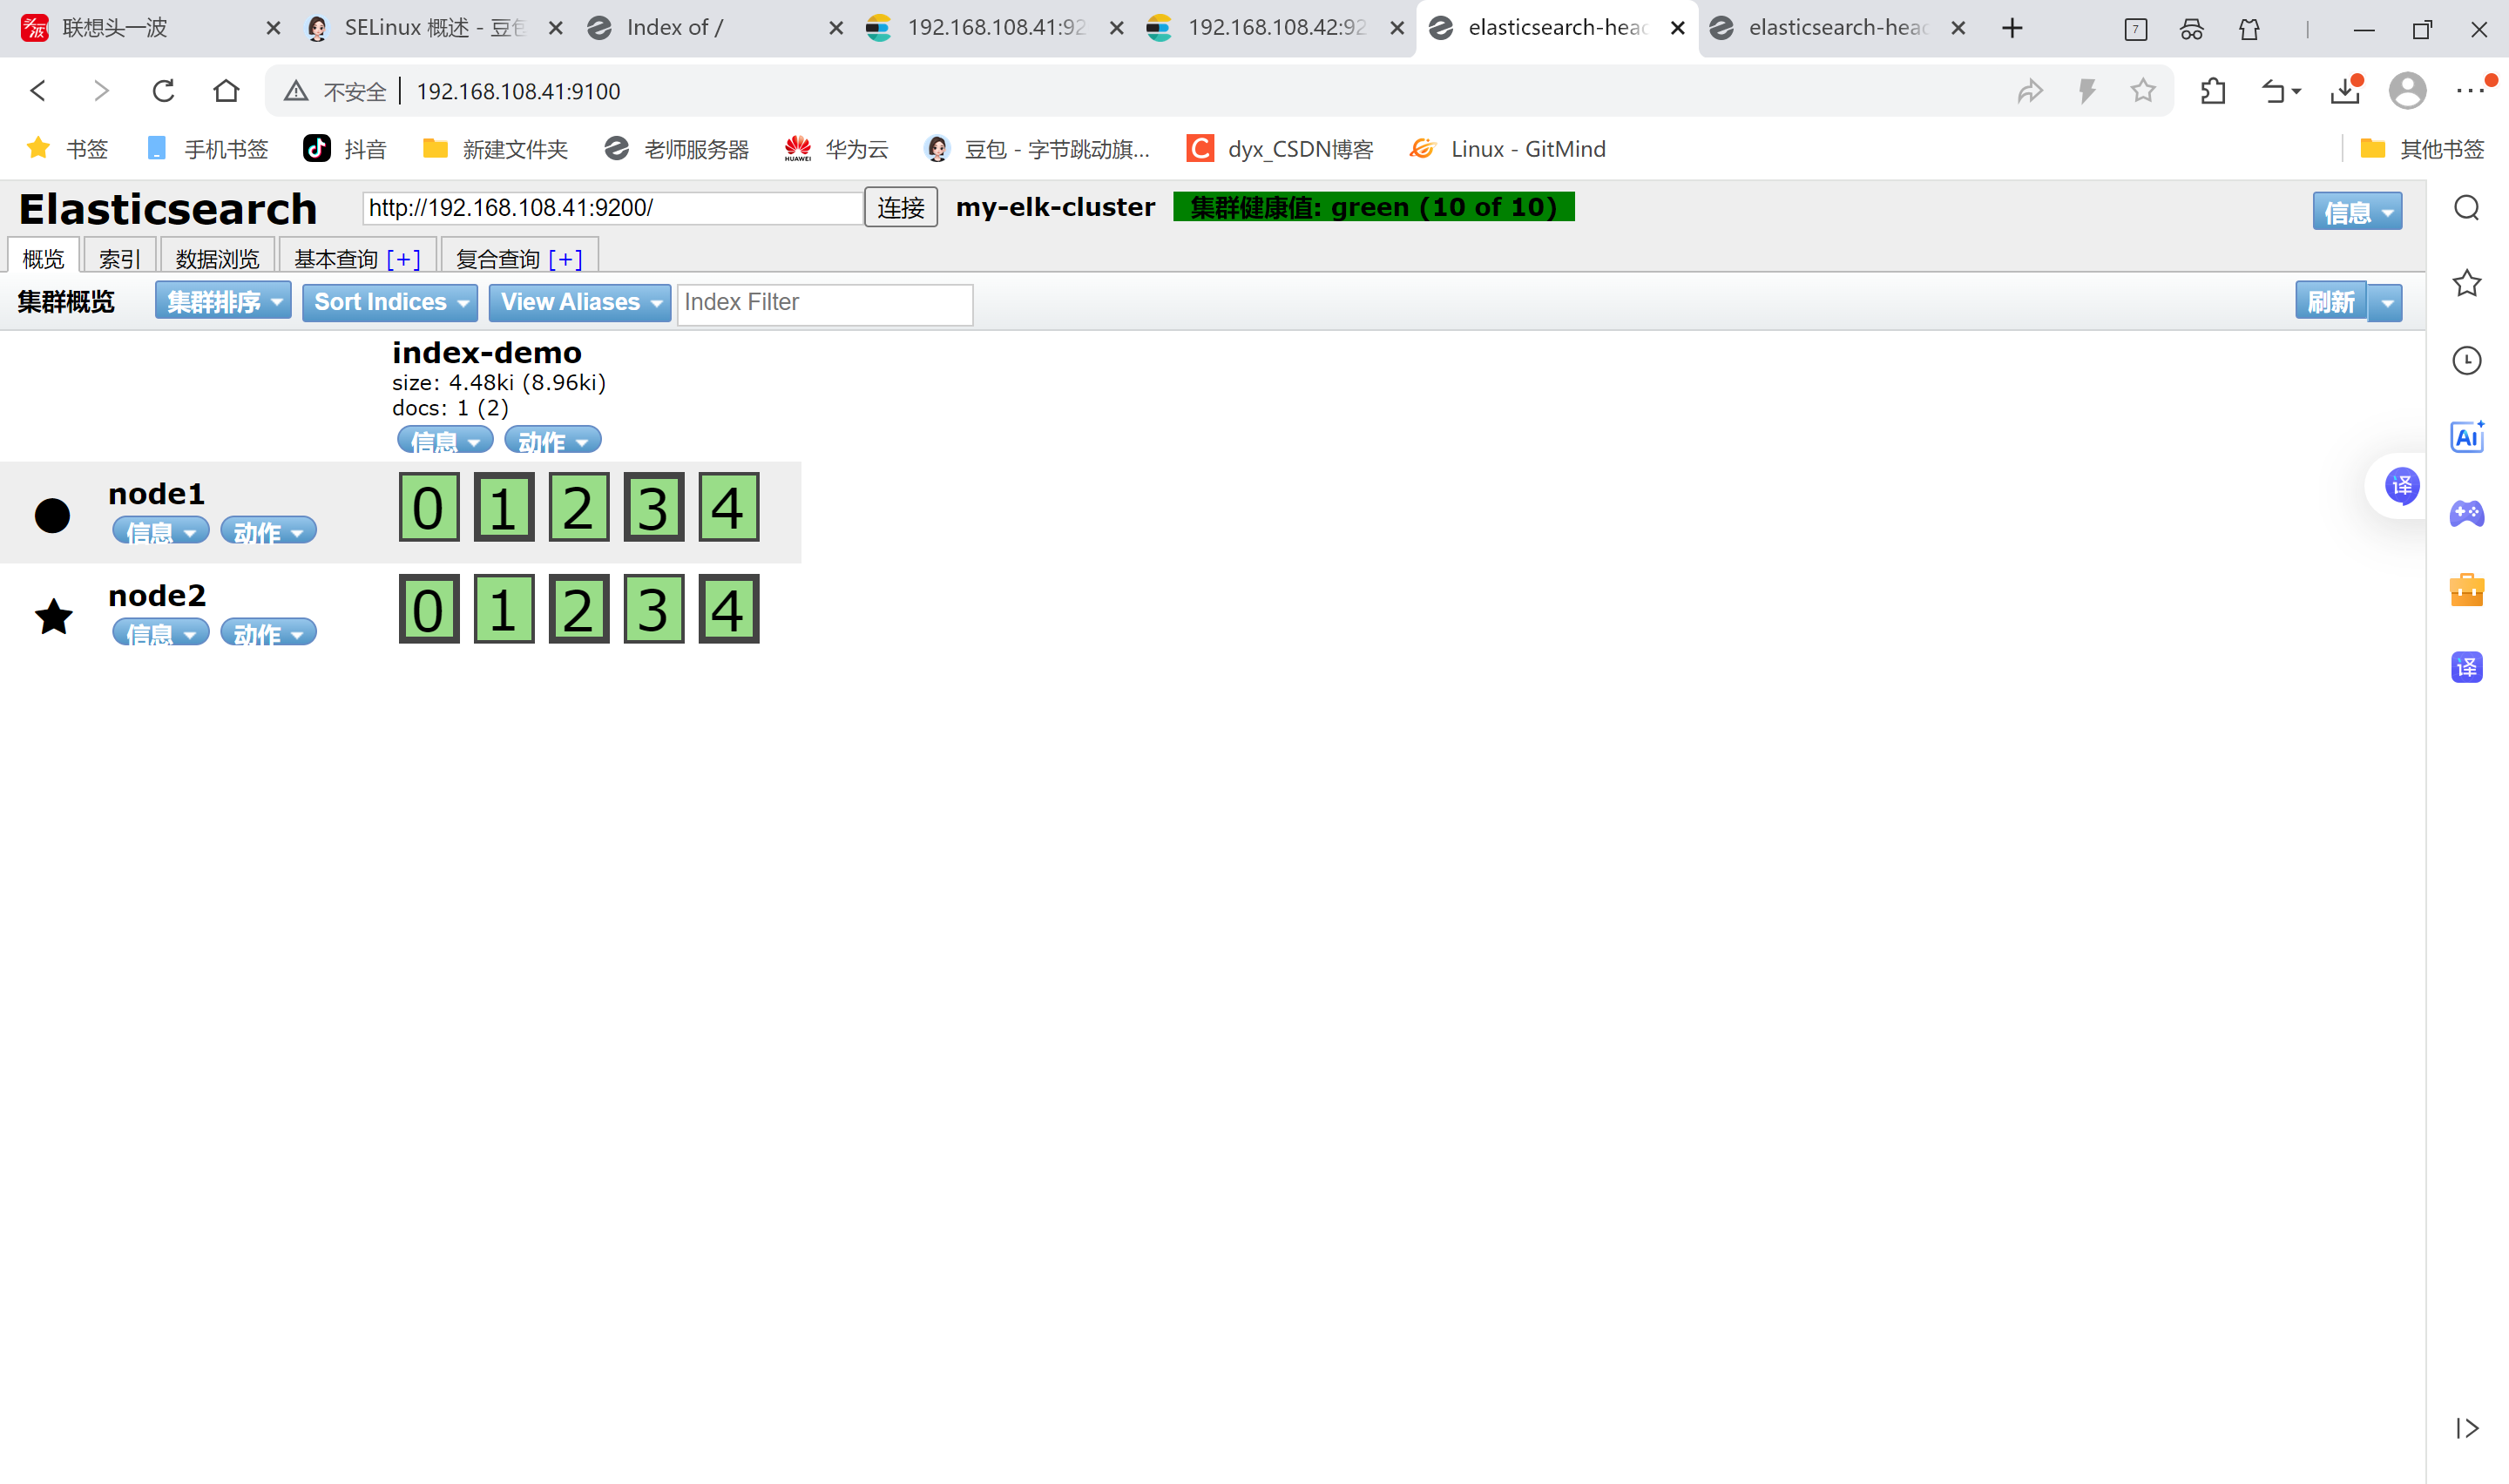
上面图可以看见索引默认被分片5个,并且有一个副本
node1信息动作 01234
node2信息动作 01234
node1和node2是平等关系,不是主从关系,
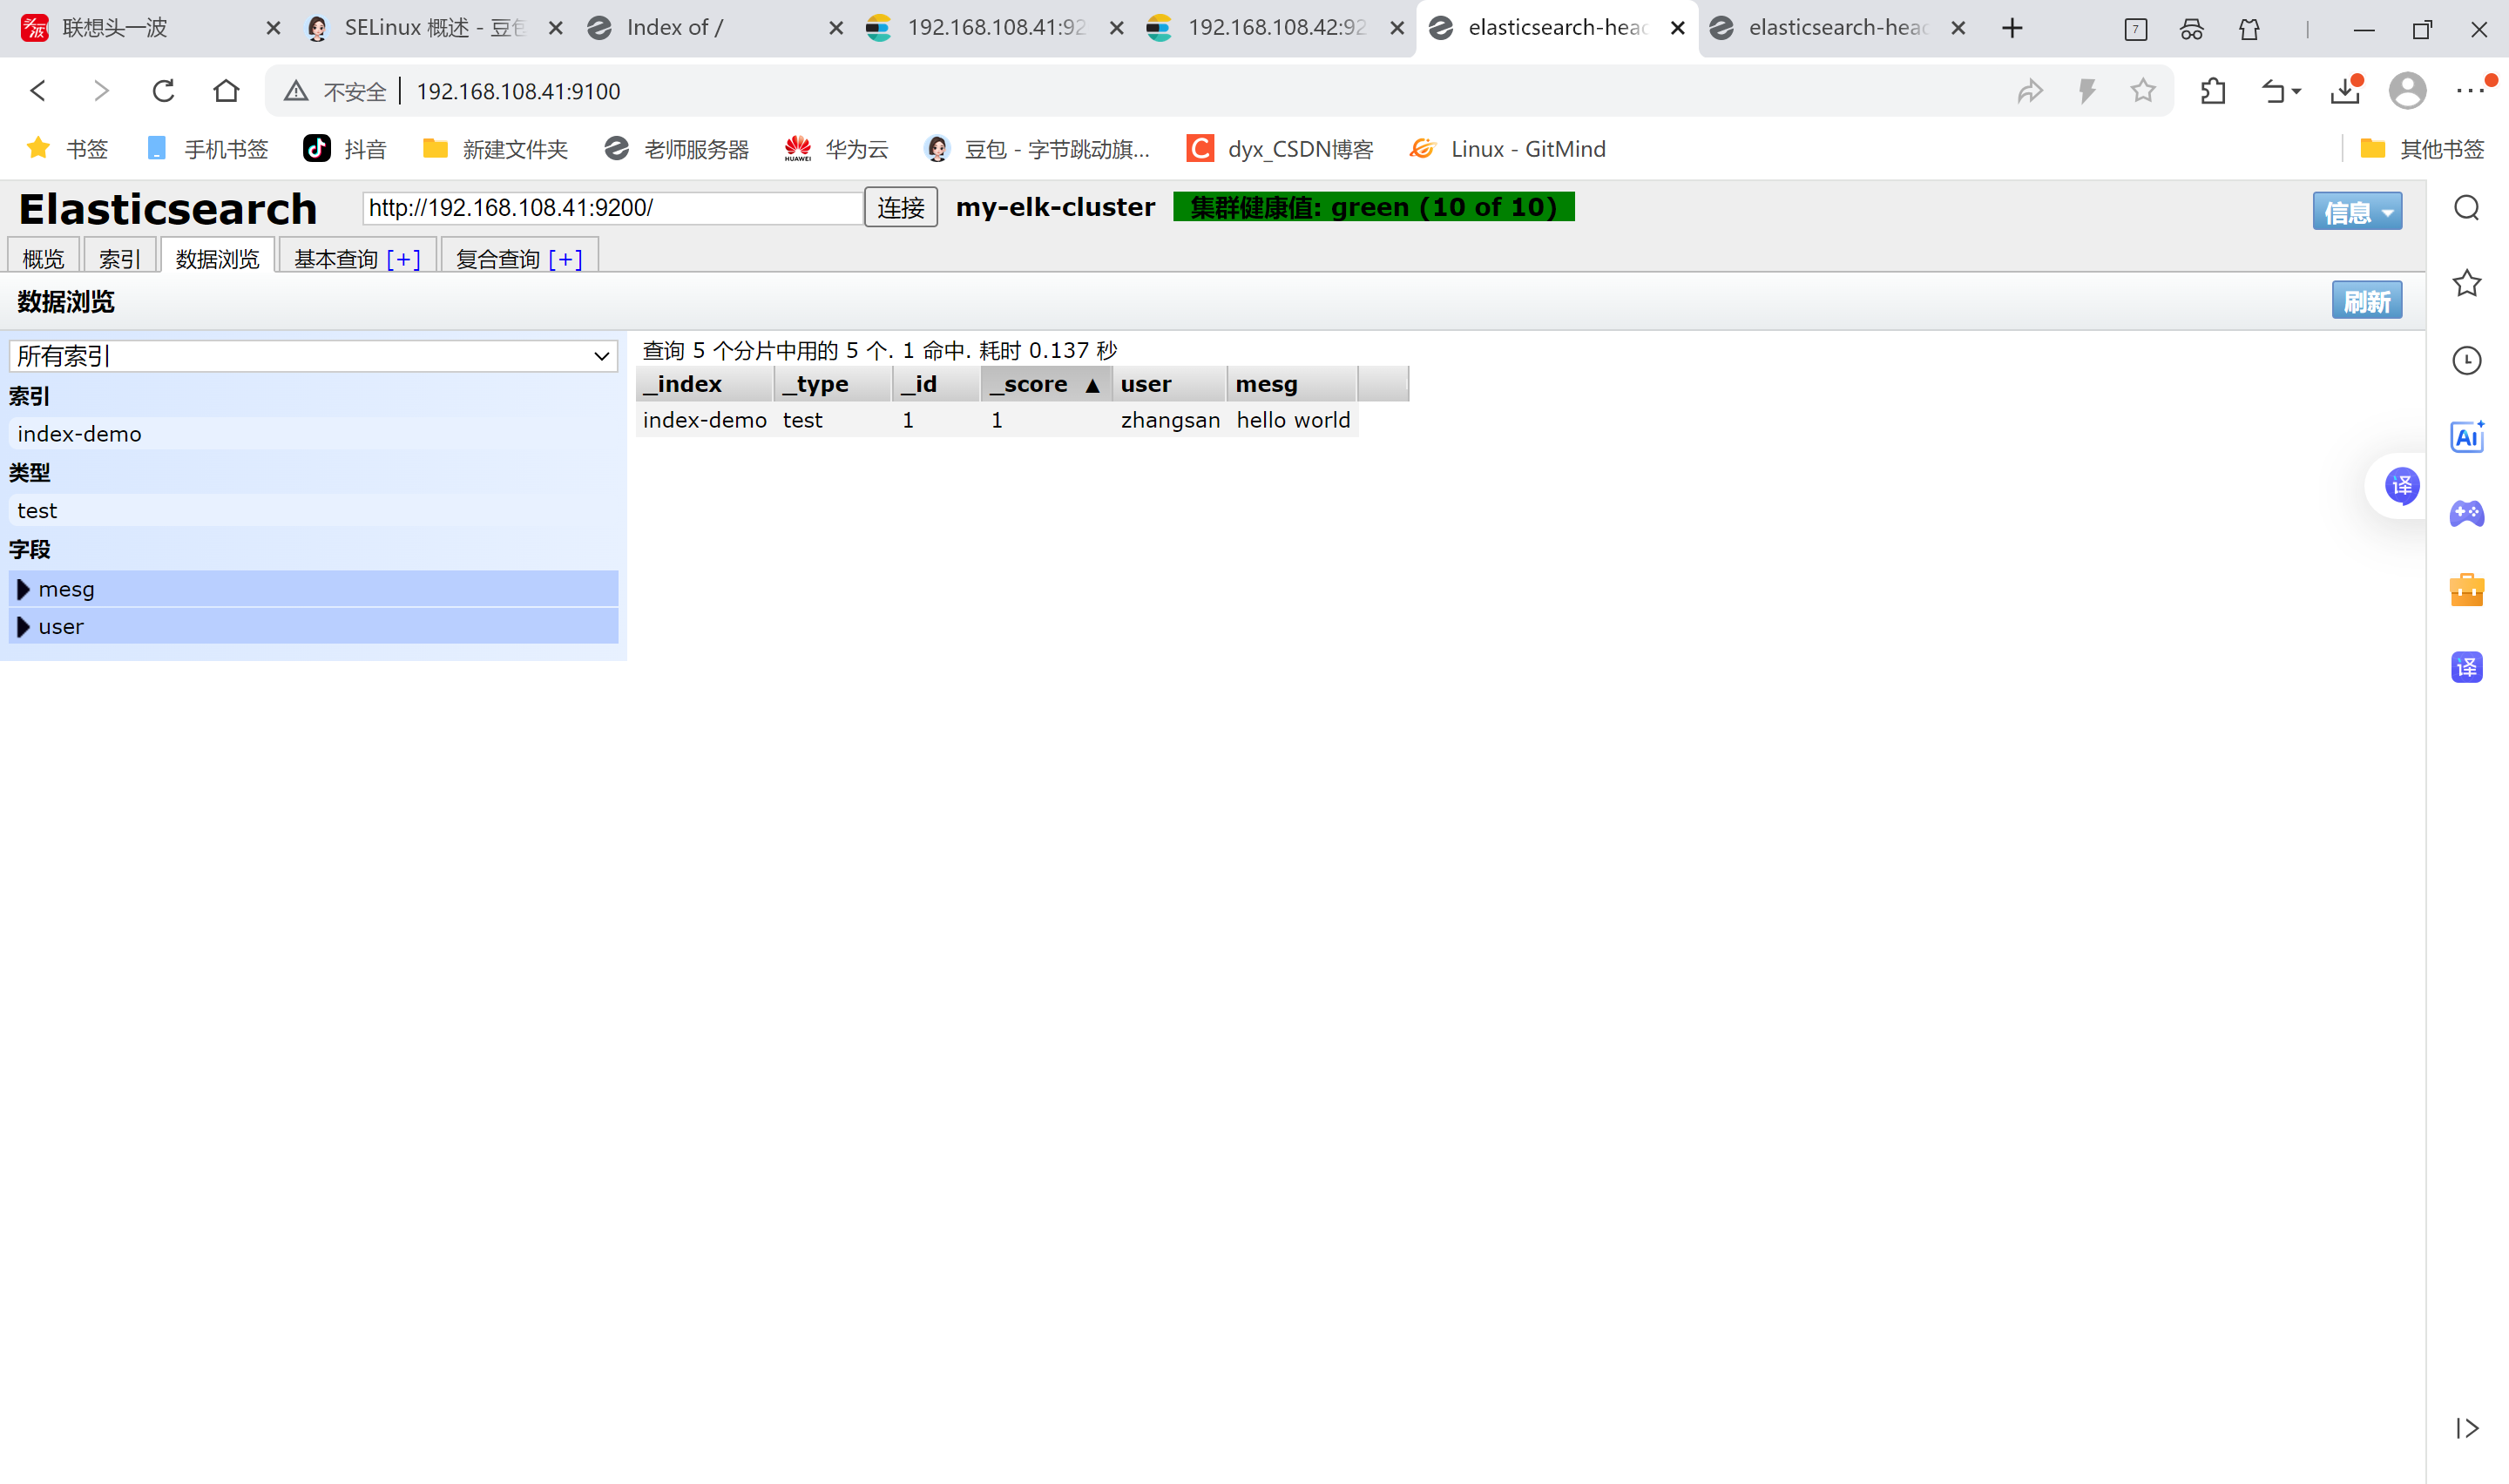
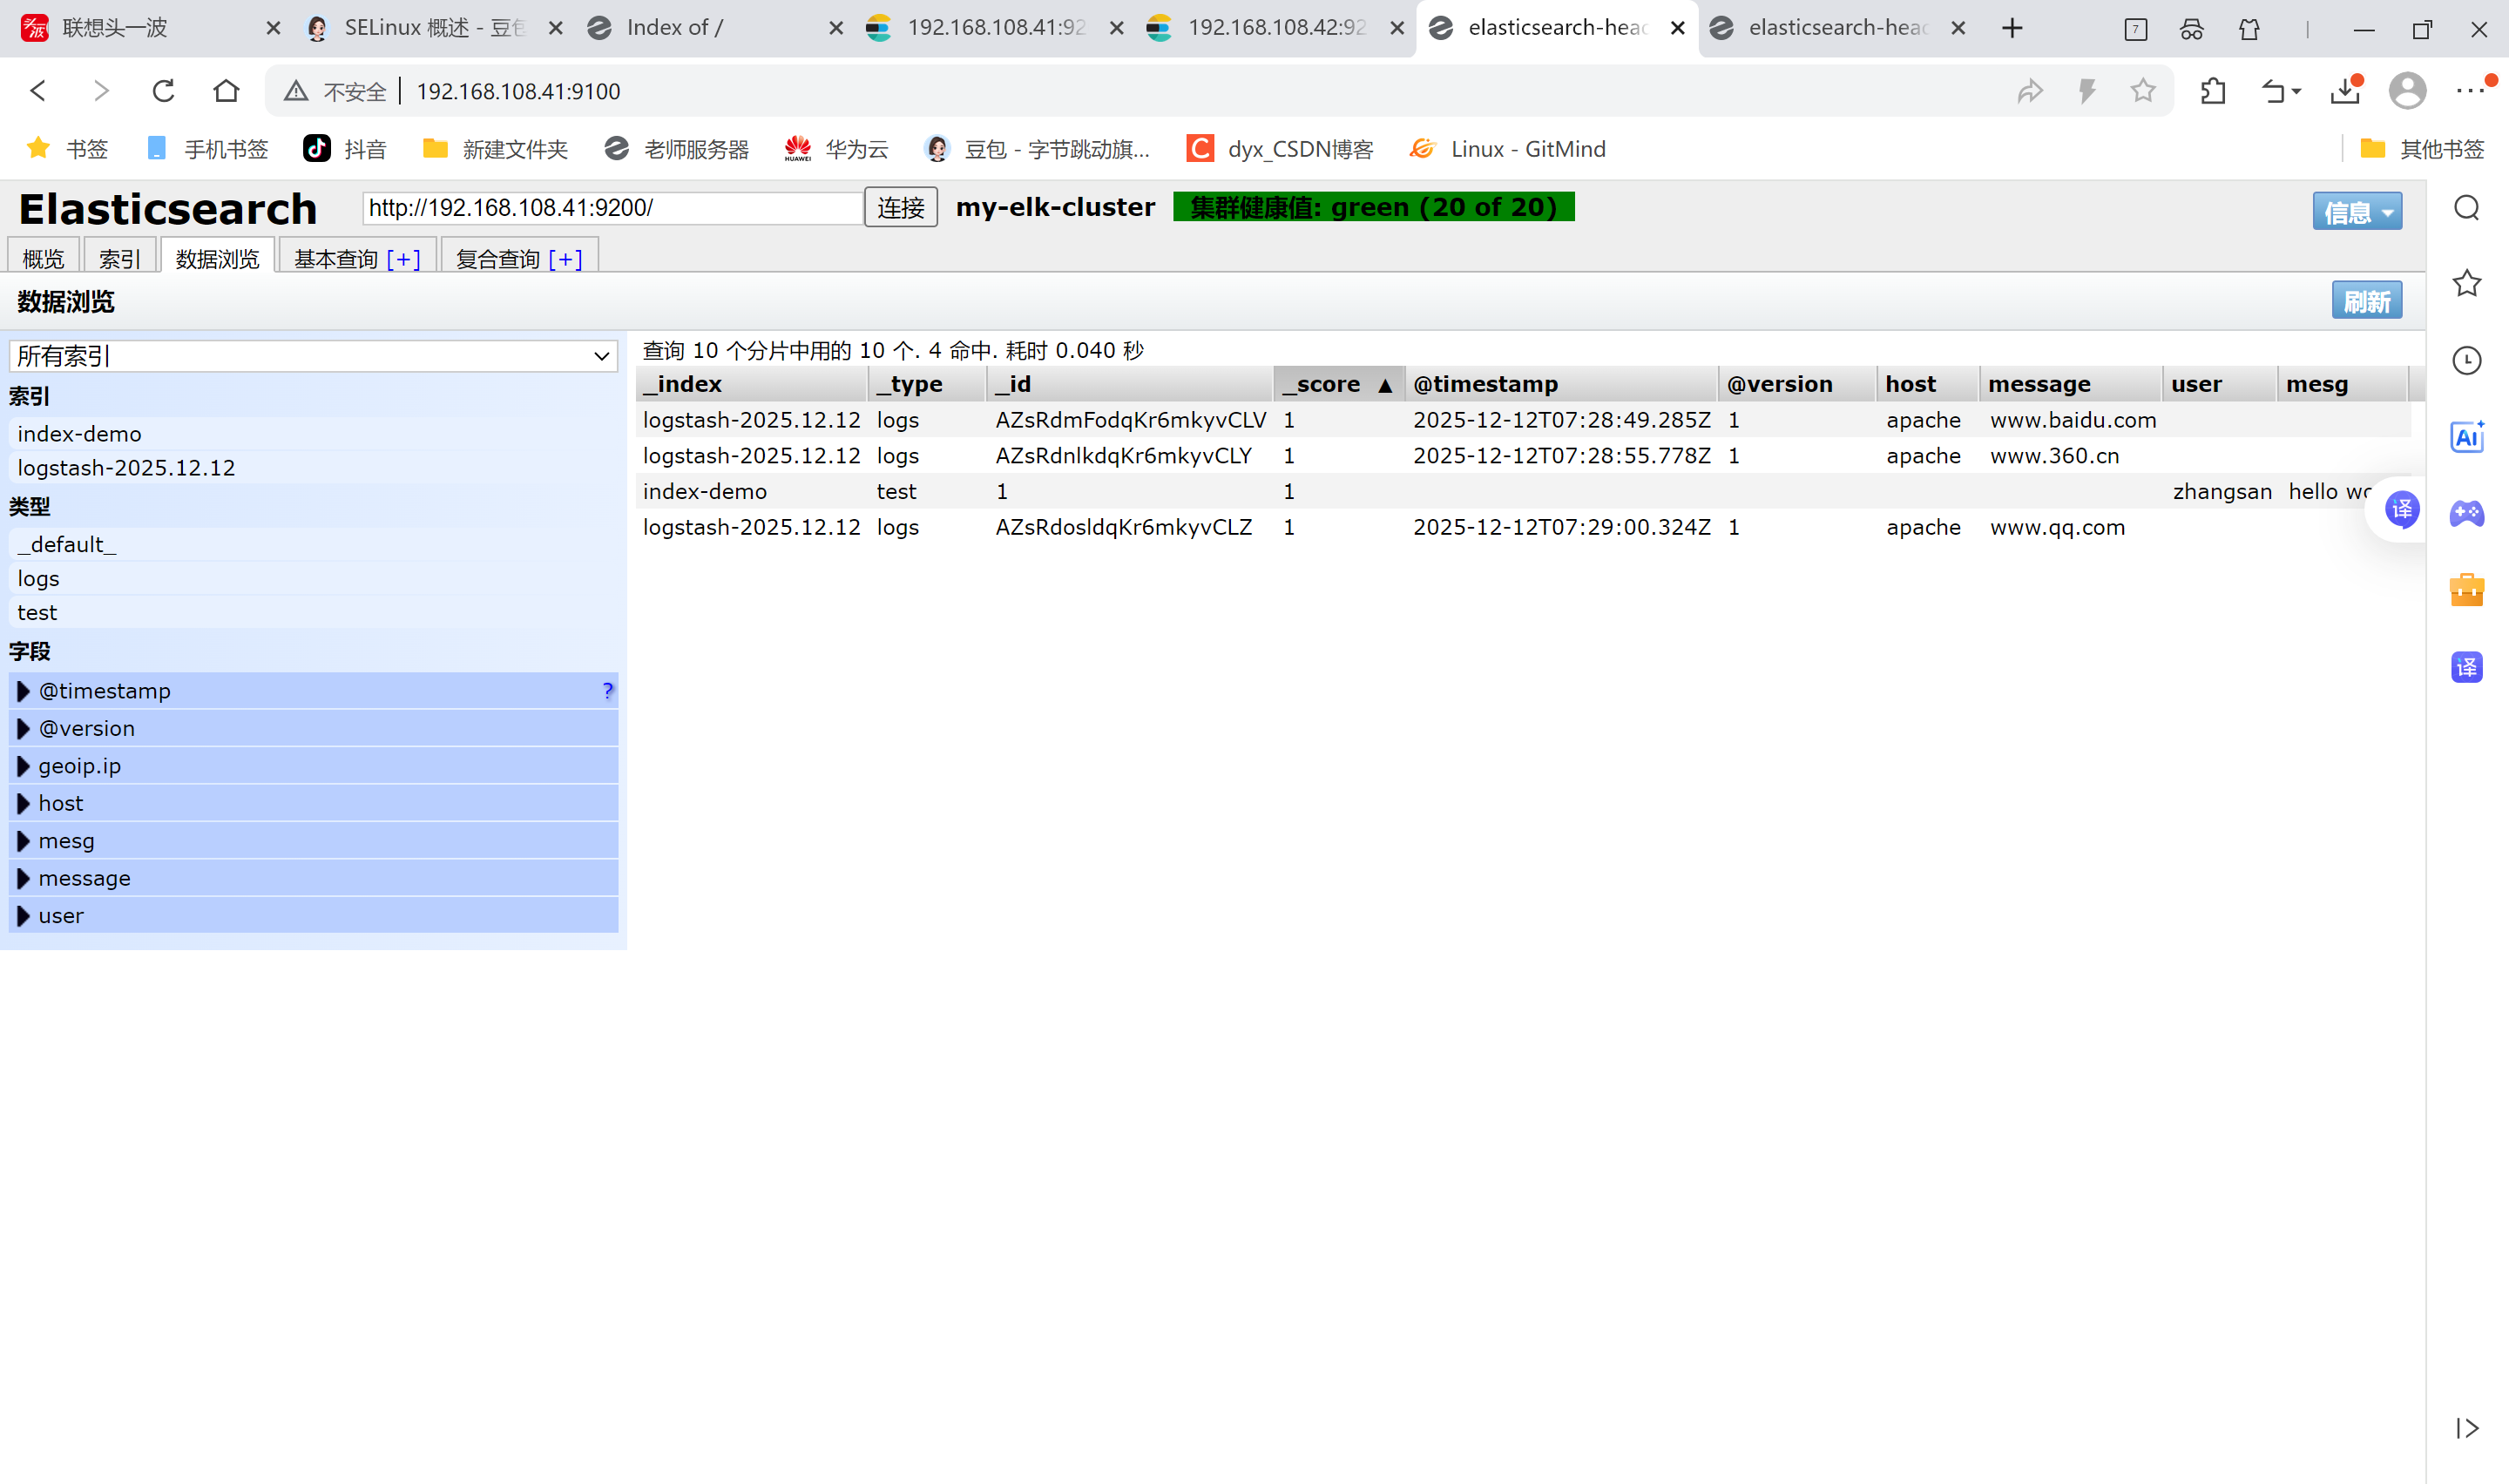
点击数据浏览可以看到存储的数据
点击数据浏览--会发现在node1上创建的索引为index-demo,类型为test, 相关的信息
4.安装logstash
用作日志搜集输出到elasticsearch中
登录主机192.168.108.43,关闭防火墙关闭核心防护
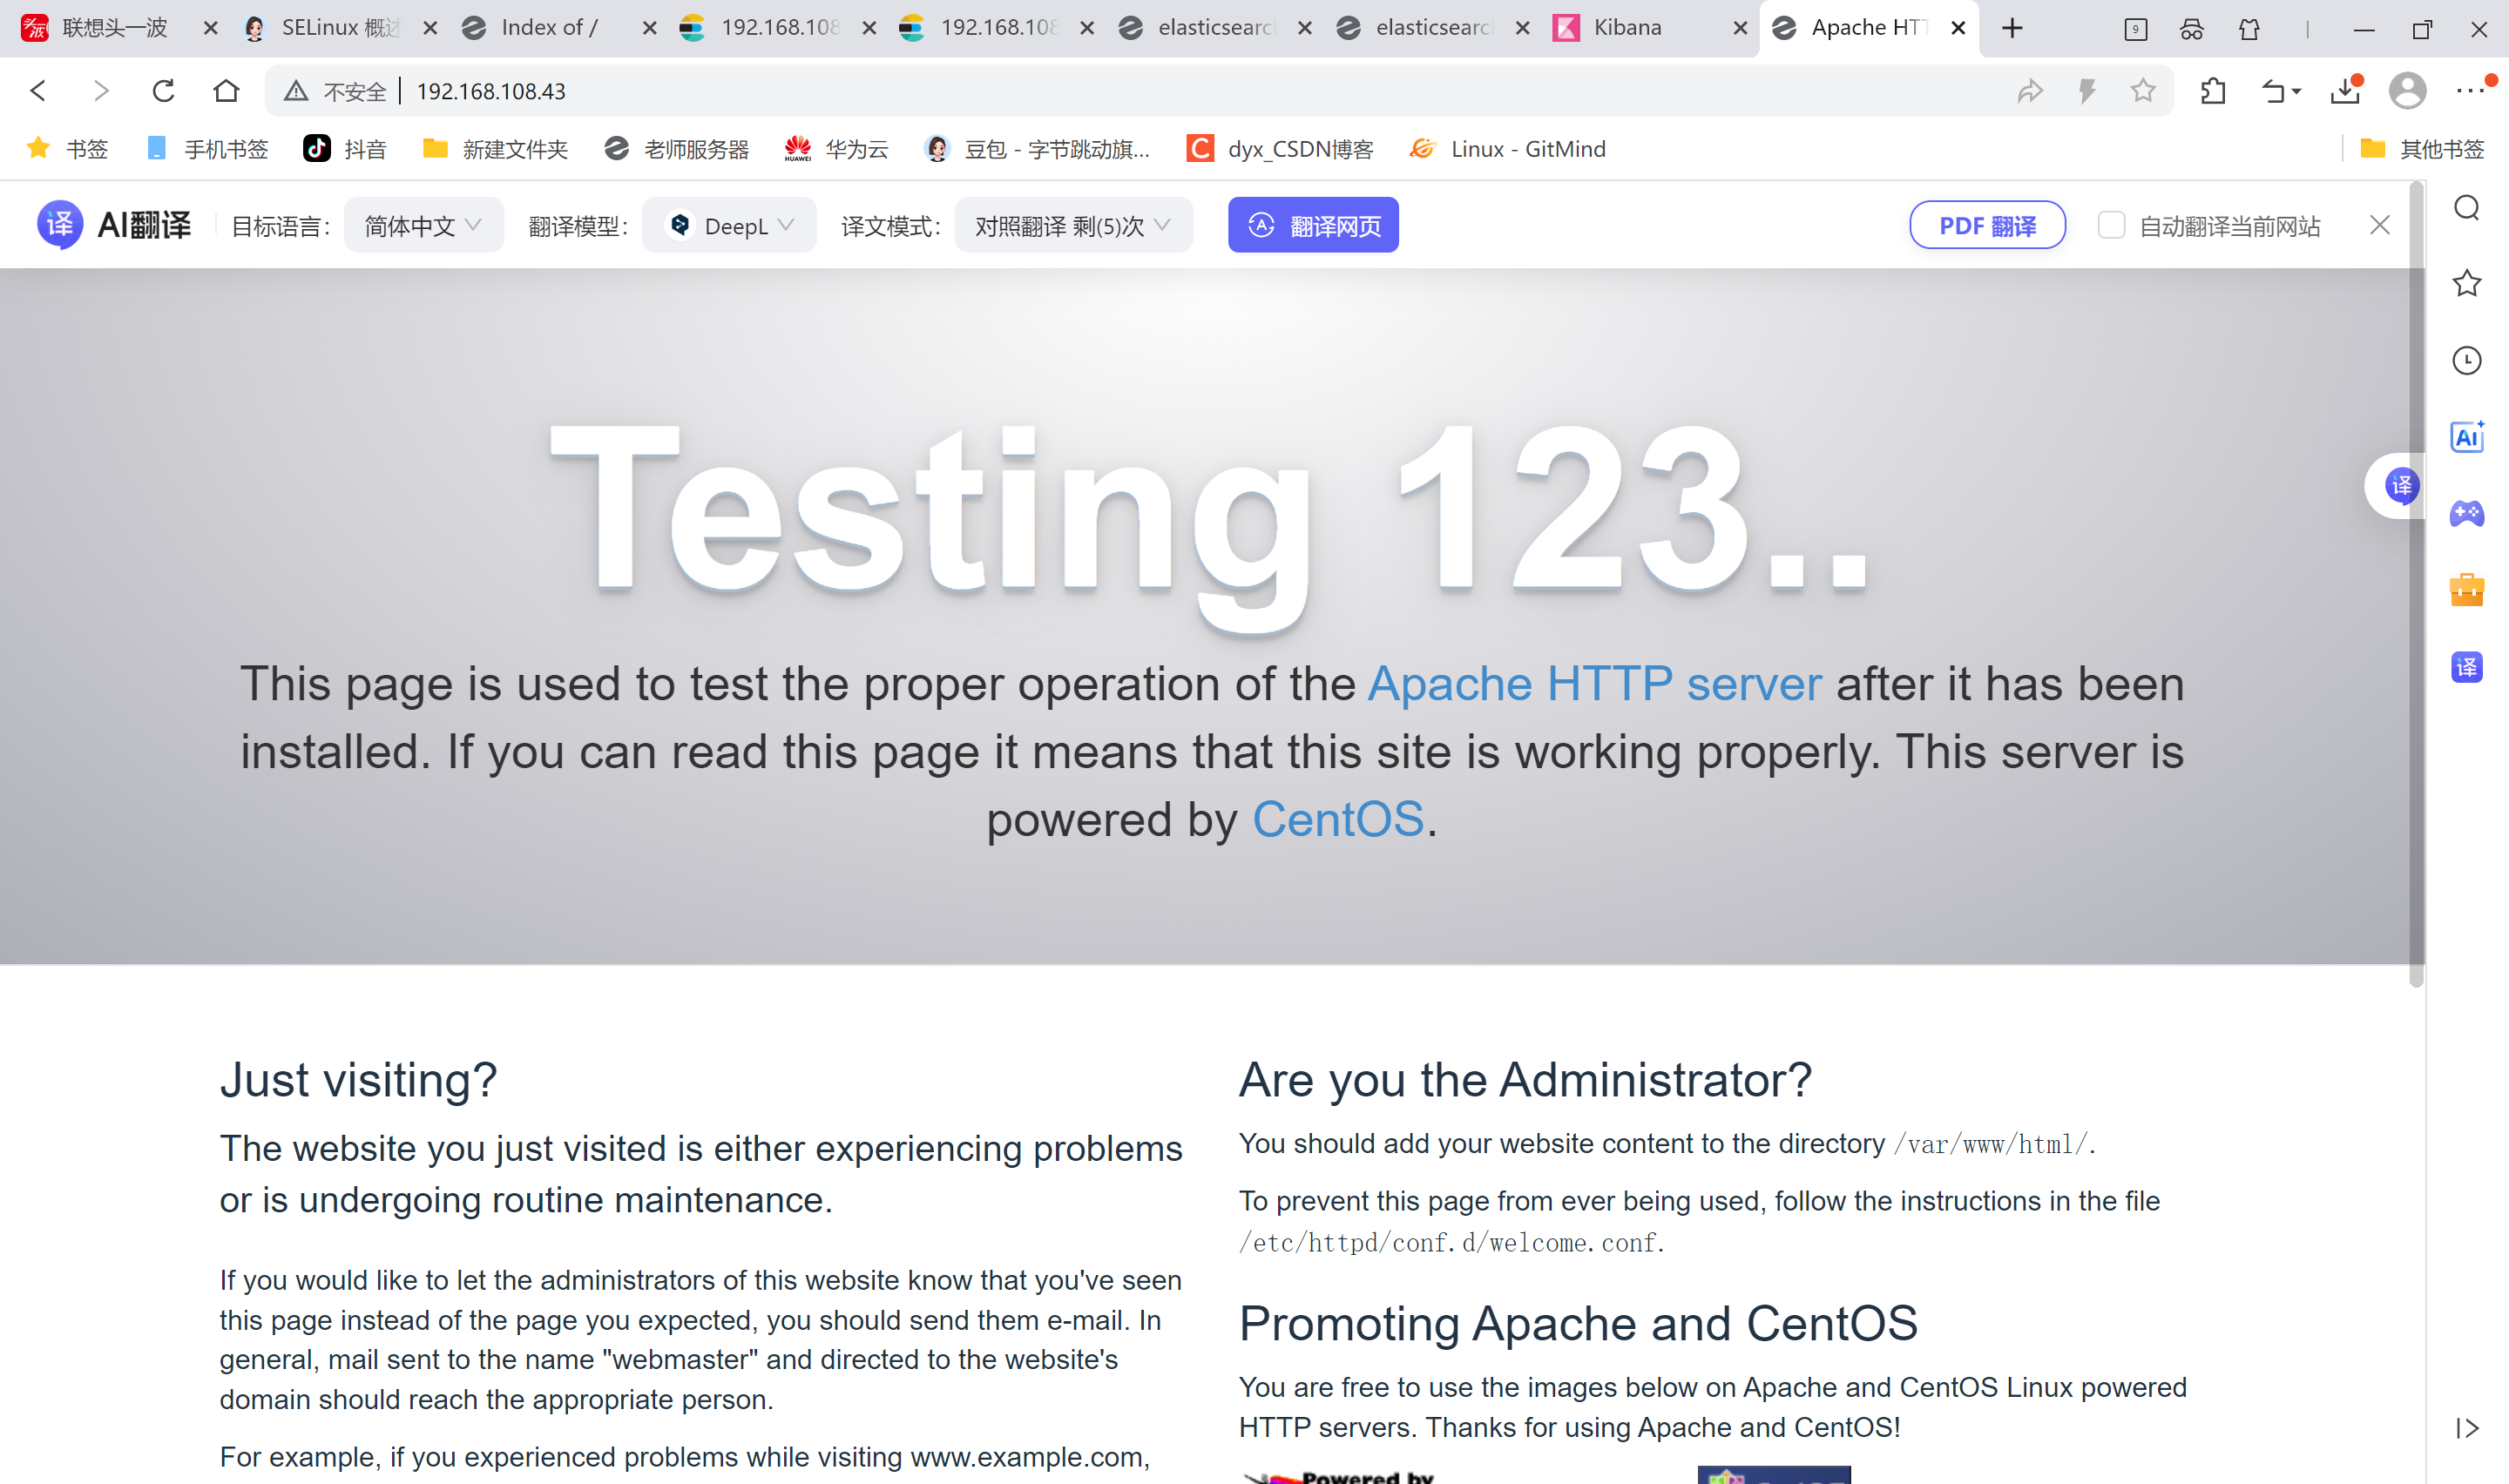
安装Apahce服务(httpd)
bash
[root@apache ~]# systemctl stop firewalld.service
[root@apache ~]# vim /etc/hosts
[root@apache ~]# yum install -y httpd
[root@apache ~]# systemctl start httpd

#访问下日志
[root@apache ~]# cd /var/log/httpd/
[root@apache httpd]# ls
access_log error_log
# access_log 访问日志
# error_log 错误日志
安装Java环境
bash
[root@apache ~]# java -version
openjdk version "1.8.0_262"
OpenJDK Runtime Environment (build 1.8.0_262-b10)
OpenJDK 64-Bit Server VM (build 25.262-b10, mixed mode)
安装logstash
上传logstash-5.5.1.rpm到/opt目录下
bash
[root@apache ~]# cd /opt

#安装logstash
[root@apache opt]# rpm -ivh logstash-5.5.1.rpm
warning: logstash-5.5.1.rpm: Header V4 RSA/SHA512 Signature, key ID d88e42b4: NOKEY
Preparing...                          ################################# [100%]
Updating / installing...
   1:logstash-1:5.5.1-1               ################################# [100%]
Using provided startup.options file: /etc/logstash/startup.options
Successfully created system startup script for Logstash

#启动logstash
[root@apache opt]# systemctl enable  logstash.service  --now
Created symlink from /etc/systemd/system/multi-user.target.wants/logstash.service to /etc/systemd/system/logstash.service.

#建立logstash软连接
[root@apache opt]# ln -s /usr/share/logstash/bin/logstash /usr/local/bin/
logstash(apache节点)与elasticsearch(node节点)做对接测试
Logstash这个命令测试
字段描述解释:
● -f 通过这个选项可以指定logstash的配置文件,根据配置文件配置logstash
● -e 后面跟着字符串 该字符串可以被当做logstash的配置(如果是" ",则默认使用stdin做为输入、stdout作为输出)
● -t 测试配置文件是否正确,然后退出
登录192.168.108.43 在Apache服务器上,输入采用标准输入 输出采用标准输出
bash
[root@apache opt]# logstash -e 'input { stdin{} } output { stdout{} }'
#正常 JAVA的东西
ERROR StatusLogger No log4j2 configuration file found. Using default configuration: logging only errors to the console.
WARNING: Could not find logstash.yml which is typically located in $LS_HOME/config or /etc/logstash. You can specify the path using --path.settings. Continuing using the defaults
Could not find log4j2 configuration at path //usr/share/logstash/config/log4j2.properties. Using default config which logs to console
15:25:55.980 [main] INFO  logstash.setting.writabledirectory - Creating directory {:setting=>"path.queue", :path=>"/usr/share/logstash/data/queue"}
15:25:55.987 [main] INFO  logstash.setting.writabledirectory - Creating directory {:setting=>"path.dead_letter_queue", :path=>"/usr/share/logstash/data/dead_letter_queue"}
15:25:56.033 [LogStash::Runner] INFO  logstash.agent - No persistent UUID file found. Generating new UUID {:uuid=>"5b578ab0-5aea-4e59-bd6a-65687f1d7ab4", :path=>"/usr/share/logstash/data/uuid"}
15:25:56.239 [[main]-pipeline-manager] INFO  logstash.pipeline - Starting pipeline {"id"=>"main", "pipeline.workers"=>4, "pipeline.batch.size"=>125, "pipeline.batch.delay"=>5, "pipeline.max_inflight"=>500}
15:25:56.303 [[main]-pipeline-manager] INFO  logstash.pipeline - Pipeline main started
The stdin plugin is now waiting for input:
15:25:56.399 [Api Webserver] INFO  logstash.agent - Successfully started Logstash API endpoint {:port=>9600}
#需要输入www.baidu.com
www.baidu.com
2025-12-12T07:26:07.015Z apache www.baidu.com
#需要输入www.sina.com
www.sina.com.cn
2025-12-12T07:26:16.322Z apache www.sina.com.cn
^C#ctrl_c退出
15:26:18.710 [SIGINT handler] WARN  logstash.runner - SIGINT received. Shutting down the agent.
15:26:18.723 [LogStash::Runner] WARN  logstash.agent - stopping pipeline {:id=>"main"}
使用rubydebug显示详细输出,codec为一种编解码器
bash
[root@apache opt]# logstash -e 'input { stdin{} } output { stdout{ codec=>rubydebug} }'
ERROR StatusLogger No log4j2 configuration file found. Using default configuration: logging only errors to the console.
WARNING: Could not find logstash.yml which is typically located in $LS_HOME/config or /etc/logstash. You can specify the path using --path.settings. Continuing using the defaults
Could not find log4j2 configuration at path //usr/share/logstash/config/log4j2.properties. Using default config which logs to console
15:27:41.867 [[main]-pipeline-manager] INFO  logstash.pipeline - Starting pipeline {"id"=>"main", "pipeline.workers"=>4, "pipeline.batch.size"=>125, "pipeline.batch.delay"=>5, "pipeline.max_inflight"=>500}
15:27:41.971 [[main]-pipeline-manager] INFO  logstash.pipeline - Pipeline main started
The stdin plugin is now waiting for input:
15:27:42.066 [Api Webserver] INFO  logstash.agent - Successfully started Logstash API endpoint {:port=>9600}
#需要输入www.baidu.com
www.baidu.com
{
    "@timestamp" => 2025-12-12T07:27:55.422Z,
      "@version" => "1",
          "host" => "apache",
       "message" => "www.baidu.com"
}
^C#ctrl_c退出
15:27:59.220 [SIGINT handler] WARN  logstash.runner - SIGINT received. Shutting down the agent.
15:27:59.269 [LogStash::Runner] WARN  logstash.agent - stopping pipeline {:id=>"main"}
使用logstash将信息写入elasticsearch中, 输入 输出 对接
bash
[root@apache opt]# logstash -e 'input { stdin{} } output { elasticsearch { hosts=>["192.168.108.41:9200"] } }'
ERROR StatusLogger No log4j2 configuration file found. Using default configuration: logging only errors to the console.
WARNING: Could not find logstash.yml which is typically located in $LS_HOME/config or /etc/logstash. You can specify the path using --path.settings. Continuing using the defaults
Could not find log4j2 configuration at path //usr/share/logstash/config/log4j2.properties. Using default config which logs to console
15:28:40.014 [[main]-pipeline-manager] INFO  logstash.outputs.elasticsearch - Elasticsearch pool URLs updated {:changes=>{:removed=>[], :added=>[http://192.168.108.41:9200/]}}
15:28:40.018 [[main]-pipeline-manager] INFO  logstash.outputs.elasticsearch - Running health check to see if an Elasticsearch connection is working {:healthcheck_url=>http://192.168.108.41:9200/, :path=>"/"}
15:28:40.148 [[main]-pipeline-manager] WARN  logstash.outputs.elasticsearch - Restored connection to ES instance {:url=>#<Java::JavaNet::URI:0x15b92e86>}
15:28:40.152 [[main]-pipeline-manager] INFO  logstash.outputs.elasticsearch - Using mapping template from {:path=>nil}
15:28:40.384 [[main]-pipeline-manager] INFO  logstash.outputs.elasticsearch - Attempting to install template {:manage_template=>{"template"=>"logstash-*", "version"=>50001, "settings"=>{"index.refresh_interval"=>"5s"}, "mappings"=>{"_default_"=>{"_all"=>{"enabled"=>true, "norms"=>false}, "dynamic_templates"=>[{"message_field"=>{"path_match"=>"message", "match_mapping_type"=>"string", "mapping"=>{"type"=>"text", "norms"=>false}}}, {"string_fields"=>{"match"=>"*", "match_mapping_type"=>"string", "mapping"=>{"type"=>"text", "norms"=>false, "fields"=>{"keyword"=>{"type"=>"keyword", "ignore_above"=>256}}}}}], "properties"=>{"@timestamp"=>{"type"=>"date", "include_in_all"=>false}, "@version"=>{"type"=>"keyword", "include_in_all"=>false}, "geoip"=>{"dynamic"=>true, "properties"=>{"ip"=>{"type"=>"ip"}, "location"=>{"type"=>"geo_point"}, "latitude"=>{"type"=>"half_float"}, "longitude"=>{"type"=>"half_float"}}}}}}}}
15:28:40.432 [[main]-pipeline-manager] INFO  logstash.outputs.elasticsearch - Installing elasticsearch template to _template/logstash
15:28:40.700 [[main]-pipeline-manager] INFO  logstash.outputs.elasticsearch - New Elasticsearch output {:class=>"LogStash::Outputs::ElasticSearch", :hosts=>[#<Java::JavaNet::URI:0x6d280c11>]}
15:28:40.711 [[main]-pipeline-manager] INFO  logstash.pipeline - Starting pipeline {"id"=>"main", "pipeline.workers"=>4, "pipeline.batch.size"=>125, "pipeline.batch.delay"=>5, "pipeline.max_inflight"=>500}
15:28:40.865 [[main]-pipeline-manager] INFO  logstash.pipeline - Pipeline main started
The stdin plugin is now waiting for input:
15:28:40.971 [Api Webserver] INFO  logstash.agent - Successfully started Logstash API endpoint {:port=>9600}
#输入内容
www.baidu.com
www.360.cn
www.qq.com
^C15:29:03.094 [SIGINT handler] WARN  logstash.runner - SIGINT received. Shutting down the agent.
15:29:03.113 [LogStash::Runner] WARN  logstash.agent - stopping pipeline {:id=>"main"}
笔记本192.168.108.1 登陆
打开浏览器 输入http://192.168.108.41:9100/
多出 logstash-2025.12.12(没命名,自动用时间后缀
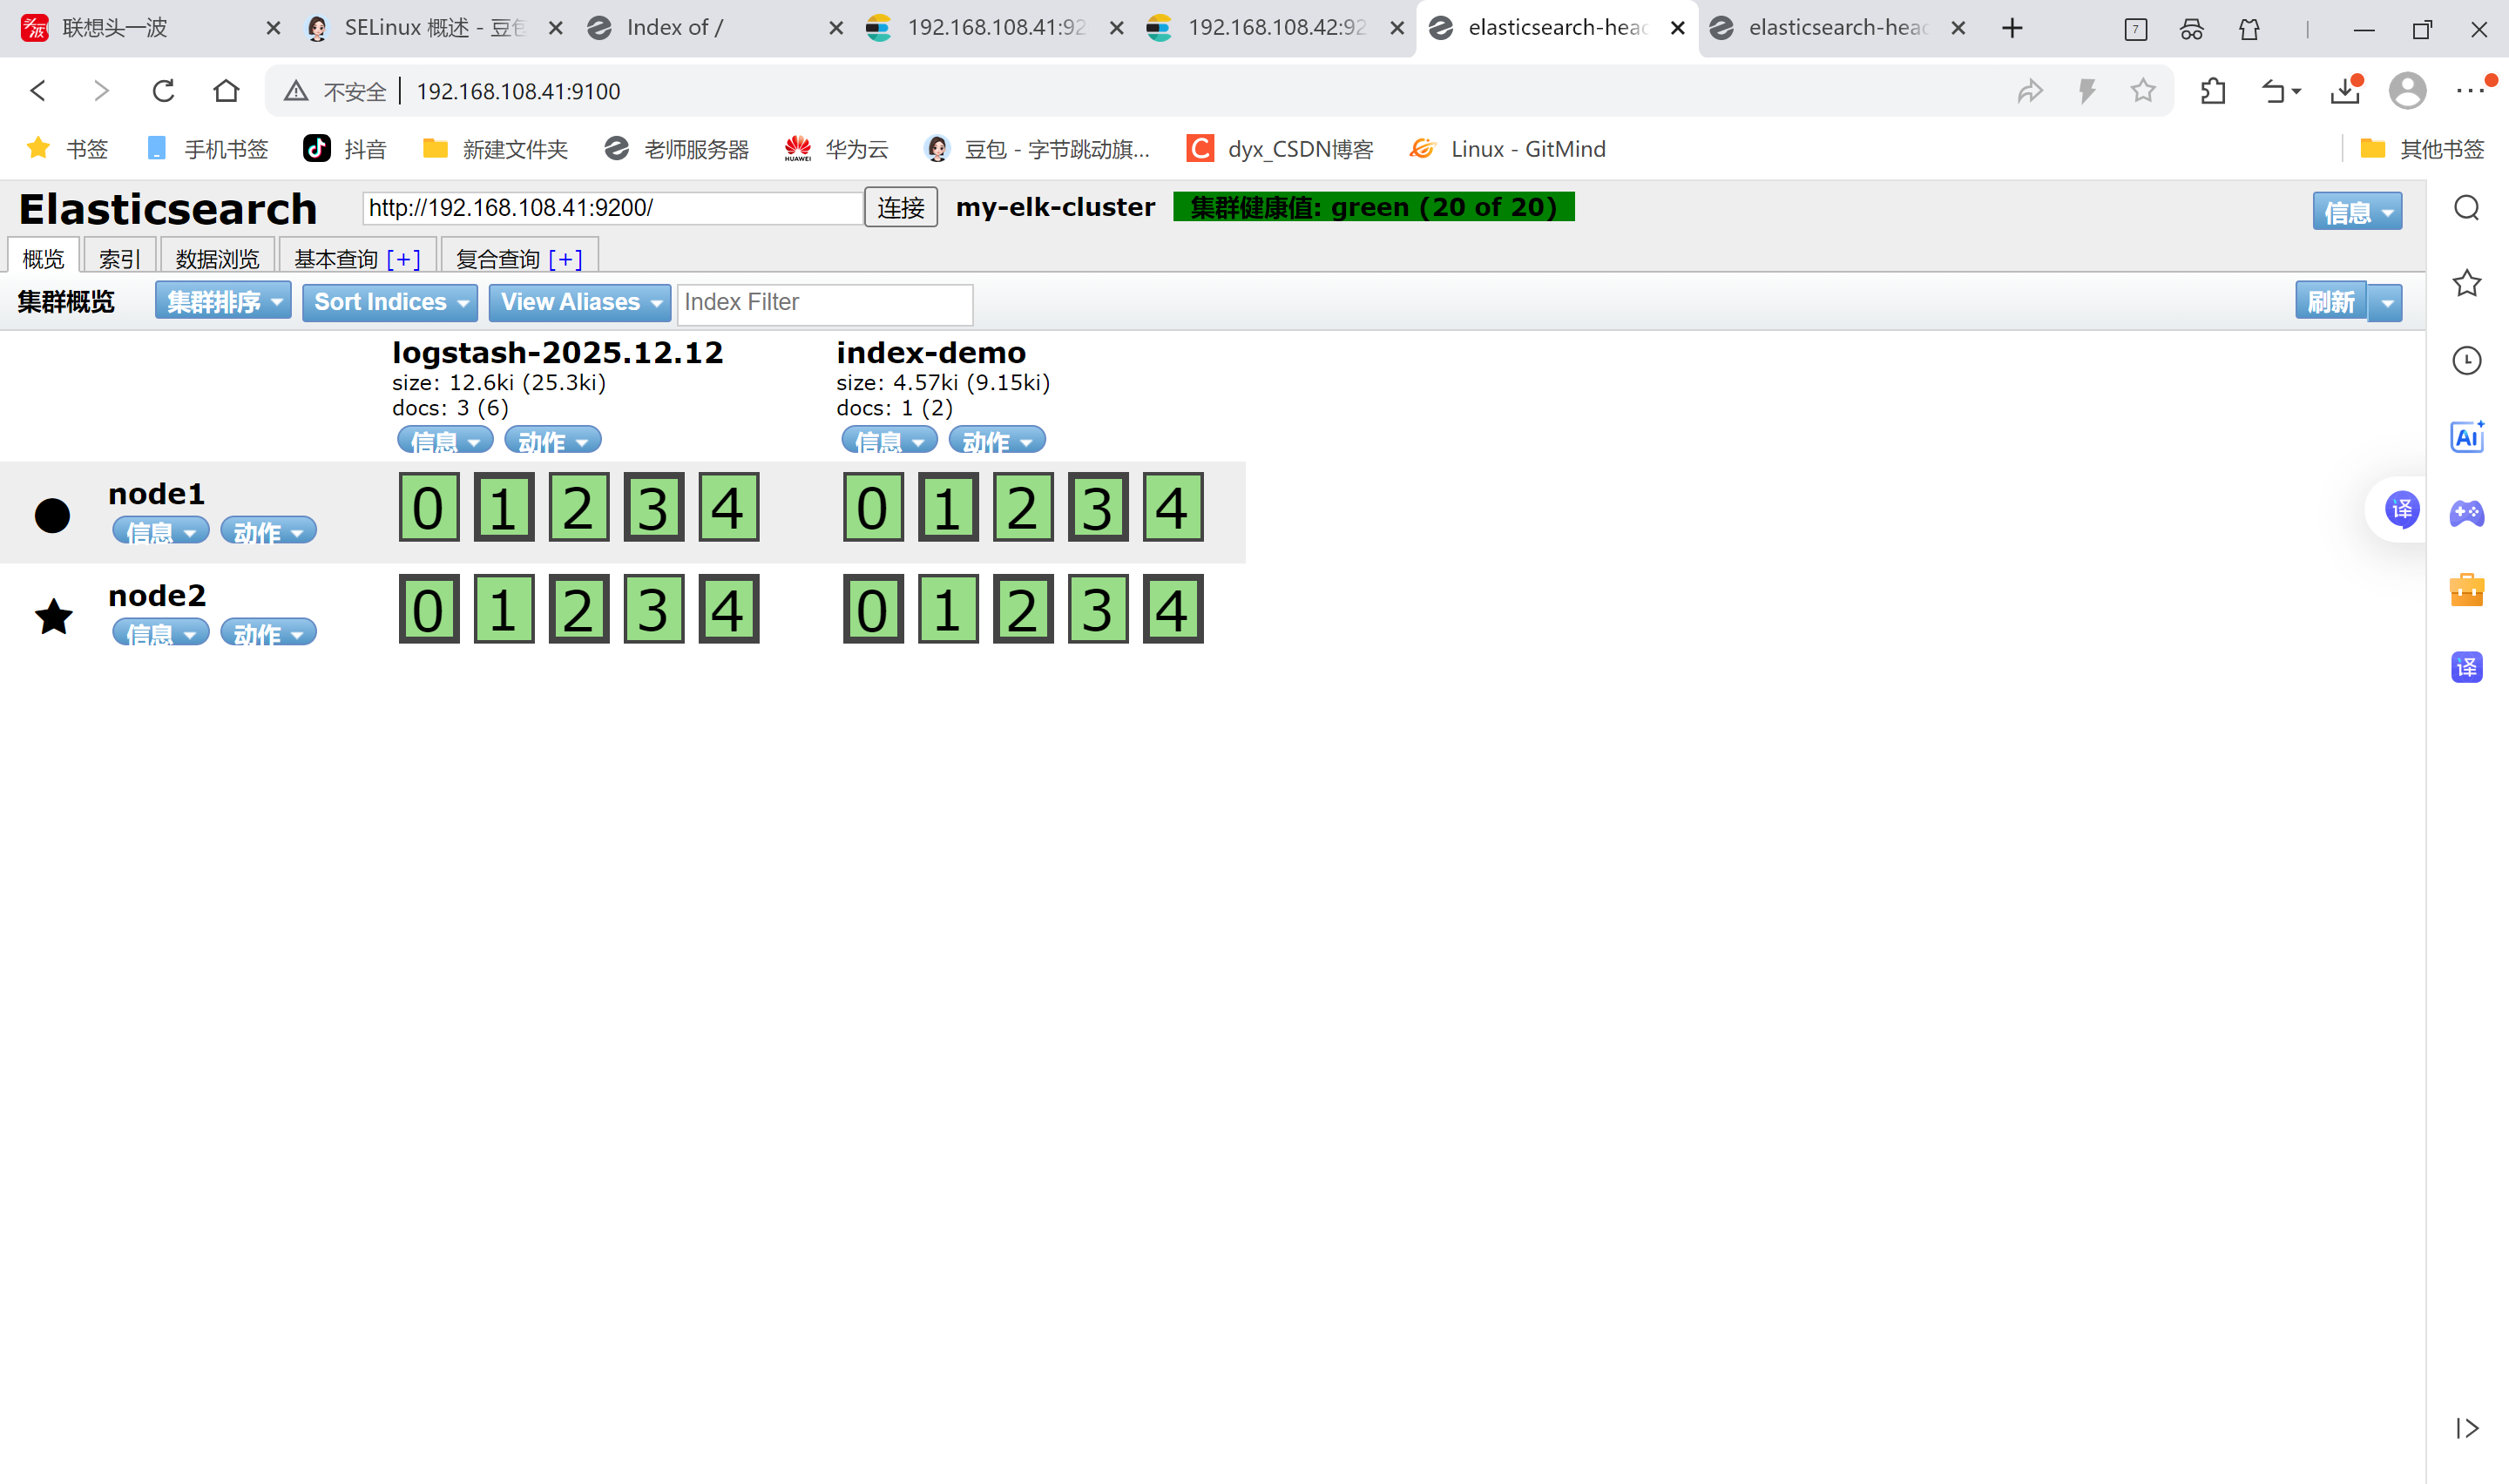
查看索引信息
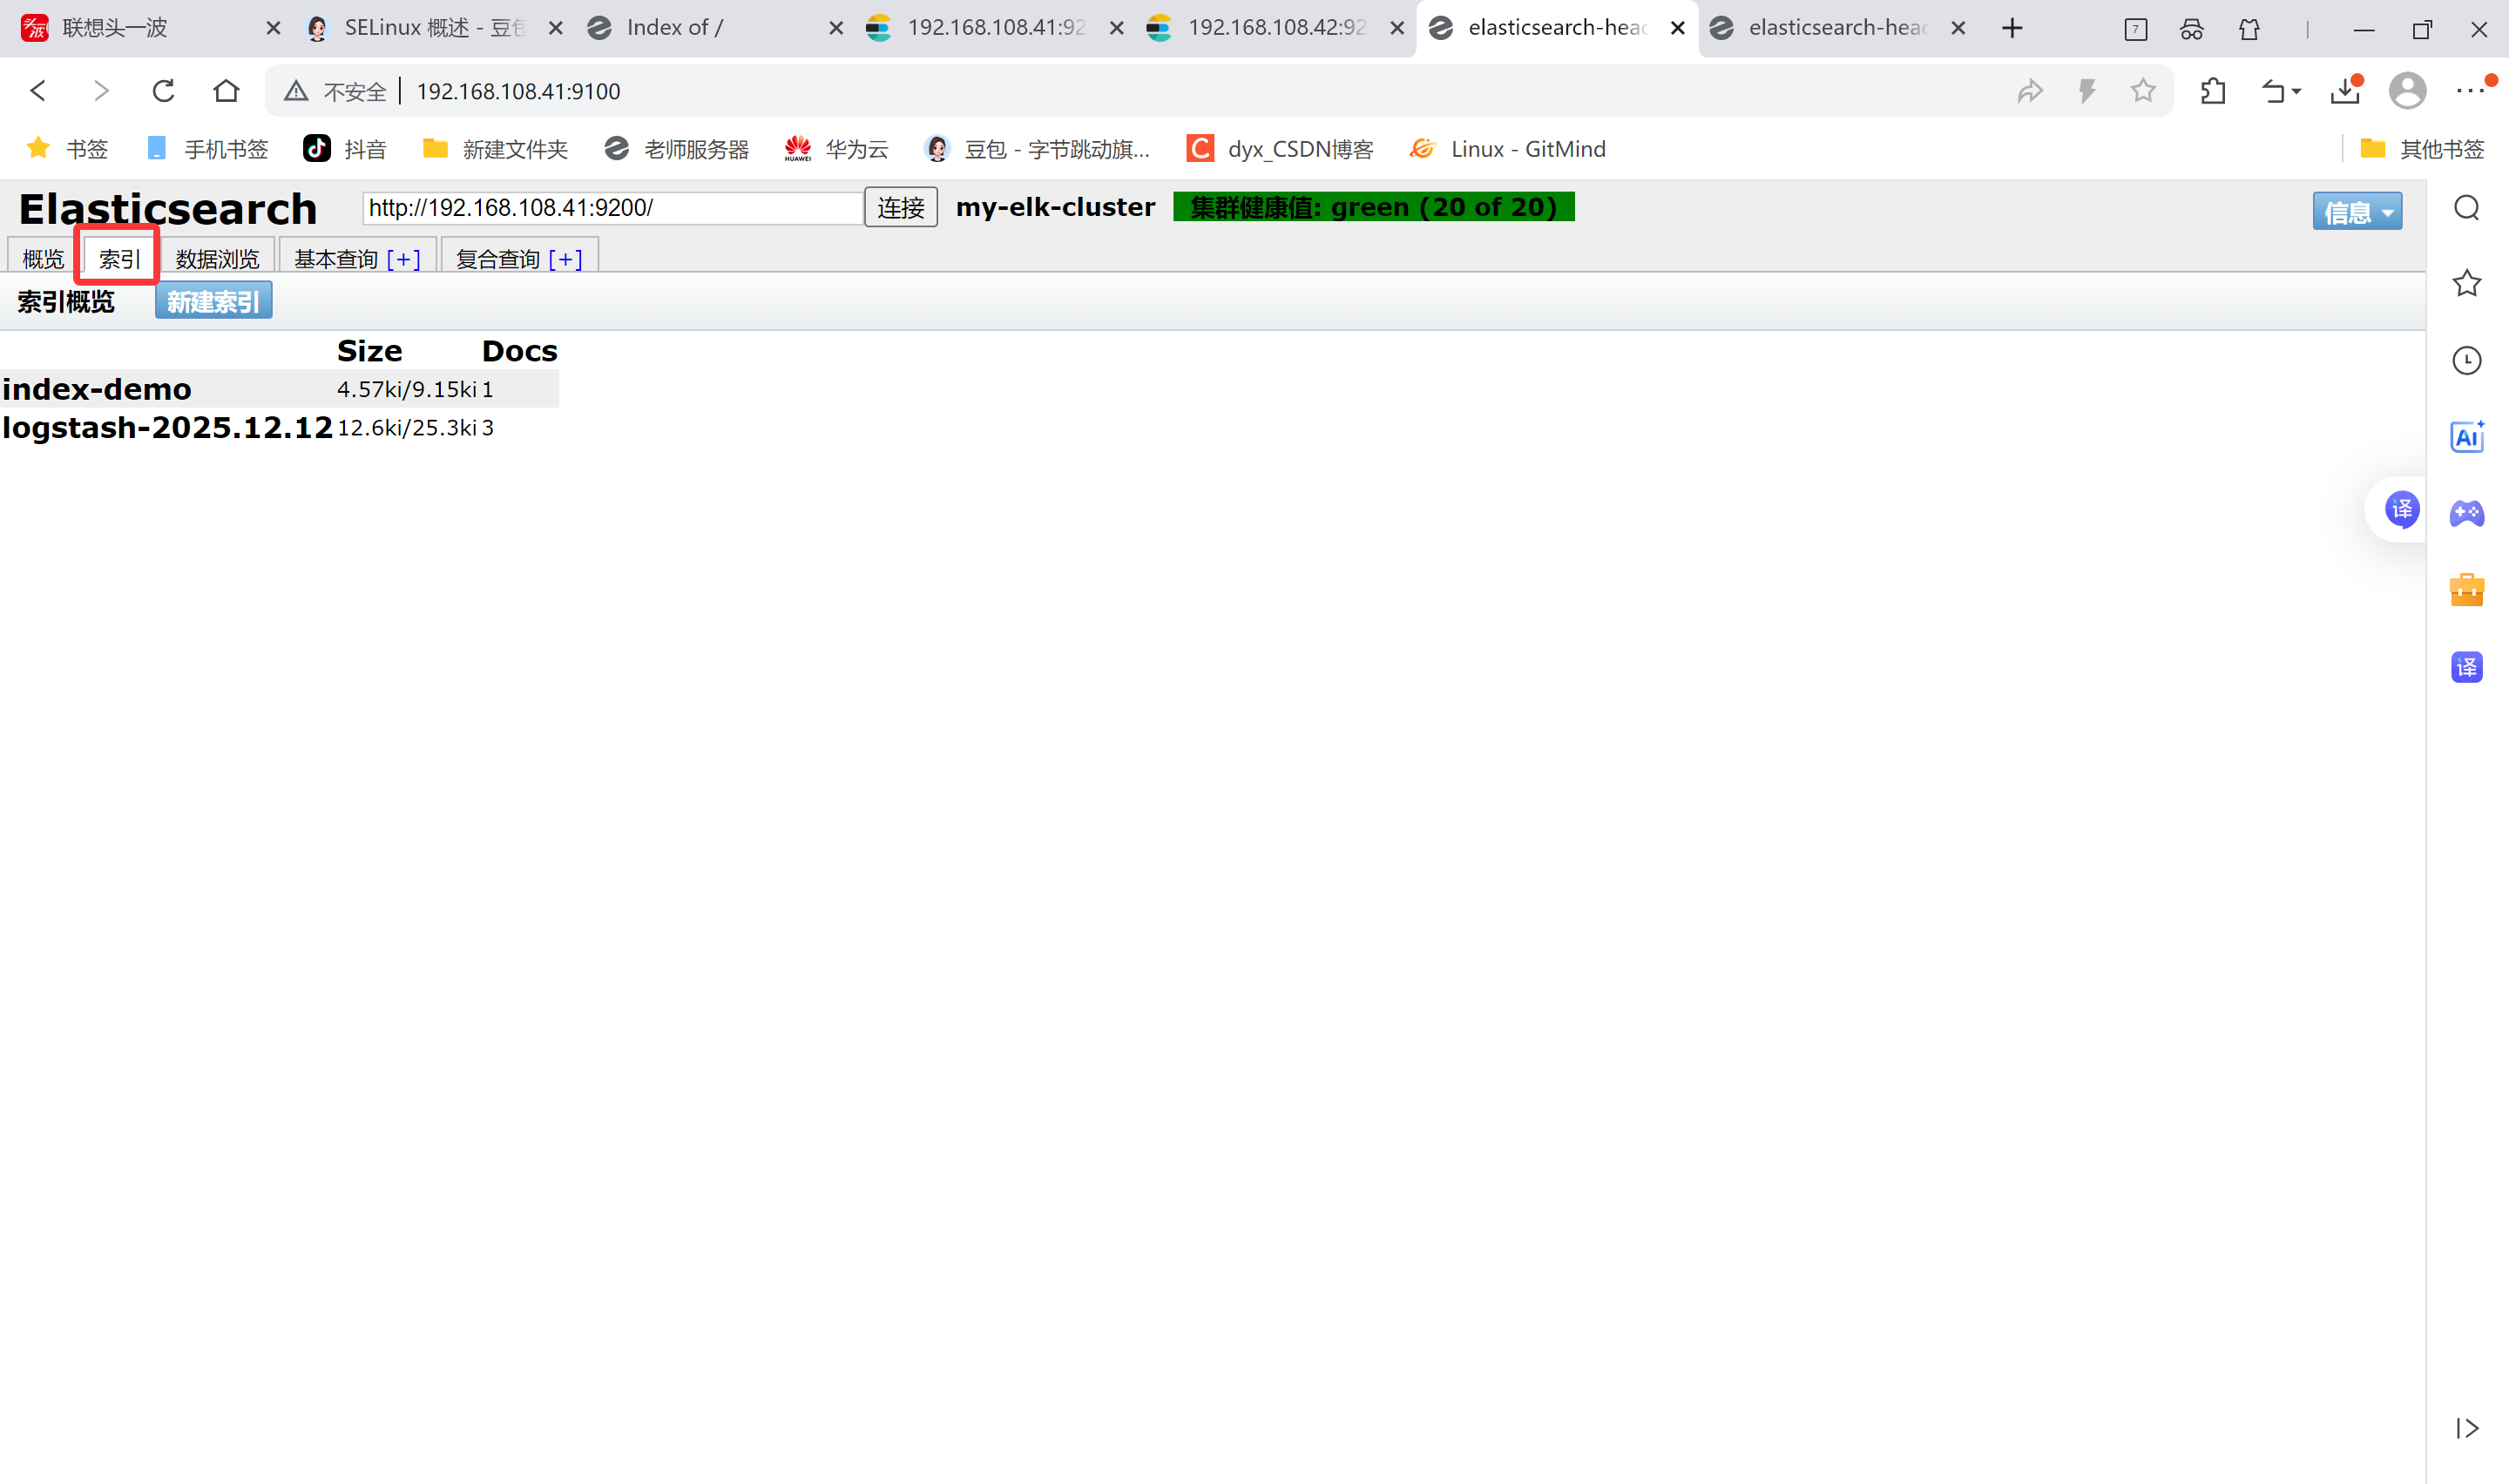
点击数浏览查看响应的内容
登录192.168.108.43 (Apache主机) 做对接配置
Logstash配置文件
Logstash配置文件主要由三部分组成:input、output、filter(根据需要)
bash
[root@apache ~]# chmod o+r /var/log/messages
[root@apache ~]# ll /var/log/messages
-rw----r--. 1 root root 856951 Dec 12 15:51 /var/log/messages

[root@apache ~]# vim /etc/logstash/conf.d/system.conf
[root@apache ~]# cat /etc/logstash/conf.d/system.conf
input {
       file{
        path => "/var/log/messages"
        type => "system"
        start_position => "beginning"
        }
      }
output {
        elasticsearch {
          hosts => ["192.168.108.41:9200"]
          index => "system-%{+YYYY.MM.dd}"
          }
        }

[root@apache ~]# systemctl restart logstash.service
笔记本打开浏览器 输入http://192.168.108.41:9100/ 查看索引信息
多出 system-2025.12.12
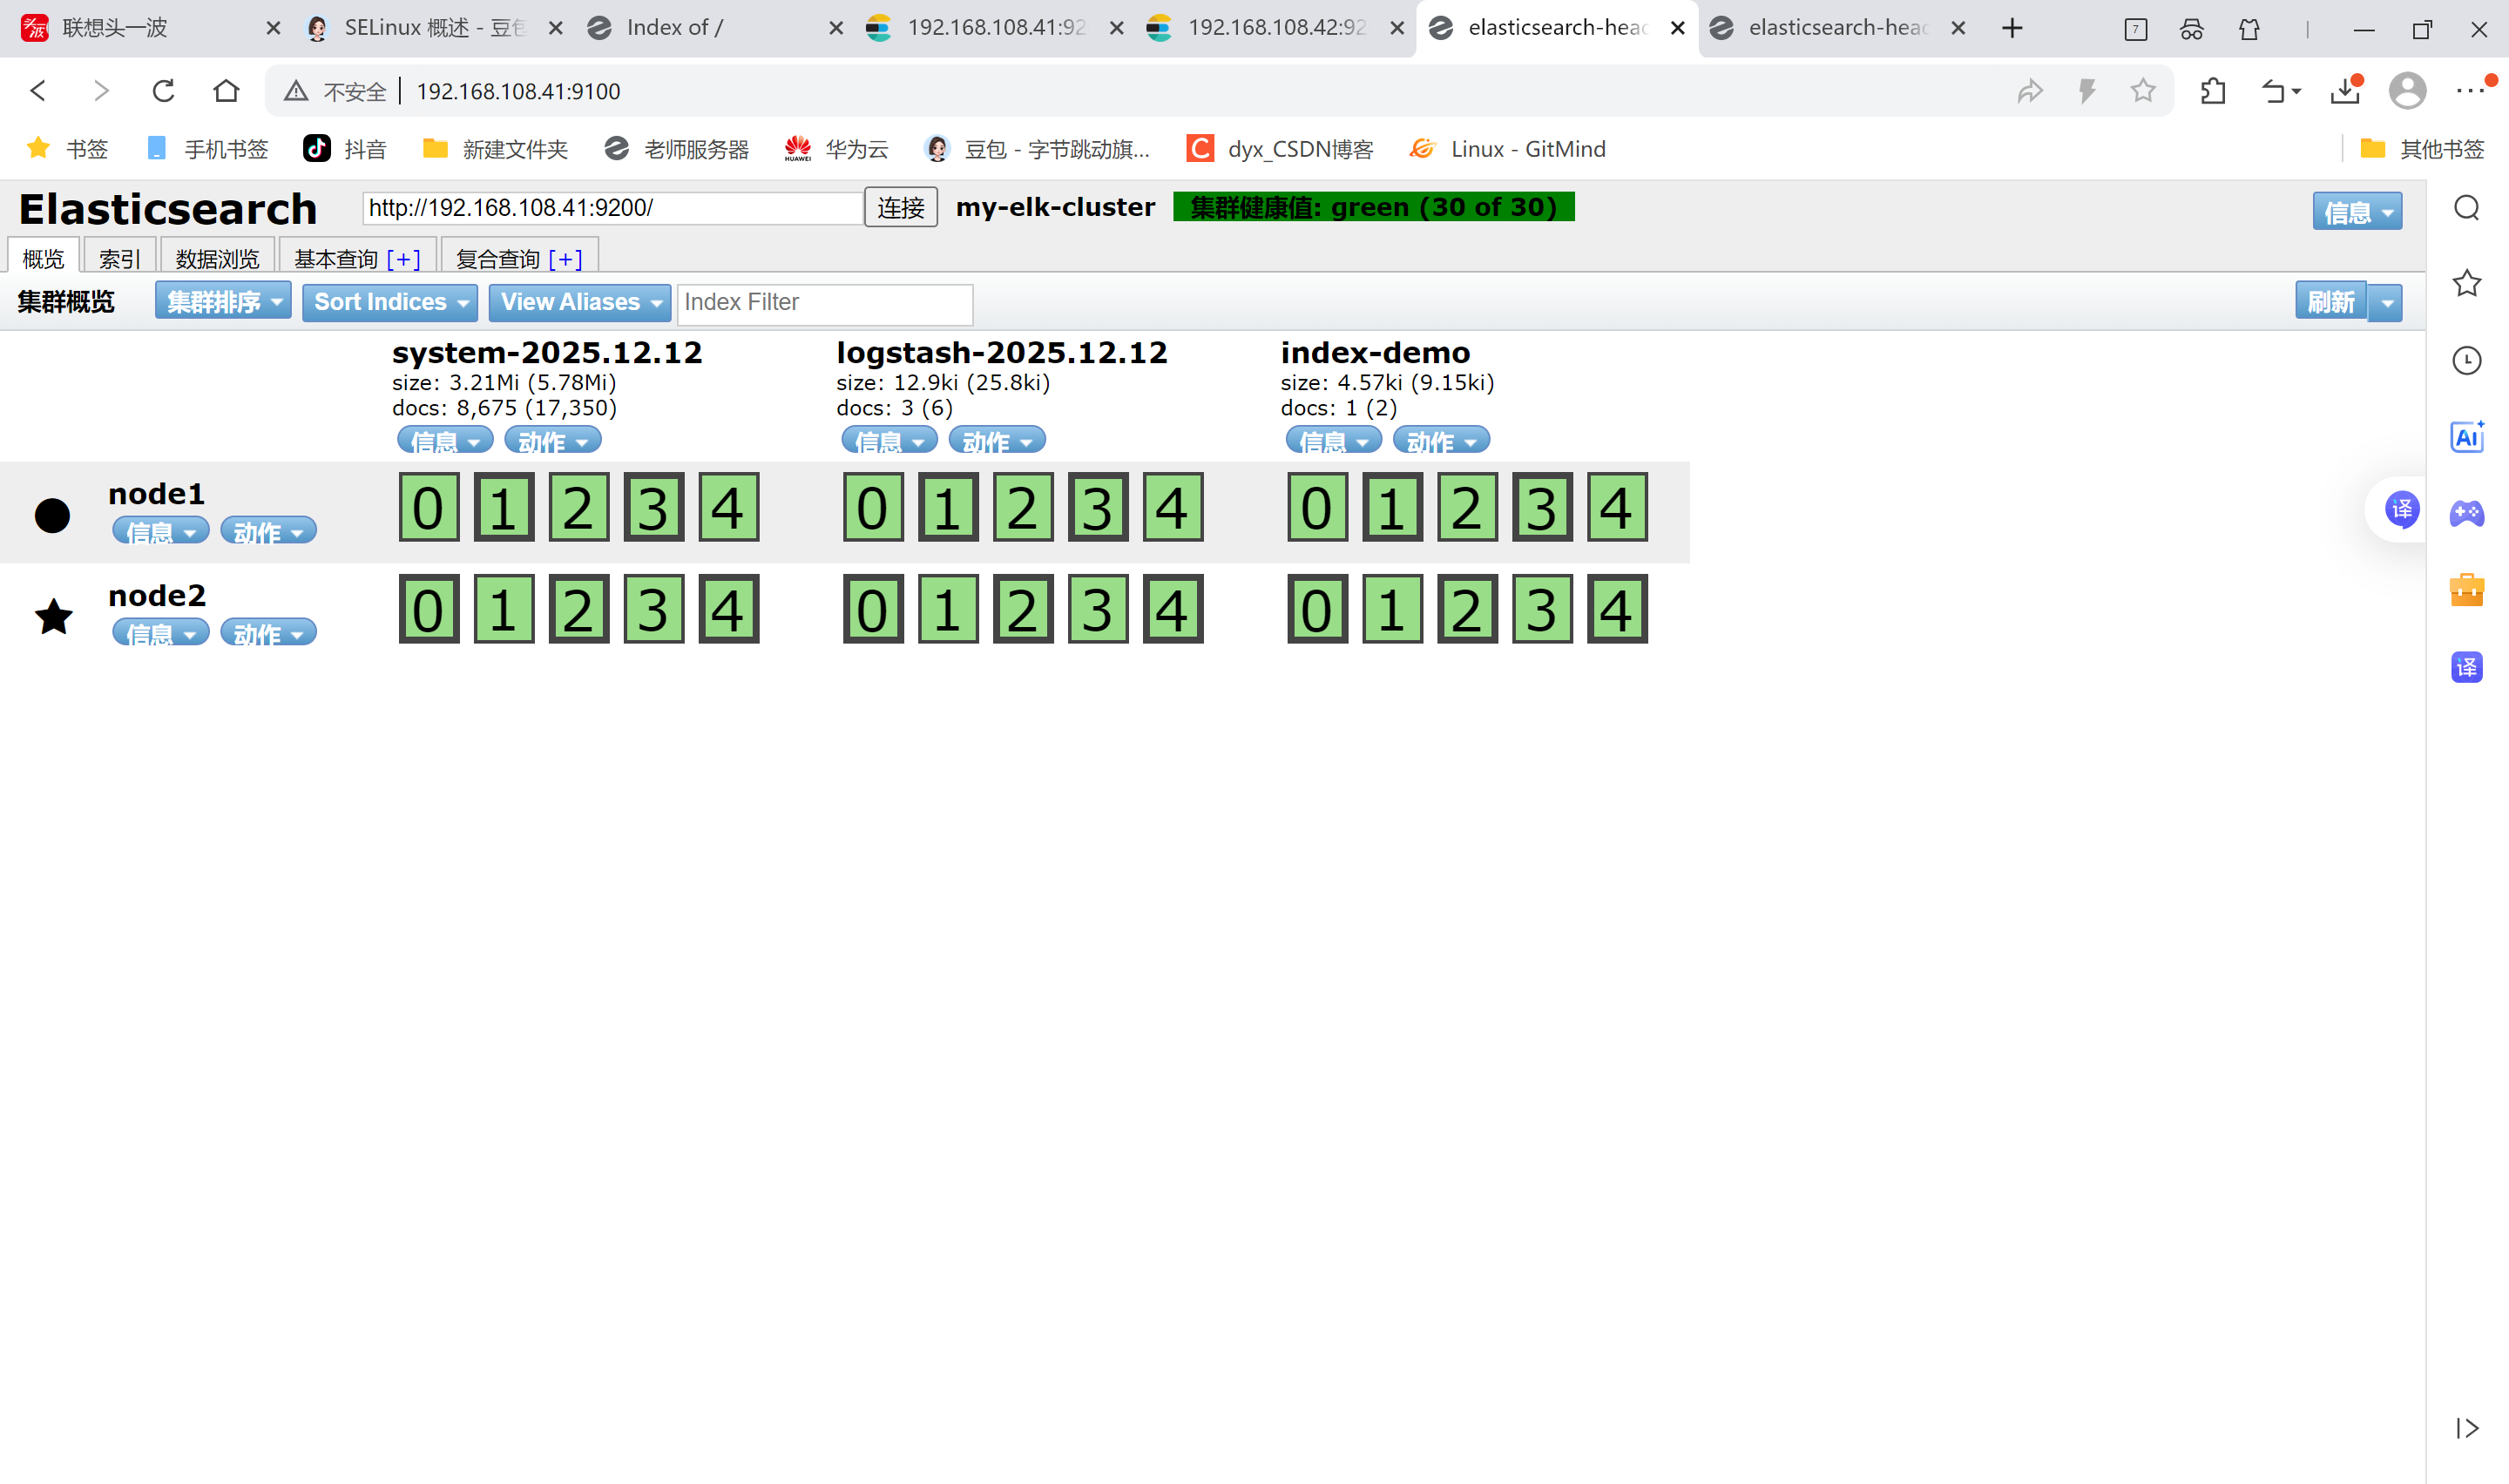
点击数据浏览,看内容
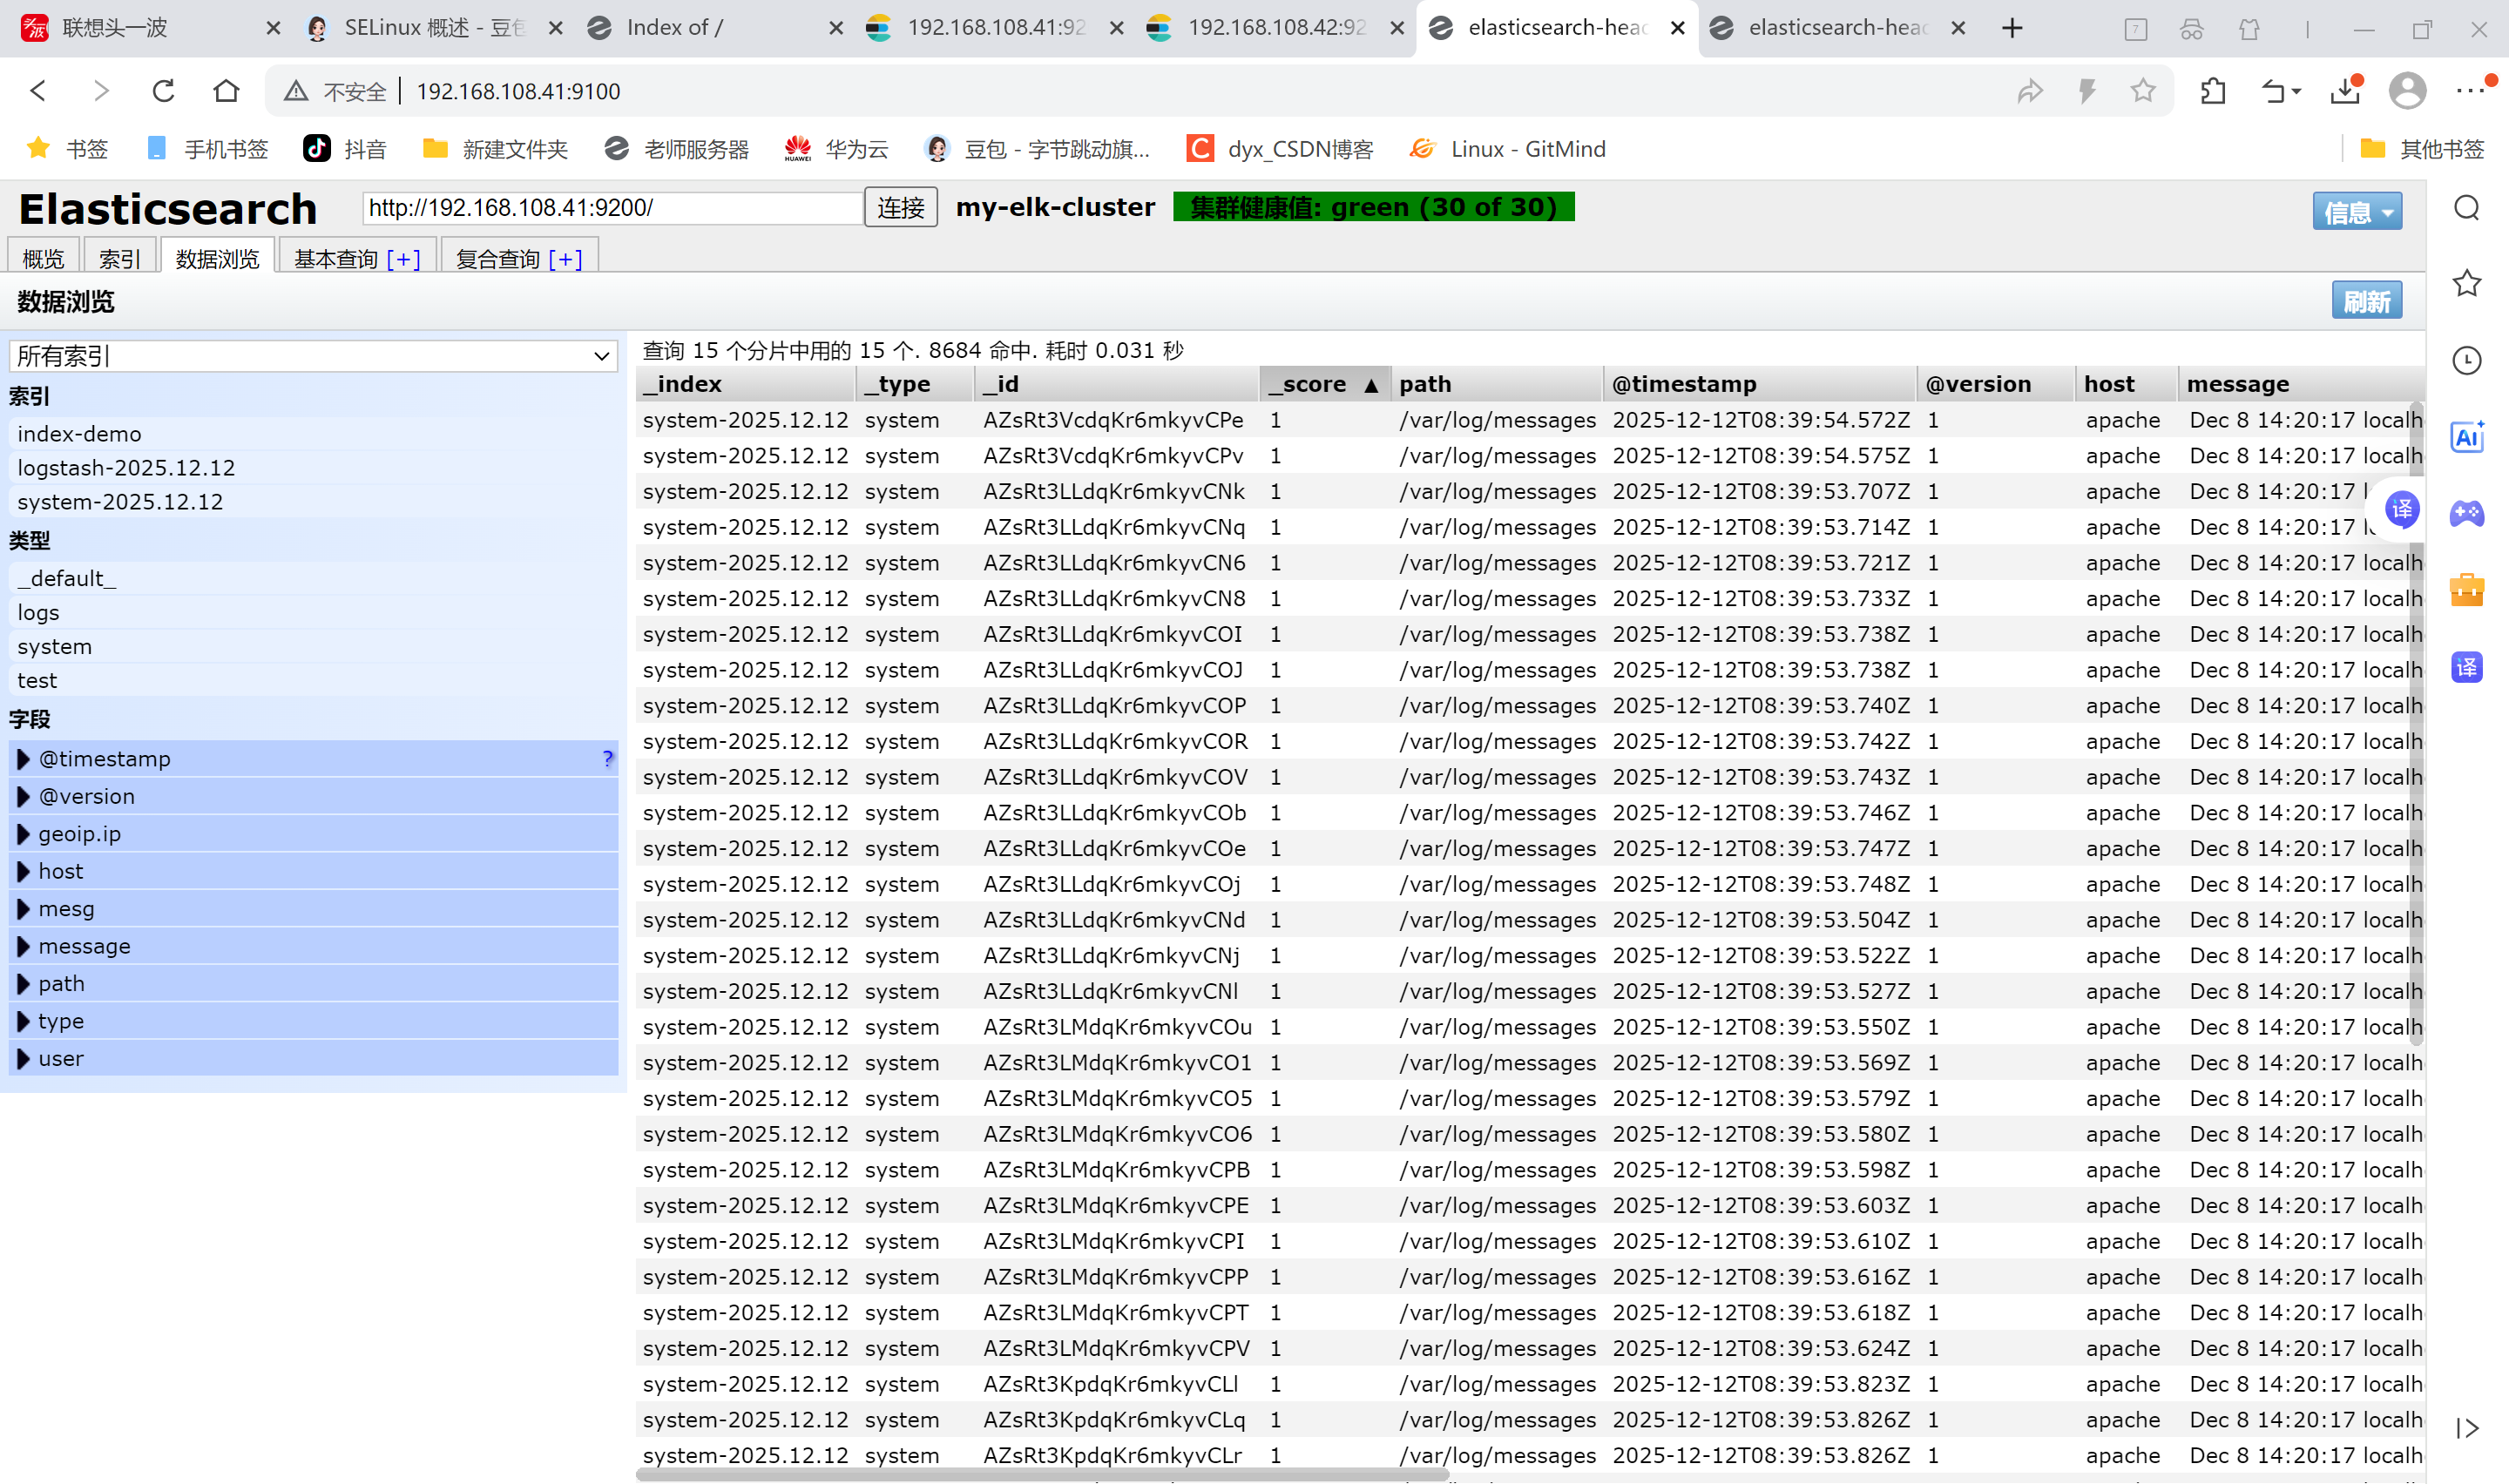
内容不直观,装个kibana数据可视化
5.安装Kibana
登录192.168.108.41 node1主机
在node1主机安装kibana
上传kibana-5.5.1-x86_64.rpm 到/usr/local/src目录
bash
[root@node1 ~]# cd /usr/local/src/
[root@node1 src]# rpm -ivh kibana-5.5.1-x86_64.rpm
[root@node1 src]# cd /etc/kibana/
[root@node1 kibana]# cp kibana.yml kibana.yml.bak
[root@node1 kibana]# vim kibana.yml
2 server.port: 5601 # kibana打开的端口
7 server.host: "0.0.0.0" #kibana侦听的地址
21 elasticsearch.url: "http://192.168.108.41:9200" #和elasticsearch建立联系
30 kibana.index: ".kibana" #在elasticsearch中添加.kibana索引
[root@node1 kibana]# systemctl start kibana.service #启动kibana服务
[root@node1 kibana]# systemctl enable kibana.service #开机启动kibana服务
笔记本浏览器输入192.168.108.41:5601
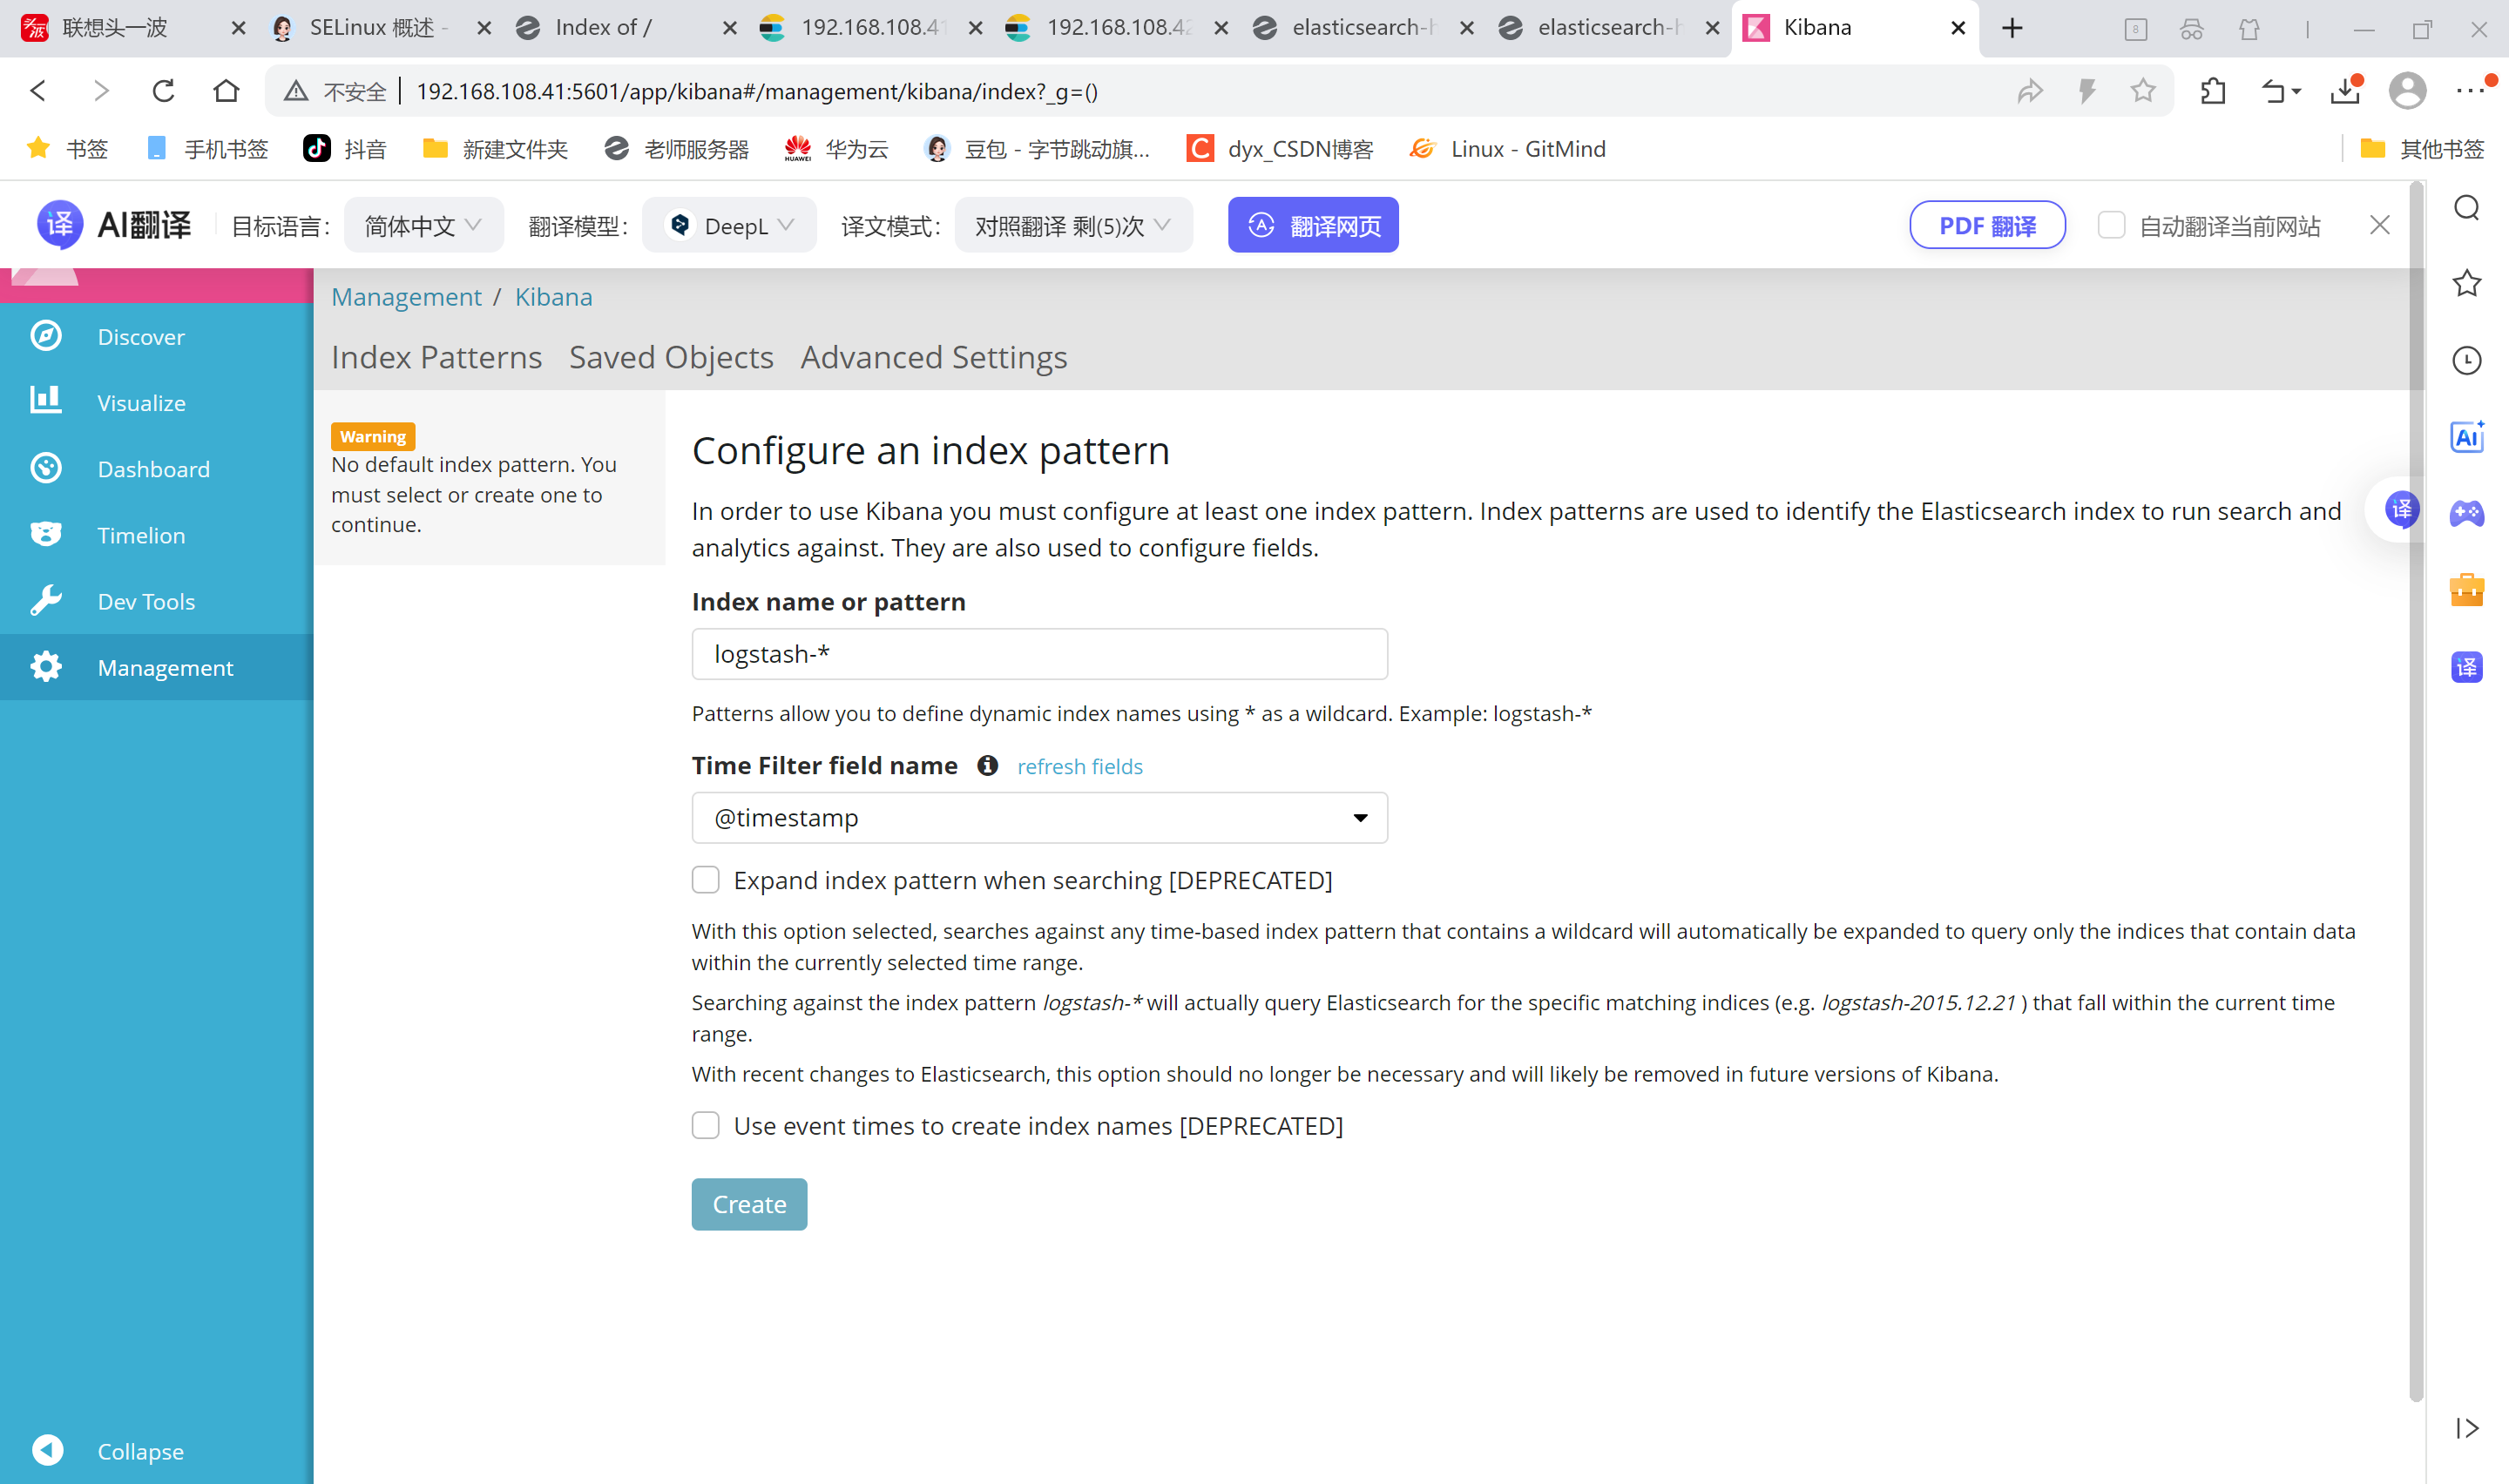
对接Apache主机的Apache 日志文件(访问的、错误的)apache主机操作
bash
[root@apache ~]# cd /etc/logstash/conf.d/
[root@apache conf.d]# touch apache_log.conf
[root@apache conf.d]# cat apache_log.conf
input {
file{
path => "/etc/httpd/logs/access_log"
type => "access"
start_position => "beginning"
}
file{
path => "/etc/httpd/logs/error_log"
type => "error"
start_position => "beginning"
}
}
output {
if [type] == "access" {
elasticsearch {
hosts => ["192.168.108.41:9200"]
index => "apache_access-%{+YYYY.MM.dd}"
}
}
if [type] == "error" {
elasticsearch {
hosts => ["192.168.108.41:9200"]
index => "apache_error-%{+YYYY.MM.dd}"
}
}
}
[root@apache conf.d]# /usr/share/logstash/bin/logstash -f apache_log.conf
ERROR StatusLogger No log4j2 configuration file found. Using default configuration: logging only errors to the console.
WARNING: Could not find logstash.yml which is typically located in $LS_HOME/config or /etc/logstash. You can specify the path using --path.settings. Continuing using the defaults
Could not find log4j2 configuration at path //usr/share/logstash/config/log4j2.properties. Using default config which logs to console
16:58:23.975 [[main]-pipeline-manager] INFO logstash.outputs.elasticsearch - Elasticsearch pool URLs updated {:changes=>{:removed=>[], :added=>[http://192.168.108.41:9200/]}}
16:58:23.979 [[main]-pipeline-manager] INFO logstash.outputs.elasticsearch - Running health check to see if an Elasticsearch connection is working {:healthcheck_url=>http://192.168.108.41:9200/, :path=>"/"}
16:58:24.072 [[main]-pipeline-manager] WARN logstash.outputs.elasticsearch - Restored connection to ES instance {:url=>#<Java::JavaNet::URI:0x7ff54888>}
16:58:24.075 [[main]-pipeline-manager] INFO logstash.outputs.elasticsearch - Using mapping template from {:path=>nil}
16:58:24.266 [[main]-pipeline-manager] INFO logstash.outputs.elasticsearch - Attempting to install template {:manage_template=>{"template"=>"logstash-*", "version"=>50001, "settings"=>{"index.refresh_interval"=>"5s"}, "mappings"=>{"_default_"=>{"_all"=>{"enabled"=>true, "norms"=>false}, "dynamic_templates"=>[{"message_field"=>{"path_match"=>"message", "match_mapping_type"=>"string", "mapping"=>{"type"=>"text", "norms"=>false}}}, {"string_fields"=>{"match"=>"*", "match_mapping_type"=>"string", "mapping"=>{"type"=>"text", "norms"=>false, "fields"=>{"keyword"=>{"type"=>"keyword", "ignore_above"=>256}}}}}], "properties"=>{"@timestamp"=>{"type"=>"date", "include_in_all"=>false}, "@version"=>{"type"=>"keyword", "include_in_all"=>false}, "geoip"=>{"dynamic"=>true, "properties"=>{"ip"=>{"type"=>"ip"}, "location"=>{"type"=>"geo_point"}, "latitude"=>{"type"=>"half_float"}, "longitude"=>{"type"=>"half_float"}}}}}}}}
16:58:24.347 [[main]-pipeline-manager] INFO logstash.outputs.elasticsearch - New Elasticsearch output {:class=>"LogStash::Outputs::ElasticSearch", :hosts=>[#<Java::JavaNet::URI:0x1dbed19a>]}
16:58:24.352 [[main]-pipeline-manager] INFO logstash.outputs.elasticsearch - Elasticsearch pool URLs updated {:changes=>{:removed=>[], :added=>[http://192.168.108.41:9200/]}}
16:58:24.353 [[main]-pipeline-manager] INFO logstash.outputs.elasticsearch - Running health check to see if an Elasticsearch connection is working {:healthcheck_url=>http://192.168.108.41:9200/, :path=>"/"}
16:58:24.357 [[main]-pipeline-manager] WARN logstash.outputs.elasticsearch - Restored connection to ES instance {:url=>#<Java::JavaNet::URI:0xc32ec29>}
16:58:24.359 [[main]-pipeline-manager] INFO logstash.outputs.elasticsearch - Using mapping template from {:path=>nil}
16:58:24.367 [[main]-pipeline-manager] INFO logstash.outputs.elasticsearch - Attempting to install template {:manage_template=>{"template"=>"logstash-*", "version"=>50001, "settings"=>{"index.refresh_interval"=>"5s"}, "mappings"=>{"_default_"=>{"_all"=>{"enabled"=>true, "norms"=>false}, "dynamic_templates"=>[{"message_field"=>{"path_match"=>"message", "match_mapping_type"=>"string", "mapping"=>{"type"=>"text", "norms"=>false}}}, {"string_fields"=>{"match"=>"*", "match_mapping_type"=>"string", "mapping"=>{"type"=>"text", "norms"=>false, "fields"=>{"keyword"=>{"type"=>"keyword", "ignore_above"=>256}}}}}], "properties"=>{"@timestamp"=>{"type"=>"date", "include_in_all"=>false}, "@version"=>{"type"=>"keyword", "include_in_all"=>false}, "geoip"=>{"dynamic"=>true, "properties"=>{"ip"=>{"type"=>"ip"}, "location"=>{"type"=>"geo_point"}, "latitude"=>{"type"=>"half_float"}, "longitude"=>{"type"=>"half_float"}}}}}}}}
16:58:24.373 [[main]-pipeline-manager] INFO logstash.outputs.elasticsearch - New Elasticsearch output {:class=>"LogStash::Outputs::ElasticSearch", :hosts=>[#<Java::JavaNet::URI:0x1b5f73cc>]}
16:58:24.375 [[main]-pipeline-manager] INFO logstash.pipeline - Starting pipeline {"id"=>"main", "pipeline.workers"=>4, "pipeline.batch.size"=>125, "pipeline.batch.delay"=>5, "pipeline.max_inflight"=>500}
16:58:24.553 [[main]-pipeline-manager] INFO logstash.pipeline - Pipeline main started
16:58:24.611 [Api Webserver] INFO logstash.agent - Successfully started Logstash API endpoint {:port=>9601}
^C16:59:03.516 [SIGINT handler] WARN logstash.runner - SIGINT received. Shutting down the agent.
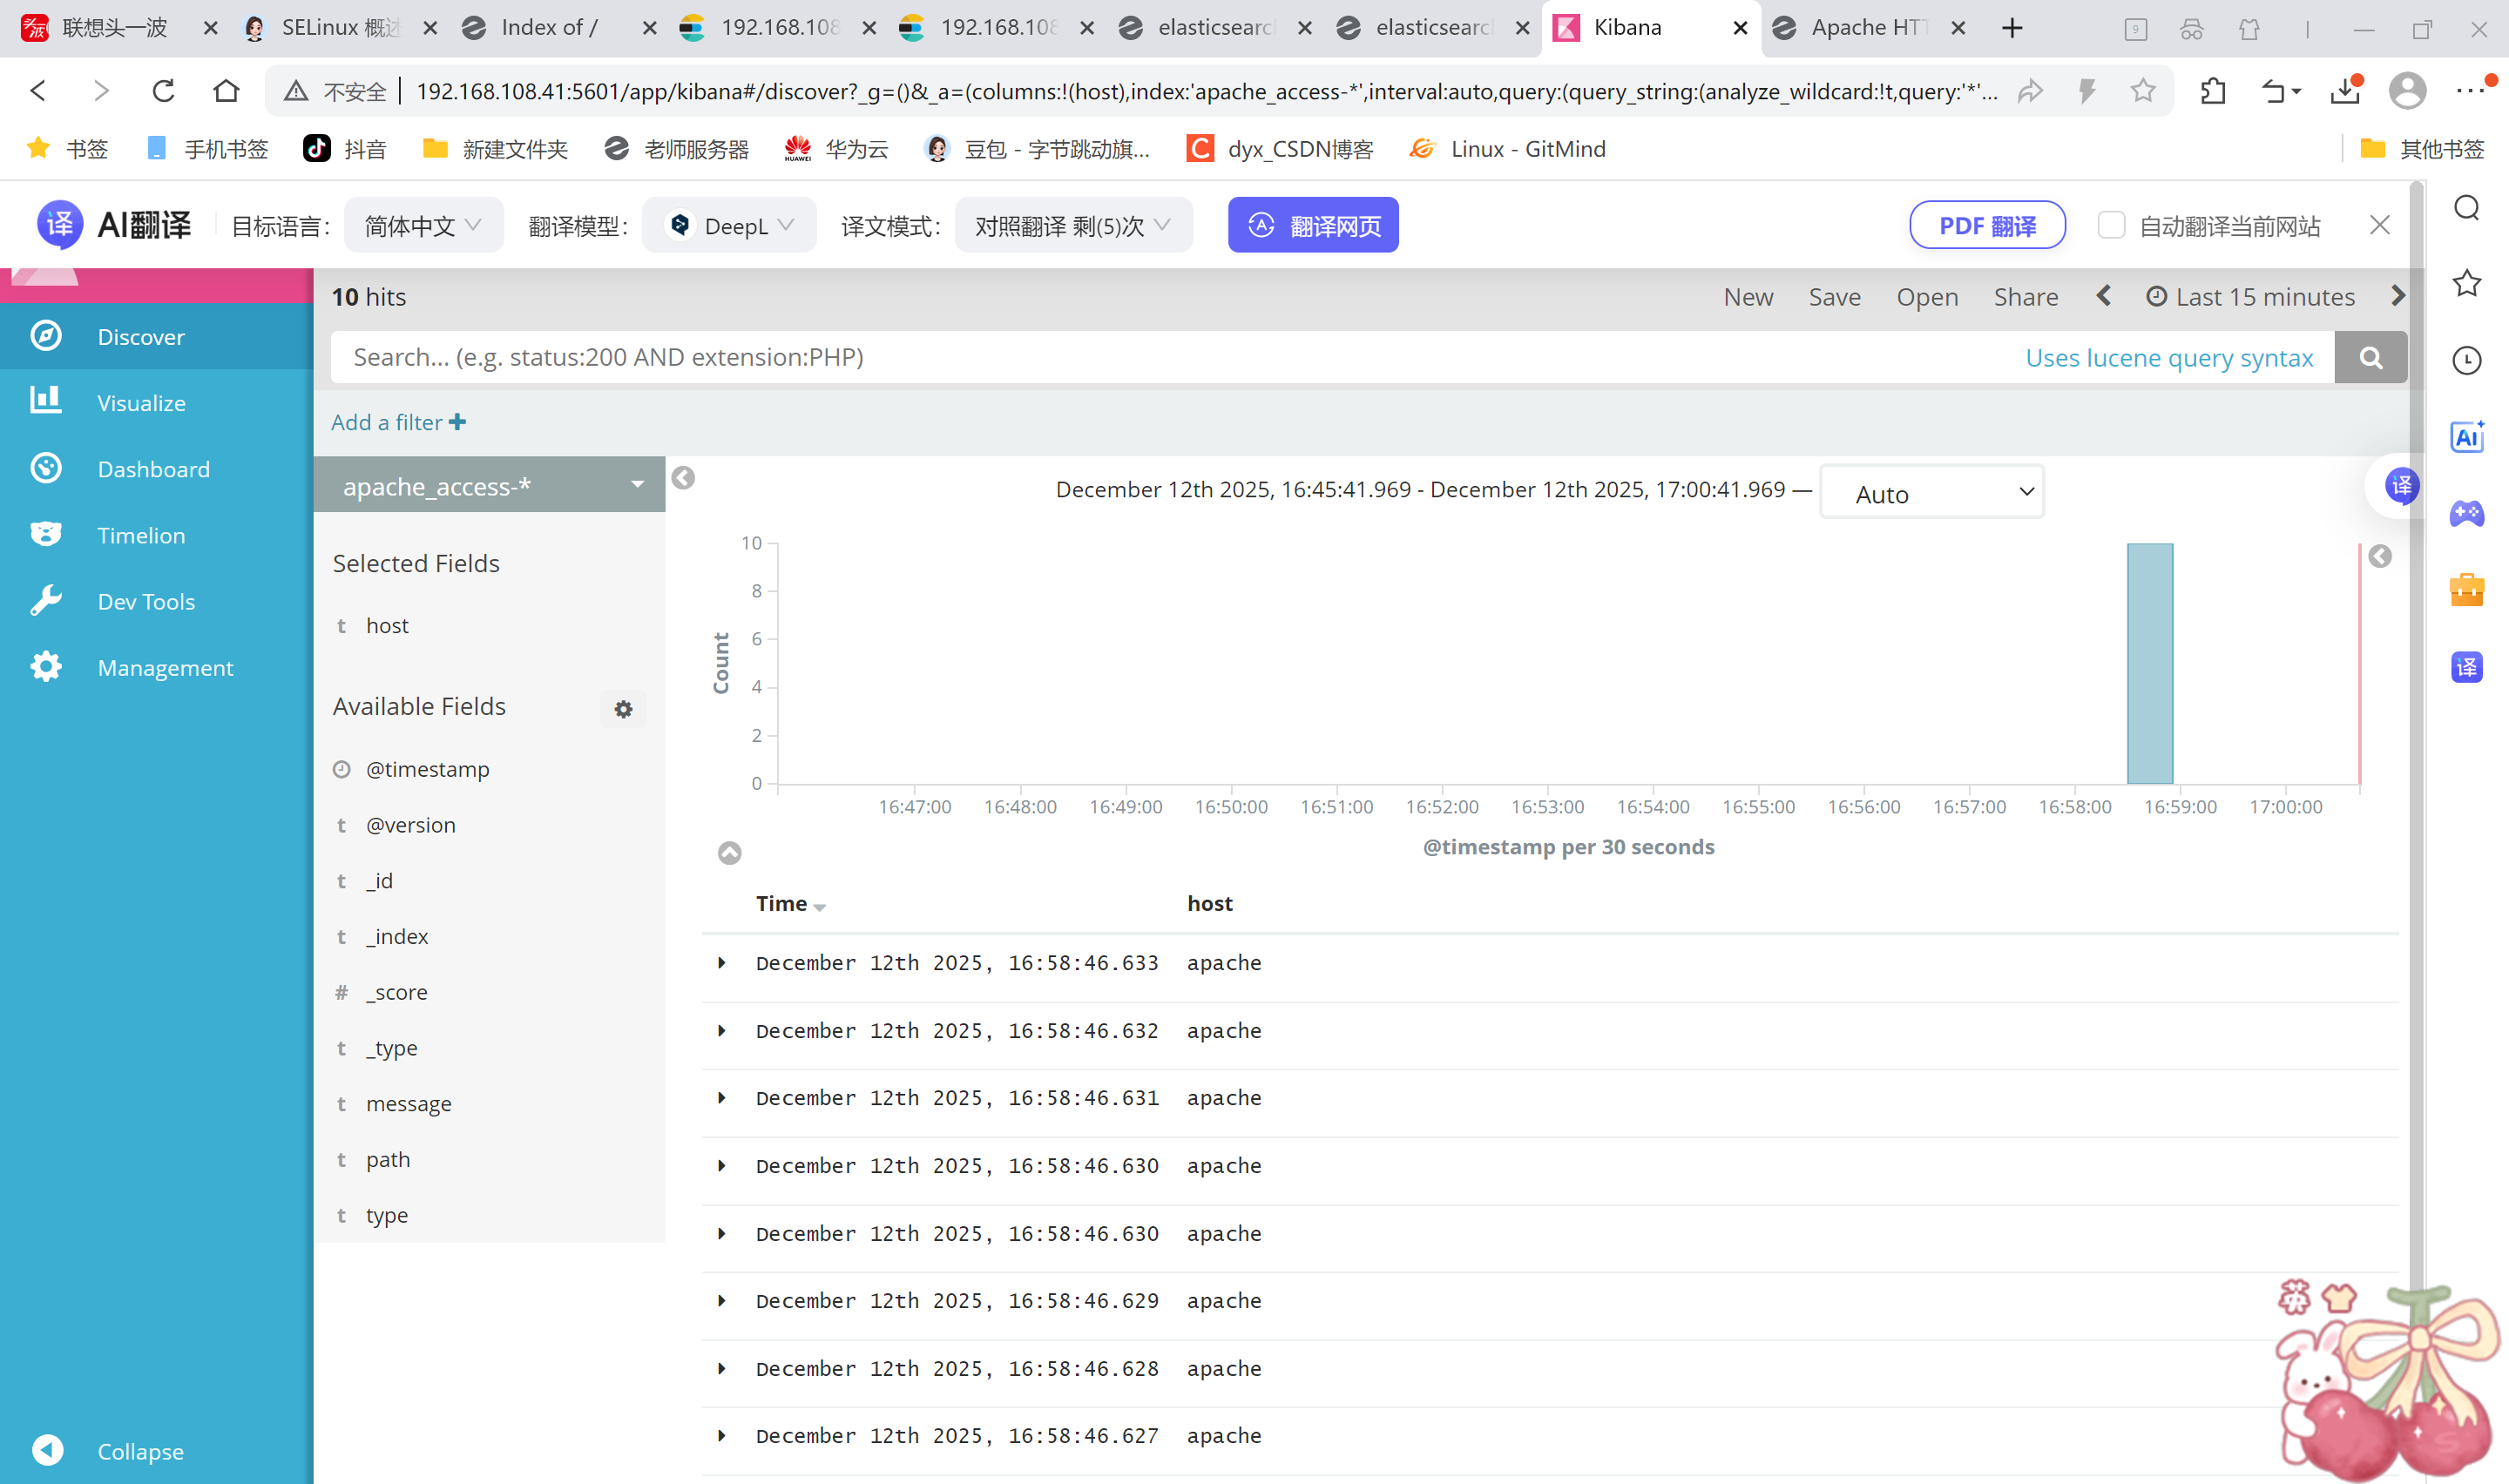
16:59:03.521 [LogStash::Runner] WARN logstash.agent - stopping pipeline {:id=>"main"}登录192.168.108.1 node1主机
打开浏览器 输入http://192.168.108.41:9100/ 查看索引信息能发现
apache_error-2025.12.12 apache_access-2025.12.12
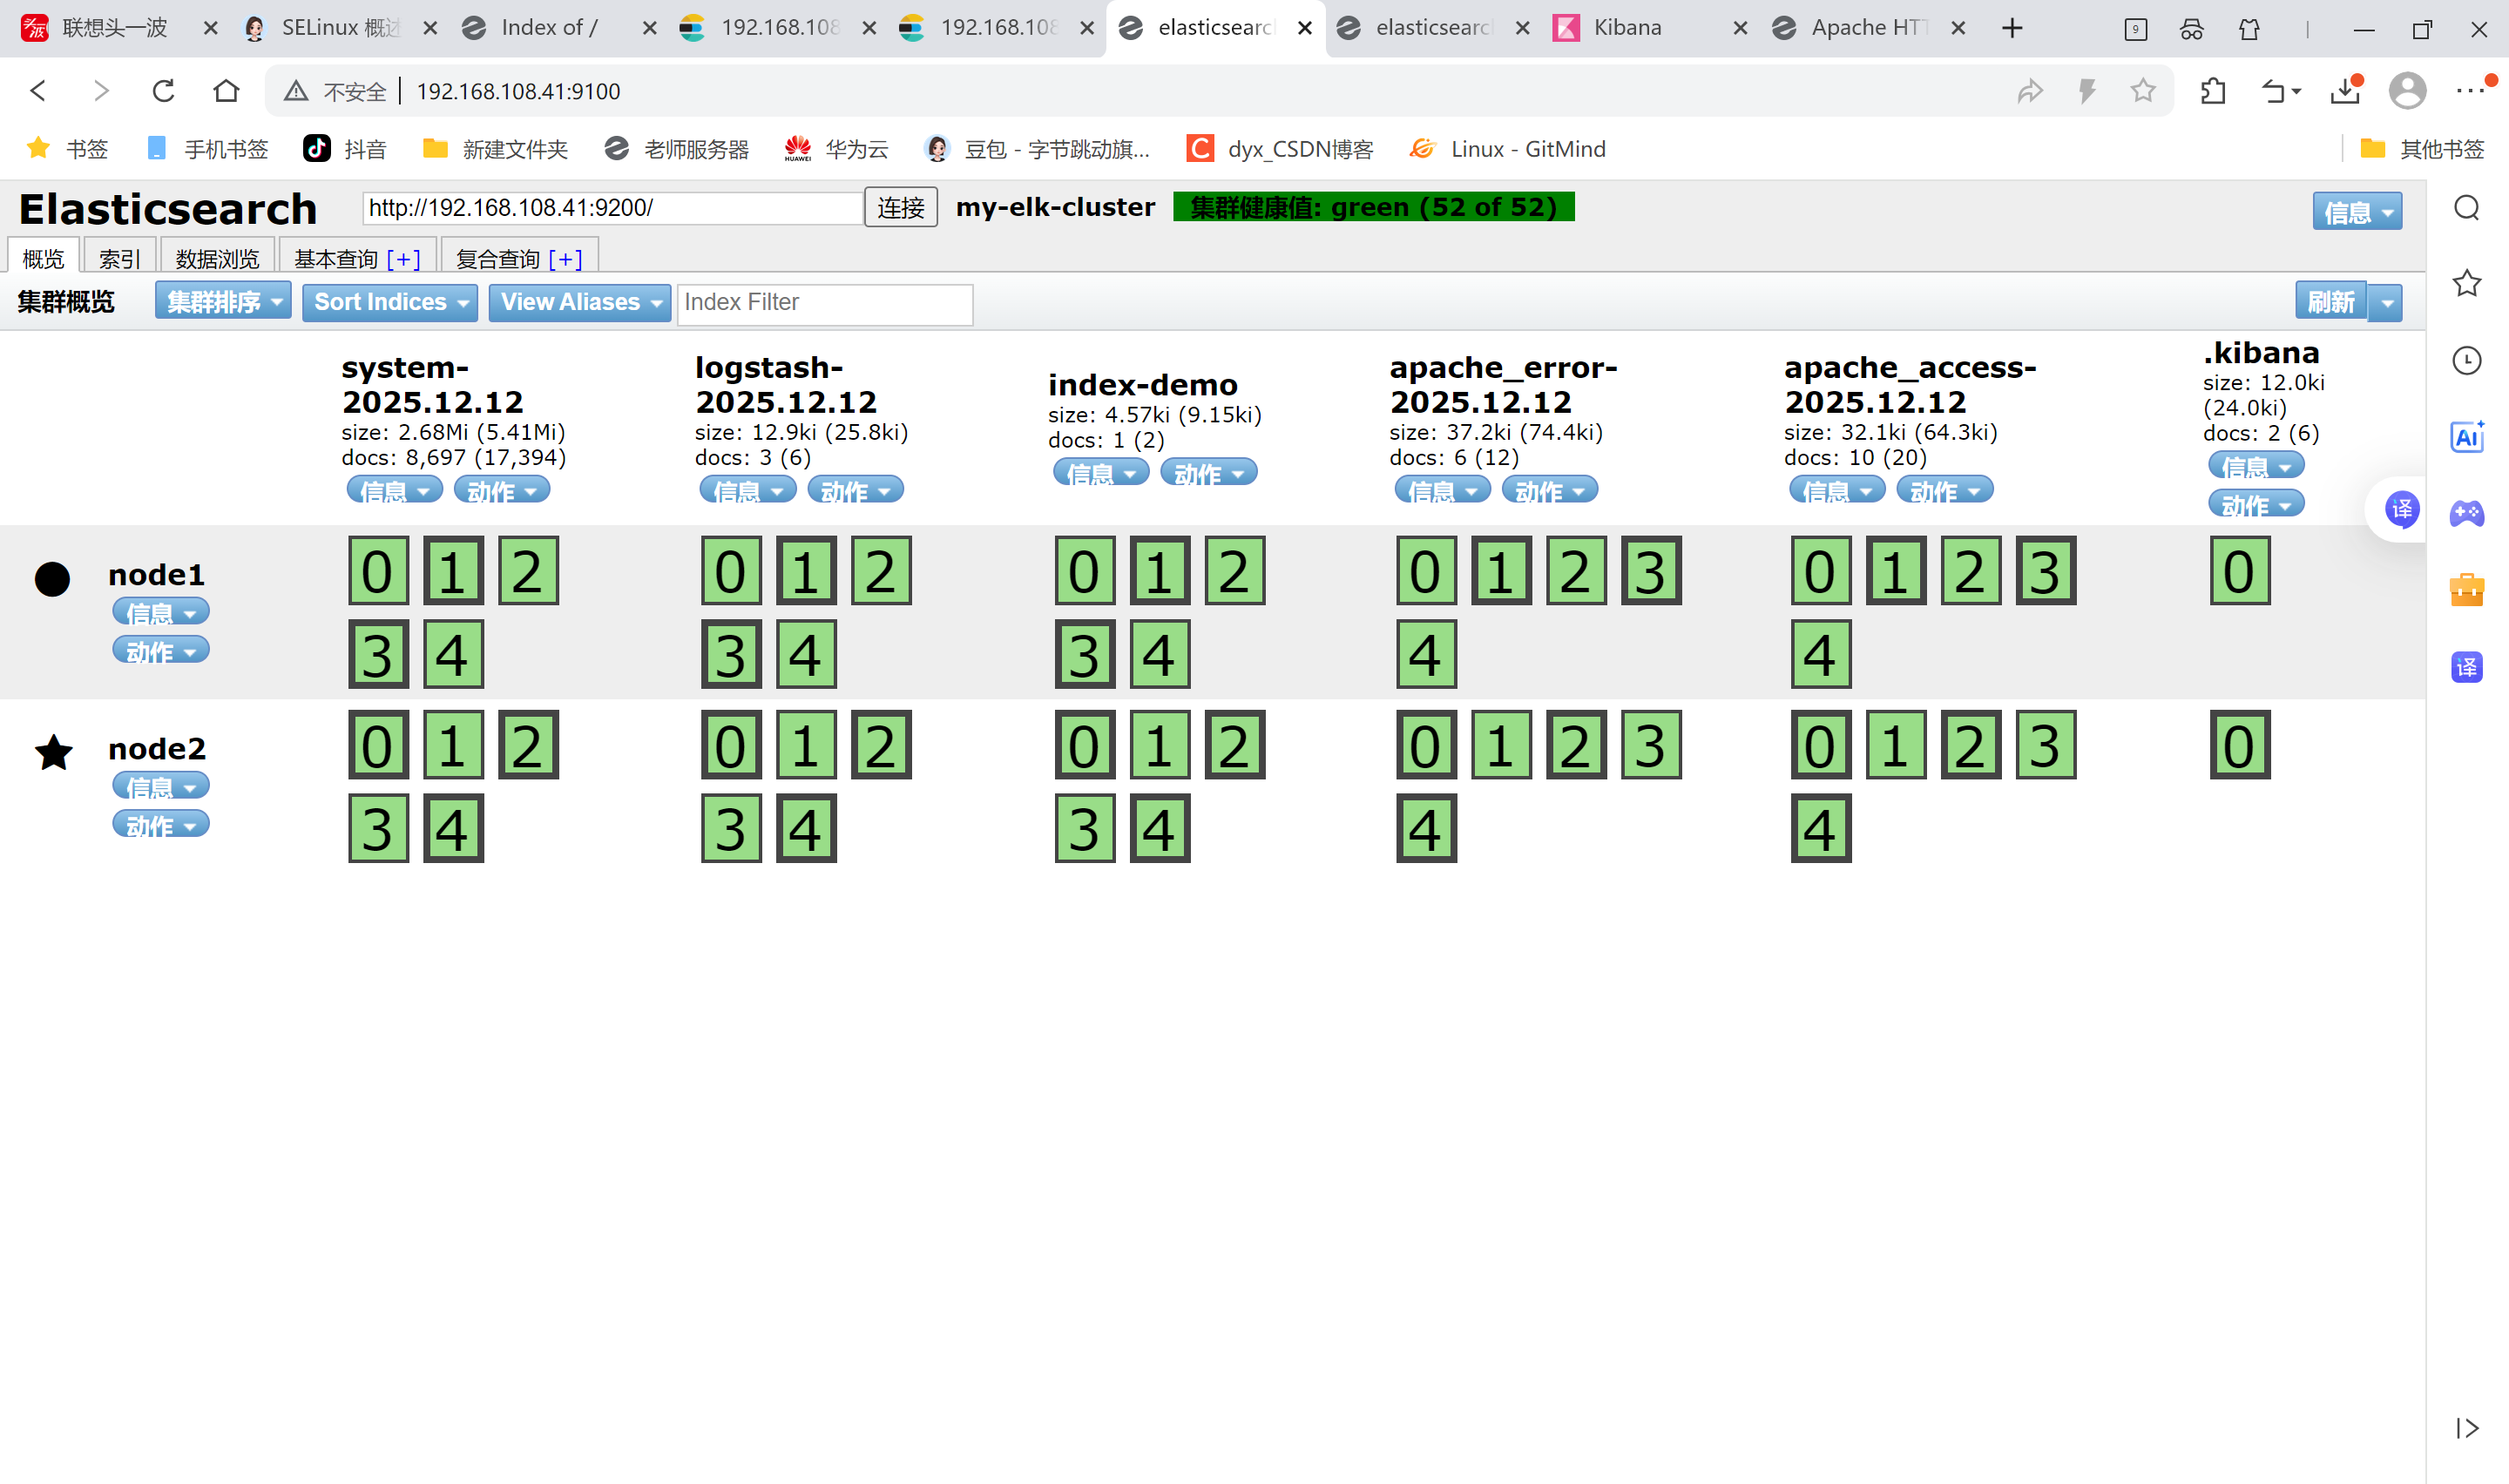
打开浏览器 输入http://192.168.108.41:5601。可以多刷新几次,观察kibana,日志很直观显示