组件概述
DevUI的Quadrant Diagram是一个支持拖拽交互 的四象限图组件,主要用于可视化数据分类,这个组件特别适合用于优先级管理、能力评估、决策分析 等需要将项目或数据进行四象限分类展示的场景。它基于Angular 18.0.0+版本,属于DevUI设计体系的一部分,遵循"高效、开放、可信、乐趣"的设计价值观。
基本用法示例
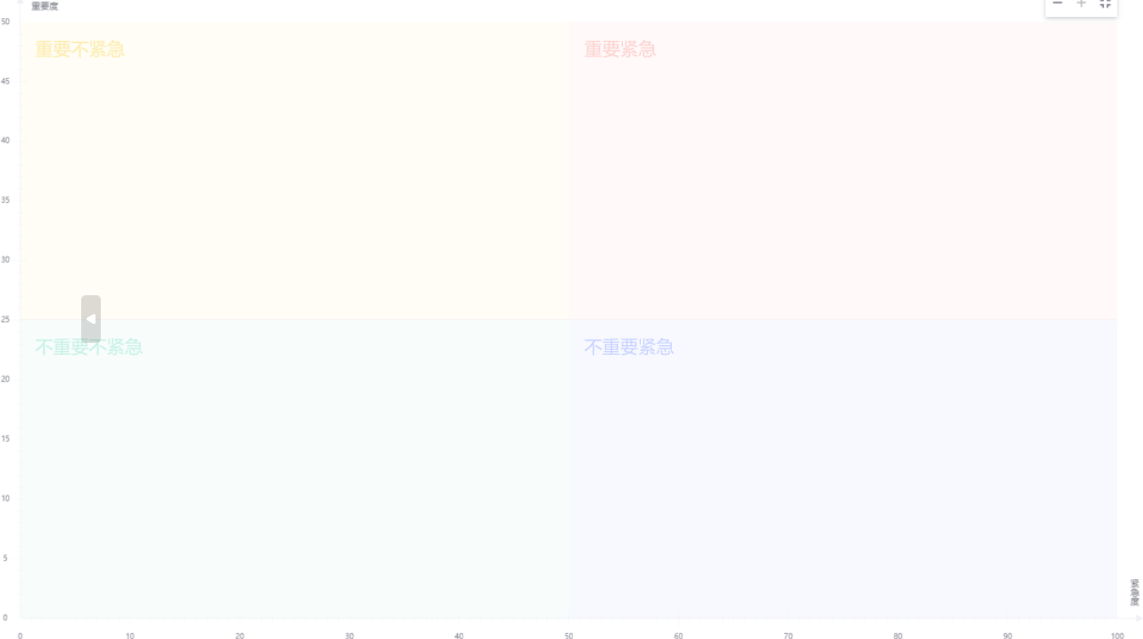
1. 基本象限图
基本用法展示了如何创建一个基本功能的四象限图,常用于类似"重要-紧急"矩阵的场景。
HTML模板代码:
html
<!-- 可拖拽列表 -->
<section>
  <div class="row">
    <div class="col-sm-3">
      <div class="card">
        <div class="card-header">Draggable items</div>
        <div class="card-block">
          <ul class="list-group">
            <li dDraggable *ngFor="let item of list" [dragData]="{ item: item, parent: list }" class="list-group-item over-flow-ellipsis">
              {{ item.title }}
            </li>
          </ul>
        </div>
      </div>
    </div>
  </div>
</section>
<!-- 象限图组件 -->
<d-quadrant-diagram [labelData]="labelData" [diagramId]="'basic-quadrant-diagram'" (dropEvent)="dropEvent($event)"></d-quadrant-diagram>
TypeScript组件代码:
typescript
import { Component } from '@angular/core';
import { ILabelDataConfigs } from 'ng-devui/quadrant-diagram';

@Component({
  selector: 'd-basic',
  templateUrl: './basic.component.html',
  styleUrls: ['./basic.component.scss'],
})
export class BasicComponent {
  labelData: Array<ILabelDataConfigs> = [];
  list = [
    { title: 'First level', content: '<p>First level target</p><p>Value 3</p><p>Urgency 3</p><p>Priority 3</p>', progress: 40 },
    { title: 'Feature target', content: '<p>Feature target</p><p>Value 3</p><p>Urgency 3</p><p>Priority 3</p>', progress: 30 },
    { title: 'Secondary', content: '<p>Secondary target</p><p>Value:3</p><p>Urgency 3</p><p>Priority 3</p>', progress: 20 },
    { title: 'Three-level', content: '<p>Three-level target</p><p>Value:3</p><p>Urgency 3</p><p>Priority 3</p>', progress: 10 },
  ];

  dropEvent(item) {
    const droppedItem = this.list.map((e) => e.title).indexOf(item.dragData.item.title);
    if (droppedItem !== -1) {
      this.list.splice(droppedItem, 1);
    }
    const label = {
      title: item.dragData.item.title,
      content: item.dragData.item.content,
      x: item.xAxisValue,
      y: item.yAxisValue,
      progress: item.dragData.item.progress,
    };
    const labelIndex = this.labelData.map((e) => e.title).indexOf(label.title);
    if (labelIndex !== -1) {
      this.labelData.splice(labelIndex, 1);
    }
    this.labelData.push(label); // Place the dragged data on the quadrant graph to display
  }
}
scss代码
css
@import '~ng-devui/styles-var/devui-var.scss';
section {
margin-bottom: 20px !important;
user-select: none;
}
.row {
overflow: hidden;
}
.col-sm-3 {
float: left;
position: relative;
min-height: 1px;
padding-right: 16px;
padding-left: 16px;
min-width: 220px;
width: 220px;
}
.list-group .list-group-item {
padding: 0 16px;
}
.drag-border {
border: $devui-brand dashed 1px;
}
.drag-handle {
cursor: move;
/* fallback if grab cursor is unsupported */
cursor: grab;
cursor: -moz-grab;
cursor: -webkit-grab;
}
.drag-handle:active {
cursor: grabbing;
cursor: -moz-grabbing;
cursor: -webkit-grabbing;
}
.drag-hint-border {
border: $devui-success dashed 2px;
}
.drag-over-border {
border: $devui-warning dashed 2px;
}
.card {
border: 1px solid $devui-dividing-line;
}
.card .card-header {
font-size: $devui-font-size-modal-title;
padding: 8px;
}
.list-group {
margin-bottom: 20px;
padding: 8px;
}
.list-group > li {
height: 36px;
line-height: 36px;
font-size: $devui-font-size-card-title;
color: $devui-text;
background: $devui-base-bg;
box-shadow: $devui-shadow-length-base $devui-light-shadow;
border-radius: $devui-border-radius;
width: 140px;
margin: 8px;
text-align: center;
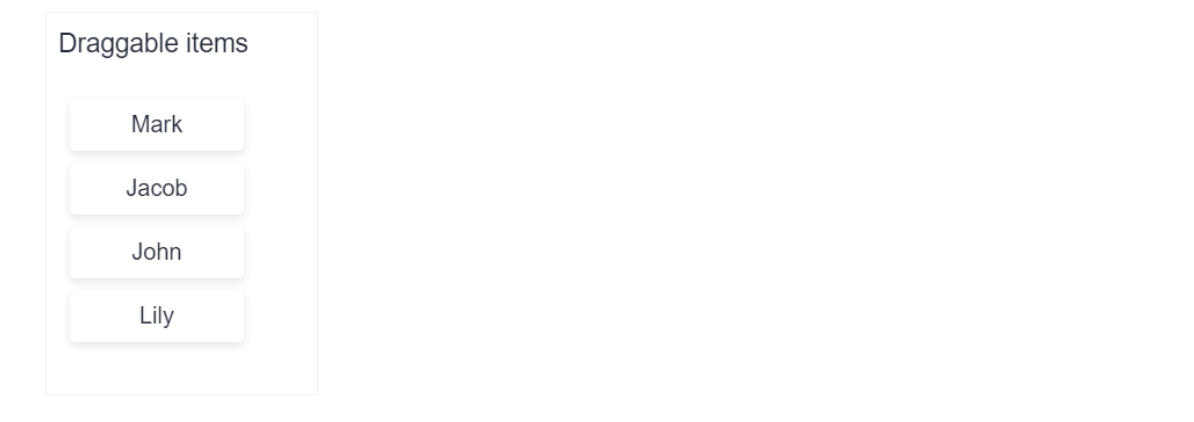
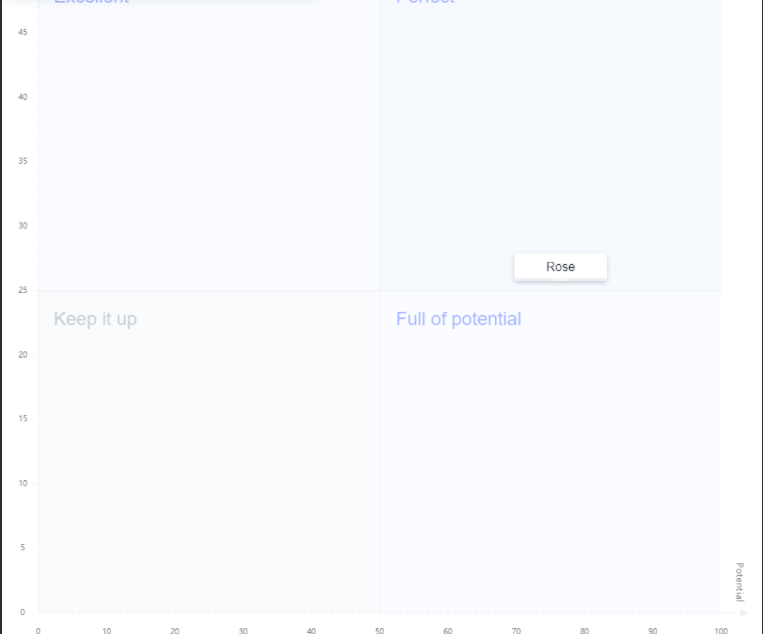
}2. 配置自定义象限图
高级配置允许你完全自定义象限图的各个方面,包括坐标轴、象限样式等。
HTML模板代码:
html
<section>
  <div class="row">
    <div class="col-sm-3">
      <div class="card" dDroppable [dropScope]="'devui-quadrant-diagram'" (dropEvent)="onDrop($event, list)">
        <div class="card-header">Draggable items</div>
        <div class="card-block">
          <ul class="list-group">
            <li
              dDraggable
              *ngFor="let item of list"
              [dragScope]="'devui-quadrant-diagram'"
              [dragData]="{ item: item, parent: list }"
              class="list-group-item over-flow-ellipsis"
            >
              {{ item.title }}
            </li>
          </ul>
        </div>
      </div>
    </div>
  </div>
</section>
<d-quadrant-diagram
  [labelData]="labelData"
  [quadrantConfigs]="quadrantConfigs"
  [axisConfigs]="axisConfigs"
  [view]="view"
  [showToolbar]="false"
  [dropScope]="'devui-quadrant-diagram'"
  (dropEvent)="dropEvent($event)"
></d-quadrant-diagram>
TypeScript组件代码:
typescript
import { Component } from '@angular/core';
import { IAxisConfigs, ILabelDataConfigs, IQuadrantConfigs, IViewConfigs } from 'ng-devui/quadrant-diagram';

@Component({
  selector: 'd-config',
  templateUrl: './config.component.html',
  styleUrls: ['./config.component.scss'],
})
export class ConfigComponent {
  xWeight = 2;
  yWeight = 1;
  view: IViewConfigs = {
    height: 900,
    width: 950,
  };
  list: Array<ILabelDataConfigs> = [
    { title: 'Mark', x: 0, y: 0, content: '' },
    { title: 'Jacob', x: 0, y: 0, content: '' },
    { title: 'John', x: 0, y: 0, content: '' },
    { title: 'Lily', x: 0, y: 0, content: '' },
  ];
  axisConfigs: IAxisConfigs = {
    xAxisLabel: 'Potential',
    yAxisLabel: 'Ability',
    xWeight: this.xWeight,
    yWeight: this.yWeight,
  };
  quadrantConfigs: Array<IQuadrantConfigs> = [
    {

      title: 'Perfect',
      backgroundColor: 'rgba(232,240,253,0.4)',
      color: 'rgba(81,112,255,0.5)',
    },
    {

      title: 'Excellent',
      backgroundColor: 'rgba(232,240,253,0.2)',
      color: 'rgba(81,112,255,0.5)',
    },
    {

      title: 'Keep it up',
      backgroundColor: 'rgba(243,246,248,0.4)',
      color: 'rgba(149,158,178,0.5)',
    },
    {

      title: 'Full of potential',
      backgroundColor: 'rgba(232,240,253,0.2)',
      color: 'rgba(81,112,255,0.5)',
    },
  ];
  labelData = [{ title: 'Rose', x: 80, y: 20, content: '<p>Rose的能力</p><p>能力值:20</p><p>潜力值:80</p>', id: 'Rose' }];

  onDrop(e: any, targetArray) {
    let index = e.dropIndex;
    const fromIndex = e.dragFromIndex;
    e.dragData.item.x = 0;
    e.dragData.item.y = 0;
    const item = e.dragData.item;
    if (-1 !== index) {
      if (-1 !== fromIndex && index > fromIndex) {
        index--;
      }
      targetArray.splice(index, 0, fromIndex === -1 ? item : targetArray.splice(fromIndex, 1)[0]);
    } else {
      targetArray.push(item);
    }
    if (fromIndex === -1) {
      this.removeItem(item, e.dragData.parent);
    }
  }

  removeItem(item: any, list: Array<any>) {
    const index = list.map((e) => e.title).indexOf(item.title);
    list.splice(index, 1);
    this.labelData = Object.assign([], list);
  }

  dropEvent(item) {
    console.log(item);
    const droppedItem = this.list.map((e) => e.title).indexOf(item.dragData.item.title);
    if (droppedItem !== -1) {
      this.list.splice(droppedItem, 1);
    }
    const label = {
      title: item.dragData.item.title,
      content: `<p>${item.dragData.item.title}的能力</p><p>能力值:${item.yAxisValue * this.yWeight}</p><p>潜力值:${
        item.xAxisValue * this.xWeight
      }</p>`,
      x: item.xAxisValue,
      y: item.yAxisValue,
      progress: item.dragData.item.progress,
      id: item.dragData.item.title,
    };
    const labelIndex = this.labelData.map((e) => e.id).indexOf(label.id);
    if (labelIndex !== -1) {
      this.labelData.splice(labelIndex, 1);
    }
    // Place the dragged data on the quadrant graph to display
    this.labelData.push(label);
  }

}
scss代码
css
@import '~ng-devui/styles-var/devui-var.scss';

section {
  margin-bottom: 20px !important;
  user-select: none;
}

.row {
  overflow: hidden;
}

.col-sm-3 {
  float: left;
  position: relative;
  min-height: 1px;
  padding-right: 16px;
  padding-left: 16px;
  min-width: 220px;
  width: 220px;
}

.list-group .list-group-item {
  padding: 0 16px;
}

.drag-border {
  border: $devui-brand dashed 1px;
}

.drag-handle {
  cursor: move;
  cursor: grab;
  cursor: -moz-grab;
  cursor: -webkit-grab;
}

.drag-handle:active {
  cursor: grabbing;
  cursor: -moz-grabbing;
  cursor: -webkit-grabbing;
}

.drag-hint-border {
  border: $devui-success dashed 2px;
}

.drag-over-border {
  border: $devui-warning dashed 2px;
}

.card {
  border: 1px solid $devui-dividing-line;
}

.card .card-header {
  font-size: $devui-font-size-modal-title;
  padding: 8px;
}

.list-group {
  margin-bottom: 20px;
  padding: 8px;
}

.list-group > li {
  height: 36px;
  line-height: 36px;
  font-size: $devui-font-size-card-title;
  color: $devui-text;
  background: $devui-base-bg;
  box-shadow: $devui-shadow-length-base $devui-light-shadow;
  border-radius: $devui-border-radius;
  width: 120px;
  margin: 8px;
  text-align: center;
}
核心API详解
输入属性
| 属性名 | 类型 | 默认值 | 说明 |
|---|---|---|---|
labelData |
Array<{title: string, color?: string, backgroundColor?: string}> |
- | 必需,定义四个象限的标签和样式 |
diagramId |
string |
- | 象限图的唯一标识符 |
quadrantConfigs |
object |
{} |
象限的额外配置选项 |
axisConfigs |
object |
{} |
坐标轴的配置 |
view |
[number, number] |
[800, 600] |
图表的显示尺寸 宽度, 高度 |
showToolbar |
boolean |
true |
是否显示工具栏 |
dropScope |
string |
- | 拖拽作用域,用于匹配可放置区域 |
输出事件
| 事件名 | 参数 | 说明 |
|---|---|---|
dropEvent |
{event: DragEvent, data: any} |
当项目被拖拽到象限中时触发 |
拖拽指令
| 指令 | 属性 | 说明 |
|---|---|---|
dDraggable |
[dragData] |
使元素可拖拽,dragData传递拖拽数据 |
dDroppable |
[dropScope] |
定义可放置区域,dropScope与dragScope匹配 |
使用场景与最佳实践
1. 项目管理优先级矩阵
typescript
// 示例:重要-紧急矩阵
labelData = [
  { title: '立即处理', color: '#fff', backgroundColor: '#f66f6a' }, // 第一象限
  { title: '计划执行', color: '#333', backgroundColor: '#fac20a' }, // 第二象限
  { title: '授权处理', color: '#333', backgroundColor: '#e7fcf6' }, // 第三象限
  { title: '避免干扰', color: '#fff', backgroundColor: '#a97af8' }  // 第四象限
];
2. 员工能力评估
typescript
// 示例:能力-潜力评估矩阵
axisConfigs = {
  xAxis: { name: '当前能力', min: 0, max: 10 },
  yAxis: { name: '发展潜力', min: 0, max: 10 }
};
3. 产品功能优先级
typescript
// 示例:价值-成本矩阵
labelData = [
  { title: '高价值低成本', backgroundColor: '#50d4ab' }, // 优先开发
  { title: '高价值高成本', backgroundColor: '#a97af8' }, // 战略投资
  { title: '低价值低成本', backgroundColor: '#fac20a' }, // 酌情考虑
  { title: '低价值高成本', backgroundColor: '#f66f6a' }  // 避免开发
];
🔧 实用技巧与注意事项
-
拖拽范围匹配 :确保
dDraggable的[dragScope]与dDroppable的[dropScope]或d-quadrant-diagram的[dropScope]值相同,否则拖拽操作不会生效。 -
数据绑定 :拖拽数据通过
[dragData]传递,可以包含项目数据和源数组引用,便于在dropEvent中更新数据状态。 -
响应式设计 :通过
[view]属性调整图表尺寸,确保在不同屏幕尺寸下正常显示。 -
性能优化 :当拖拽项目较多时,建议使用
trackBy函数优化渲染性能。 -
样式自定义 :通过
labelData中的color和backgroundColor属性定制每个象限的视觉样式,保持与整体设计系统一致。
🎯 总结
DevUI的Quadrant Diagram组件是一个功能强大且灵活的拖拽式四象限图解决方案,特别适合需要交互式数据分类的应用场景。它的主要优势包括:
- 开箱即用:基本配置简单,快速实现四象限分类功能
- 高度可定制:支持坐标轴、样式、尺寸等多维度自定义
- 交互友好:拖拽操作直观,提供完整的事件处理机制
- 企业级设计:遵循DevUI设计规范,与Angular生态完美集成
无论是用于项目管理、决策分析还是数据可视化,这个组件都能提供专业级的用户体验和开发效率。你可以根据实际需求选择基本用法或高级配置,实现最适合你业务场景的象限图应用。
参考文档
MateChat:https://gitcode.com/DevCloudFE/MateChat
MateChat官网:https://matechat.gitcode.com
DevUI官网:https://devui.design/home