Martin 是一款由 MapLibre 社区维护的超快速且轻量级的地理空间地图瓦片服务器。它主要使用 Rust 语言编写,旨在提供极高性能的实时瓦片渲染和分发服务,是当前开源 GIS 领域中 Windshaft 的主要现代替代方案之一。
核心功能与特性:
多源支持: 能够实时从 PostGIS 数据库(表、视图、自定义函数)生成矢量瓦片,并支持直接读取本地或远程(通过 HTTP/S3)的 PMTiles 和 MBTiles 文件。
极致性能: 相比于基于 Node.js 的 Windshaft 或基于 Go 的同类工具,Martin 凭借 Rust 的非阻塞异步架构(基于 Actix-web)展现出极高的吞吐量和极低的延迟。
动态函数渲染: 它是极少数能直接利用 PostGIS 自定义函数生成瓦片的服务器,允许开发者在 URL 中传递参数,实现服务器端的动态过滤和数据聚合。
生态集成: 完整支持 MapLibre 生态系统,能够动态生成字体(Fonts)、雪碧图(Sprites)和地图样式(Styles)。
多源合并: 允许将多个不同的数据源(例如一部分来自 PostGIS,一部分来自 PMTiles)组合成单一的瓦片源输出
github地址
https://github.com/maplibre/martin
文档
https://maplibre.org/martin/introduction.html
一、使用 Docker Compose 安装部署Martin
1.1 安装
为了方便管理环境变量和持久化配置,使用 docker-compose.yml。创建一个目录并进入,新建docker-compose.yml文件。
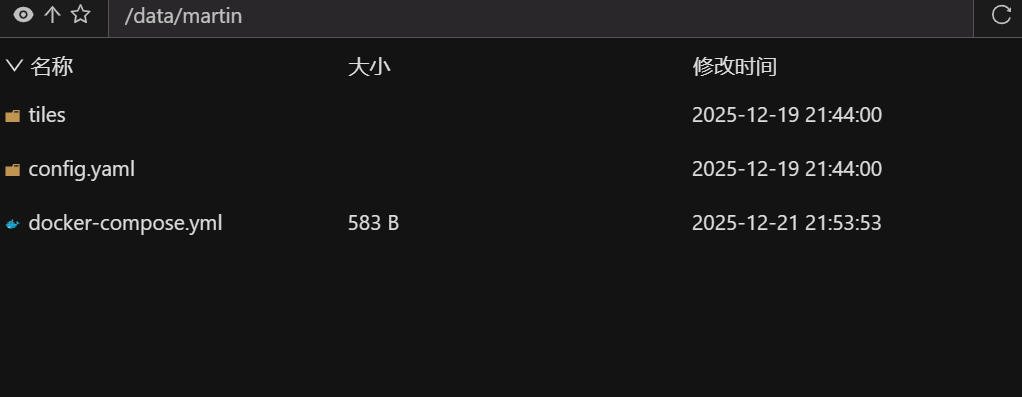
我这里已经安装了postgres,所以直连了,如果没有安装,可以配置postgres,统一安装管理。
version: '3.3'

services:
  martin:
    # 镜像地址
    image: swr.cn-north-4.myhuaweicloud.com/ddn-k8s/ghcr.io/maplibre/martin:latest
    container_name: martin-server
    network_mode: "host"
    environment:
      # 数据库连接字符串,格式:postgres://用户名:密码@数据库IP:5432/数据库名
      - DATABASE_URL=postgres://postgres:123456@127.0.0.1:5432/postgres
      # 开启监听所有 IP
      - WATCH_MODE=true
      - MARTIN_LISTEN_ADDRESSES=0.0.0.0:3000
    volumes:
      - ./tiles:/data
    # command 显式开启 Web UI,并指定扫描 /data 目录
    command: --webui enable-for-all /data
    restart: always
执行:
docker-compose up -d查看日志,看是否正常运行(若未安装成功,可以执行此命令,定位原因)
docker logs -f martin-server或者直接
docker
docker run -d --name martin-server -p 3000:3000 -e DATABASE_URL=postgres://用户名:密码@数据库IP:5432/数据库名 swr.cn-north-4.myhuaweicloud.com/ddn-k8s/ghcr.io/maplibre/martin:latest1.2 验证
查看状态和源列表
看到类似如下json文件,就说明成功了,
JSON
{
    "tiles": {
        "subway_station": {
            "content_type": "application/x-protobuf",
            "description": "public.subway_station.geom"
        },
        "state": {
            "content_type": "application/x-protobuf",
            "description": "tiger.state.the_geom"
        },
        "aoi": {
            "content_type": "application/x-protobuf",
            "description": "public.aoi.geom"
        },
        "subway_station_in_ex_port": {
            "content_type": "application/x-protobuf",
            "description": "public.subway_station_in_ex_port.geom"
        },
        "faces": {
            "content_type": "application/x-protobuf",
            "description": "tiger.faces.the_geom"
        }
    },
    "sprites": {},
    "fonts": {},
    "styles": {}
}
获取某个图层的元数
http://localhost:3000/subway_station
JSON
{
    "tilejson": "3.0.0",
    "tiles": [
        "http://localhost:3000/subway_station/{z}/{x}/{y}"
    ],
    "vector_layers": [
        {
            "id": "subway_station",
            "fields": {
                "Address": "varchar",
                "BELType": "int4",
                "Category": "varchar",
                "City": "varchar",
                "Code": "varchar",
                "District": "varchar",
                "Lat": "float8",
                "Lon": "float8",
                "MidType": "varchar",
                "Name_CHN": "varchar",
                "OBJECTID": "int4",
                "Province": "varchar",
                "SubType": "varchar",
                "TopType": "varchar",
                "id": "int4"
            }
        }
    ],
    "bounds": [
        87.449117,
        22.136547,
        126.742498,
        45.873099
    ],
    "description": "public.subway_station.geom",
    "name": "subway_station"
}
二、在地图中加载
Martin (矢量动态)将原始几何数据实时封装进矢量瓦片(MVT),由前端浏览器 (使用 MapLibre/Mapbox GL) 根据样式文件实时渲染出图像。
Martin(基于 Rust 的高性能切片服务器)通常生成的切片格式是 MVT (Mapbox Vector Tiles, .pbf),即矢量切片。由于 Leaflet 原生只支持栅格切片(图片),加载 Martin 的矢量切片需要借助插件。
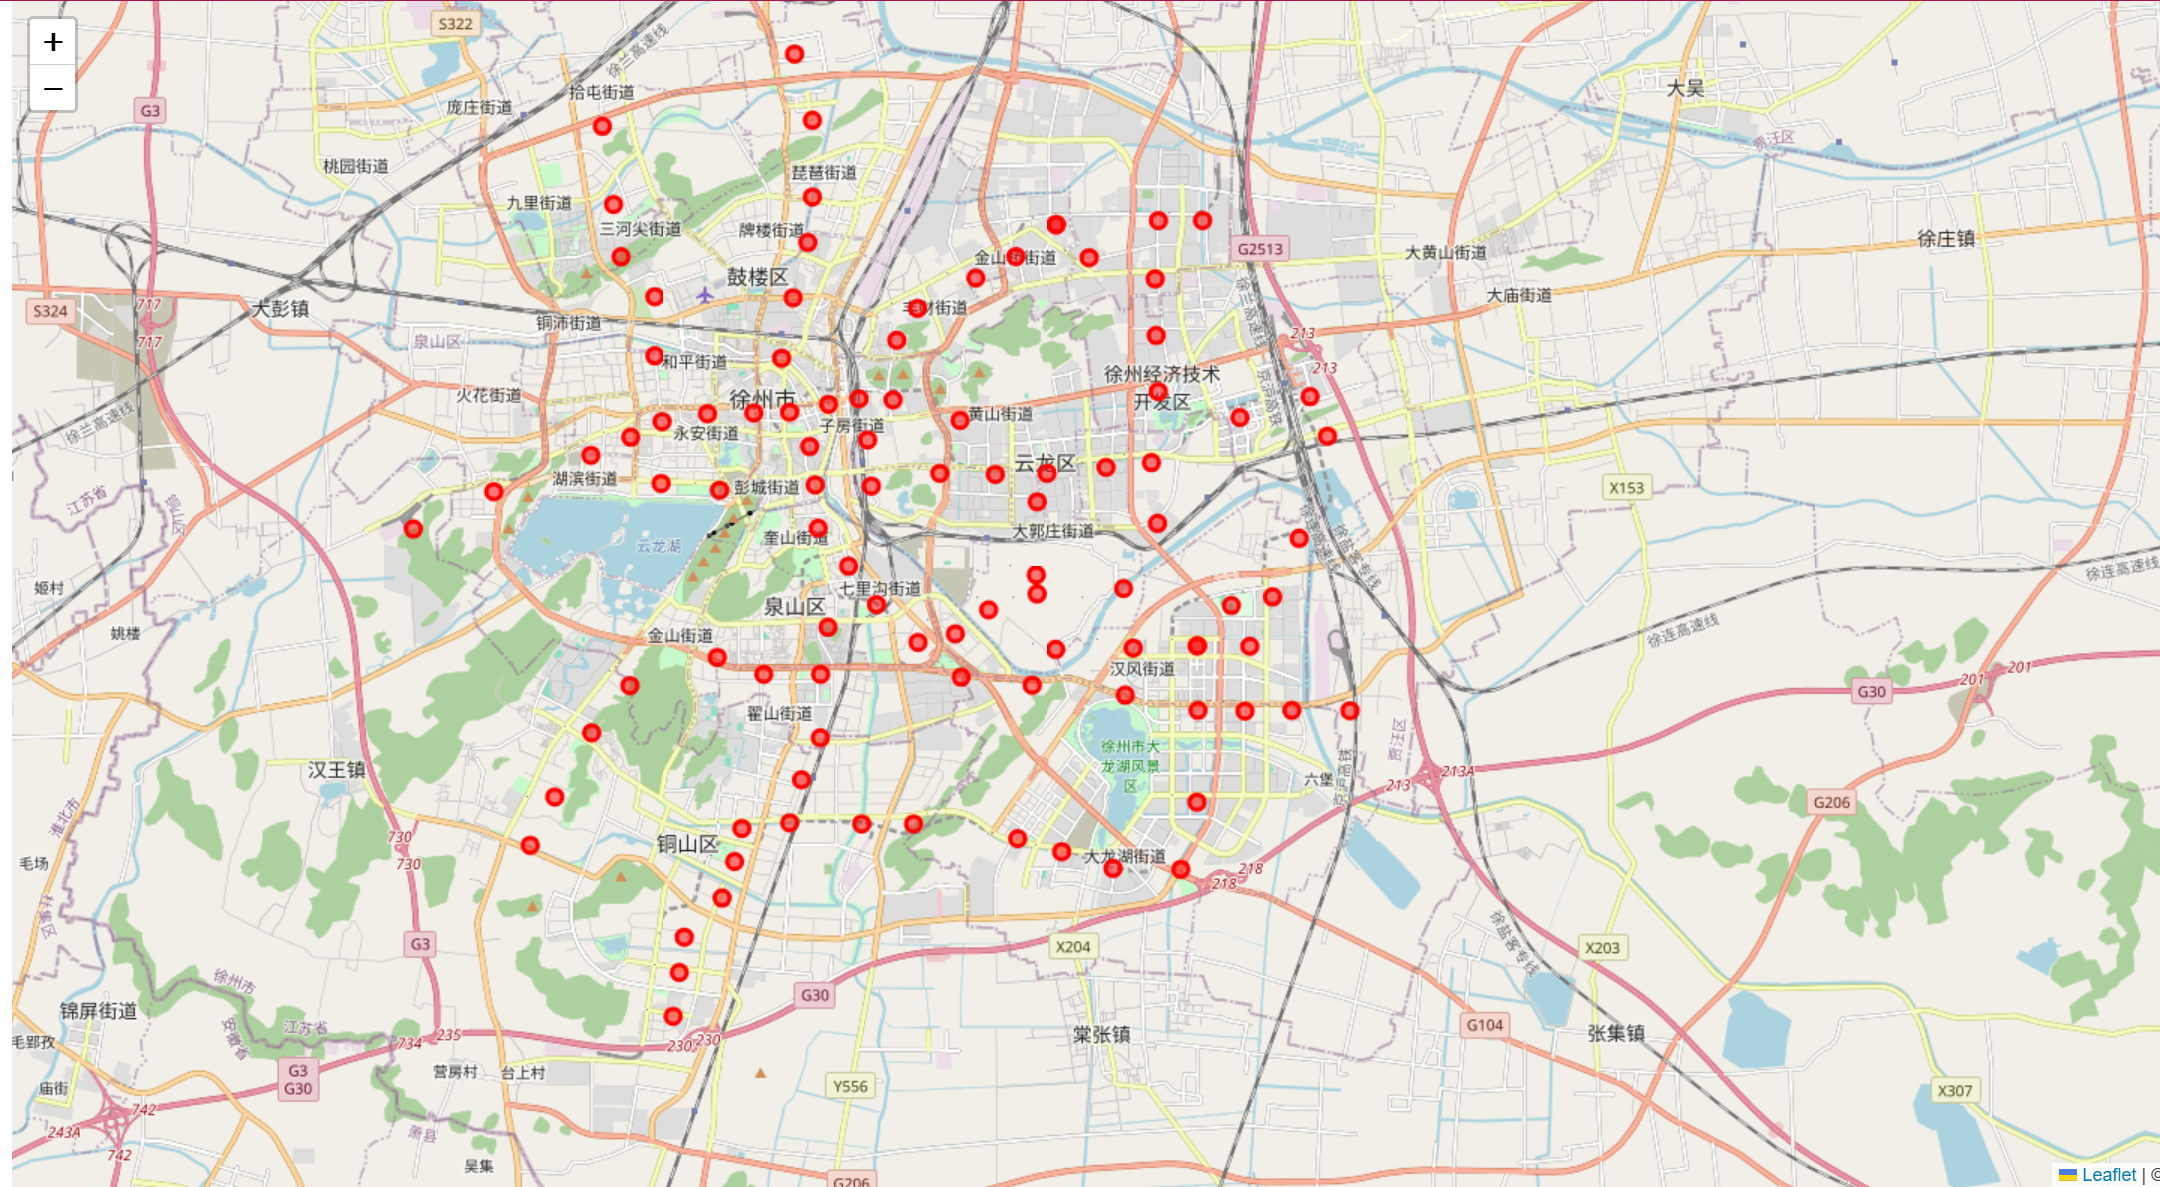
2.1 Leaflet.VectorGrid(最常用)
Leaflet.VectorGrid 是加载 Martin 矢量切片(PBF格式)的标准方式。
html
<!DOCTYPE html>
<html>
<head>
<title>map</title>
<link rel="stylesheet" href="https://cdnjs.cloudflare.com/ajax/libs/leaflet/1.9.4/leaflet.css" />
<script src="https://cdnjs.cloudflare.com/ajax/libs/leaflet/1.9.4/leaflet-src.min.js"></script>
<script src="https://unpkg.com/leaflet.vectorgrid@1.3.0/dist/Leaflet.VectorGrid.bundled.js"></script>
<style>
html,
body {
height: 100%;
width: 100%;
overflow: hidden;
}
#map {
height: 100%;
width: 100%;
}
</style>
</head>
<body>
<div id="map">
</div>
</body>
<script>
var map = L.map('map', {
center: [33.72577076, 118.6680564],
zoom: 13
});
L.tileLayer('https://{s}.tile.openstreetmap.org/{z}/{x}/{y}.png', { attribution: '©' }).addTo(map);
const martinUrl = 'http://loacalhost:3000/subway_station/{z}/{x}/{y}'
var vectorTileOptions = {
rendererFactory: L.canvas.tile, // 使用 Canvas 渲染
vectorTileLayerStyles: {
// 注意:这里的 key 必须是 Martin 提供的图层名(通常是数据库表名)
subway_station: {
color: '#ff0000',
fill: true,
fillColor: '#ff0000',
fillOpacity: 0.5,
radius: 5
}
},
interactive: true, // 允许点击等交互
getFeatureId: function(f) {
return f.properties.id; // 用于高效更新样式
}
};
var pbfLayer = L.vectorGrid.protobuf(martinUrl, vectorTileOptions).addTo(map);
// 交互示例:点击显示属性
pbfLayer.on('click', function(e) {
var properties = e.layer.properties;
L.popup()
.setLatLng(e.latlng)
.setContent("站名: " + (properties.name || "未知"))
.openOn(map);
});
</script>
</html>实际效果图
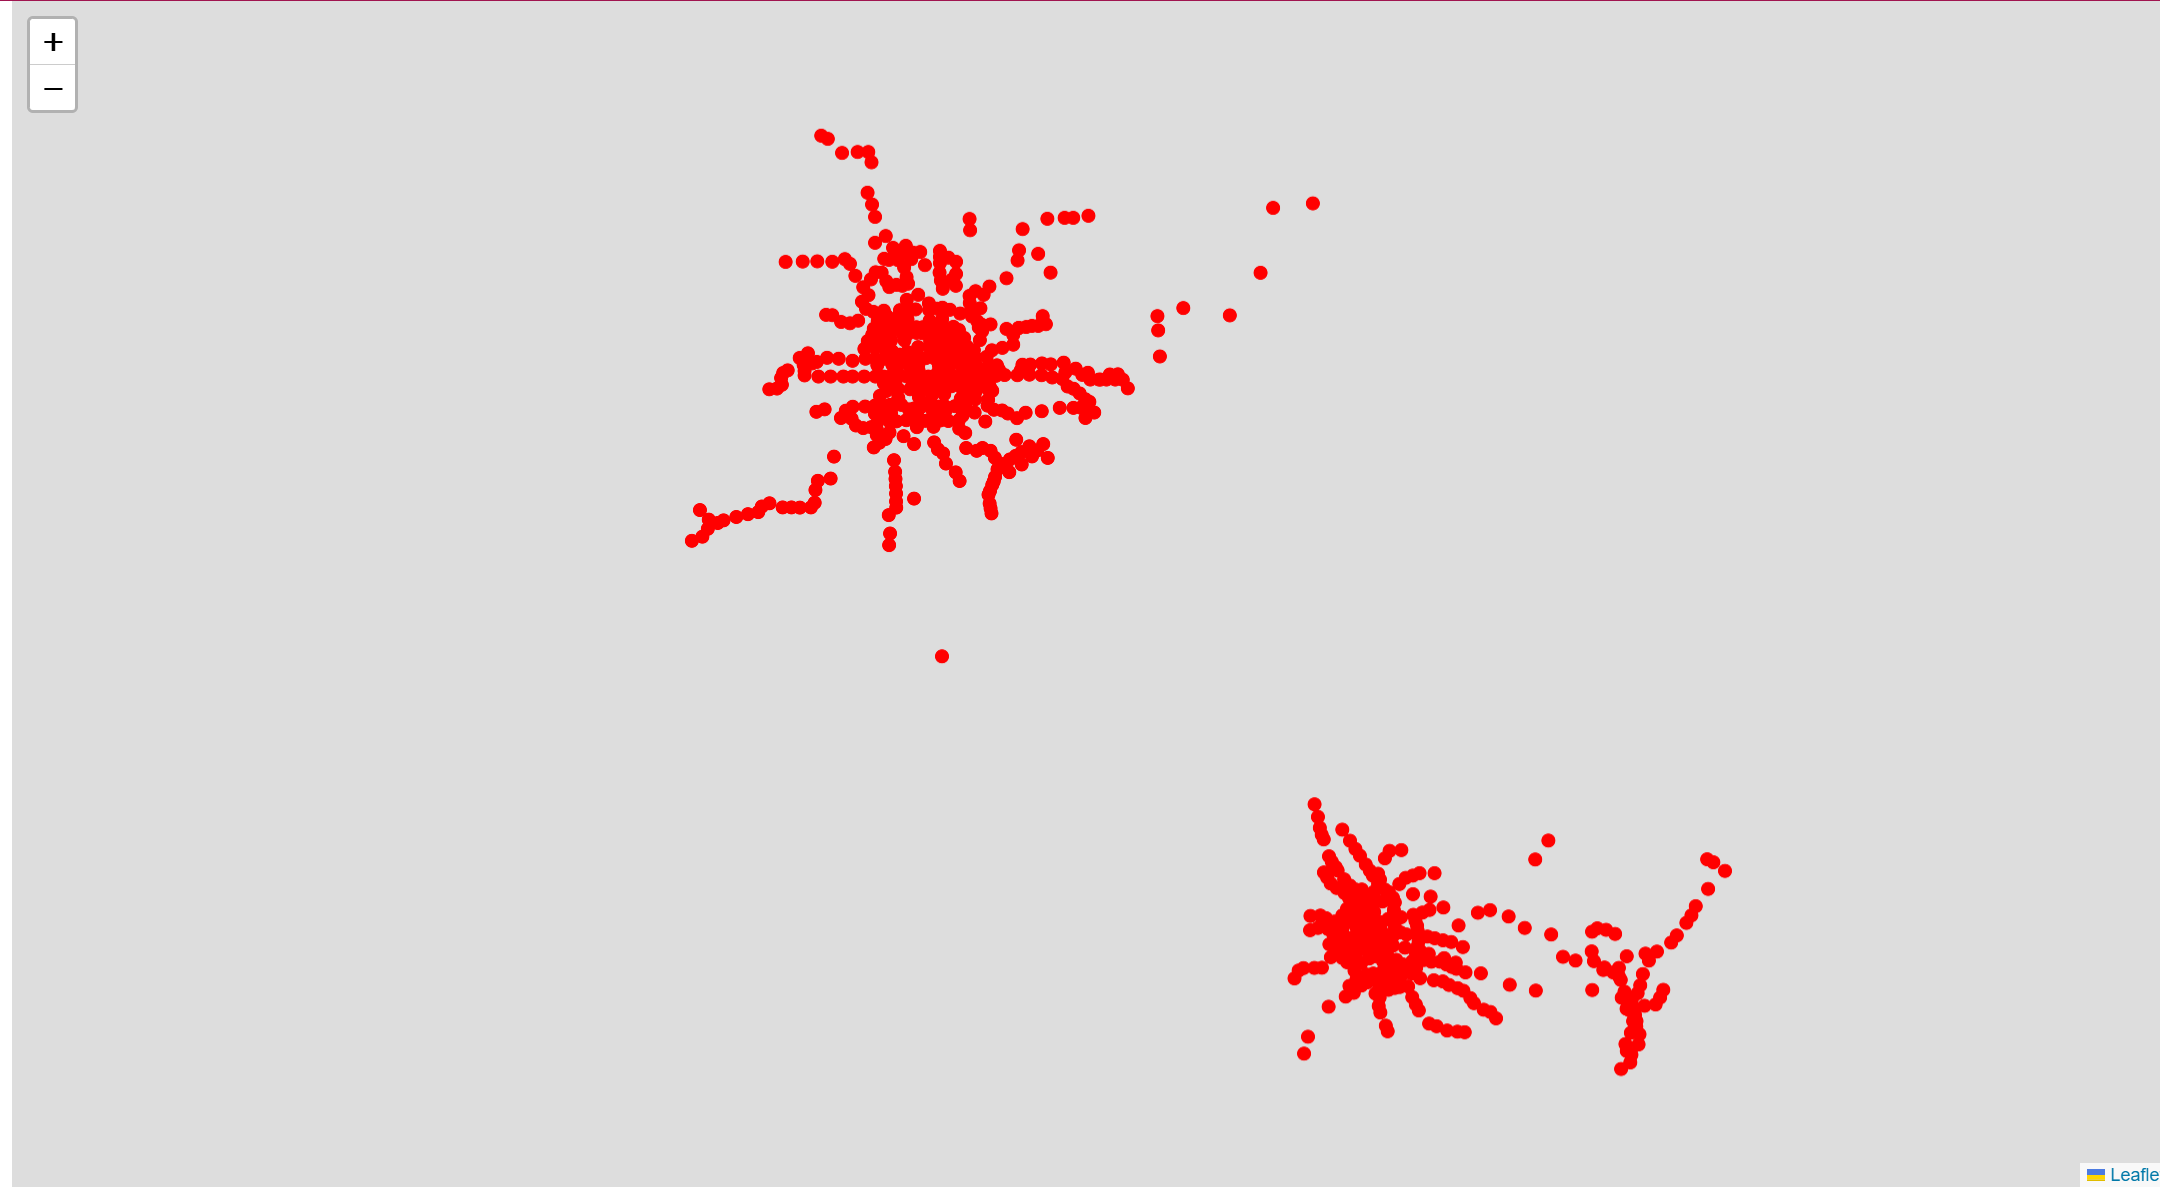
2.1 使用 MapLibre-Leaflet (性能最佳)
适用矢量数据非常庞大、复杂的样式(Mapbox Style JSON),使用 WebGL 渲染方案。
html
<!DOCTYPE html>
<html>
<head>
    <title>map</title>
	<link rel="stylesheet" href="https://unpkg.com/leaflet@1.9.4/dist/leaflet.css" />
    <link href="https://unpkg.com/maplibre-gl@3.x/dist/maplibre-gl.css" rel="stylesheet" />
	<script src="https://unpkg.com/leaflet@1.9.4/dist/leaflet.js"></script>
    <script src="https://unpkg.com/maplibre-gl@3.x/dist/maplibre-gl.js"></script>
    <script src="https://unpkg.com/@maplibre/maplibre-gl-leaflet/leaflet-maplibre-gl.js"></script>
    <style>
        html,
        body {
            height: 100%;
            width: 100%;
            overflow: hidden;
        }

        #map {
            height: 100%;
            width: 100%;
        }
    </style>
</head>

<body>
    <div id="map">
    </div>
</body>
<script>
var map = L.map('map').setView([39.9, 116.4], 10);
L.maplibreGL({
        style: {
            "version": 8,
            "sources": {
                "martin-source": {
                    "type": "vector",
                    "tiles": ["http://localhost:3000/subway_station/{z}/{x}/{y}"]
                }
            },
            "layers": [
                {
                    "id": "subway-layer",
                    "type": "circle",
                    "source": "martin-source",
                    "source-layer": "subway_station",
                    "filter": ["==", "Province", "河南省"],
                    "paint": {
                        "circle-color": "#ff0000",
                        "circle-radius": 5,
                        "circle-stroke-width": 2,
                        "circle-stroke-color": "#ffffff"
                    }
                }
            ]
        }
    }).addTo(map);
</script>
</html>
效果图