一、背景与挑战
在实际运维场景中,客户的业务系统部署在华为云,并使用了 ELB、GaussDB 等多种华为云产品。这些云产品的日志集中管理主要依赖华为云 LTS,但仅仅把日志存放在 LTS 中,难以实现:
- 全链路观测(日志、指标、链路数据统一)
- 智能检索与告警(跨集群、跨应用的日志分析)
- 和业务指标结合的可视化与追踪
观测云可以实现统一的全链路可观测,因此可以将 LTS 中的日志实时上报到观测云,实现日志与应用、基础设施、用户体验等一体化观测。
二、整体架构设计
日志采集链路推荐架构如下:
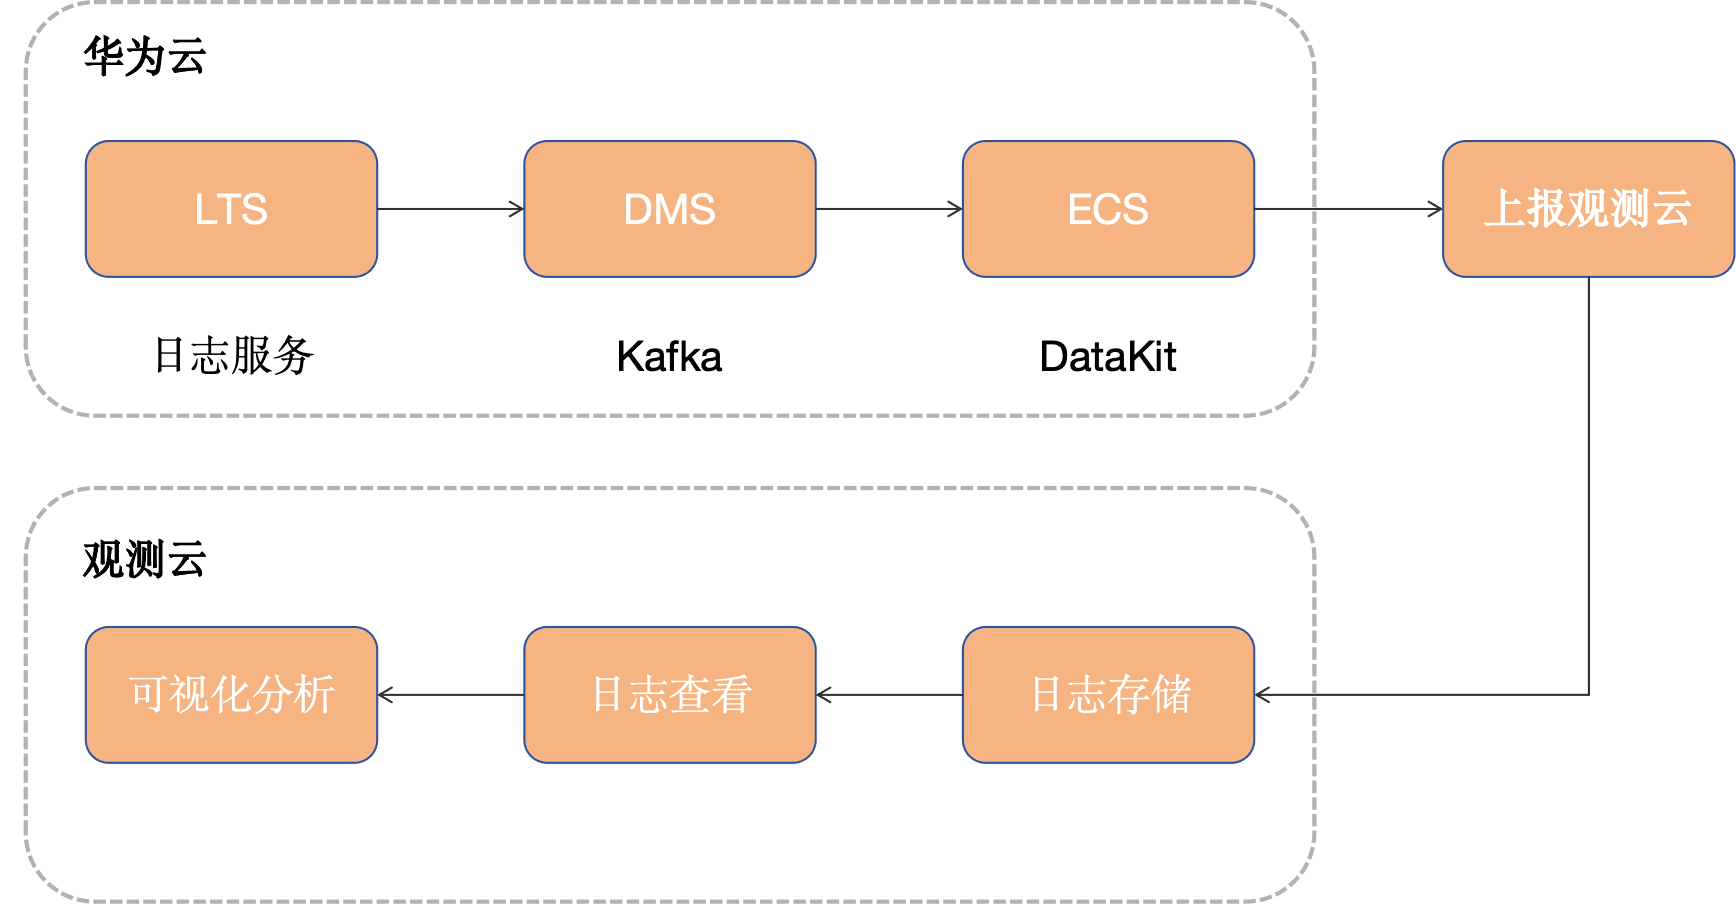
- LTS:负责日志收集与集中管理。
- DMS Kafka:作为高可靠消息通道,实现日志实时转储与解耦。
- DataKit Kafka Input:部署在客户侧(如弹性云服务器),负责消费 Kafka 中日志并发送到观测云。
- 观测云:统一日志检索、查询分析、仪表盘展示、智能告警。
三、前置条件
- 在华为云上创建 DMS 和 LTS 服务
- 开通观测云账号
- DataKit 机器一台
四、配置步骤
步骤 1:在 LTS 中开启日志转储
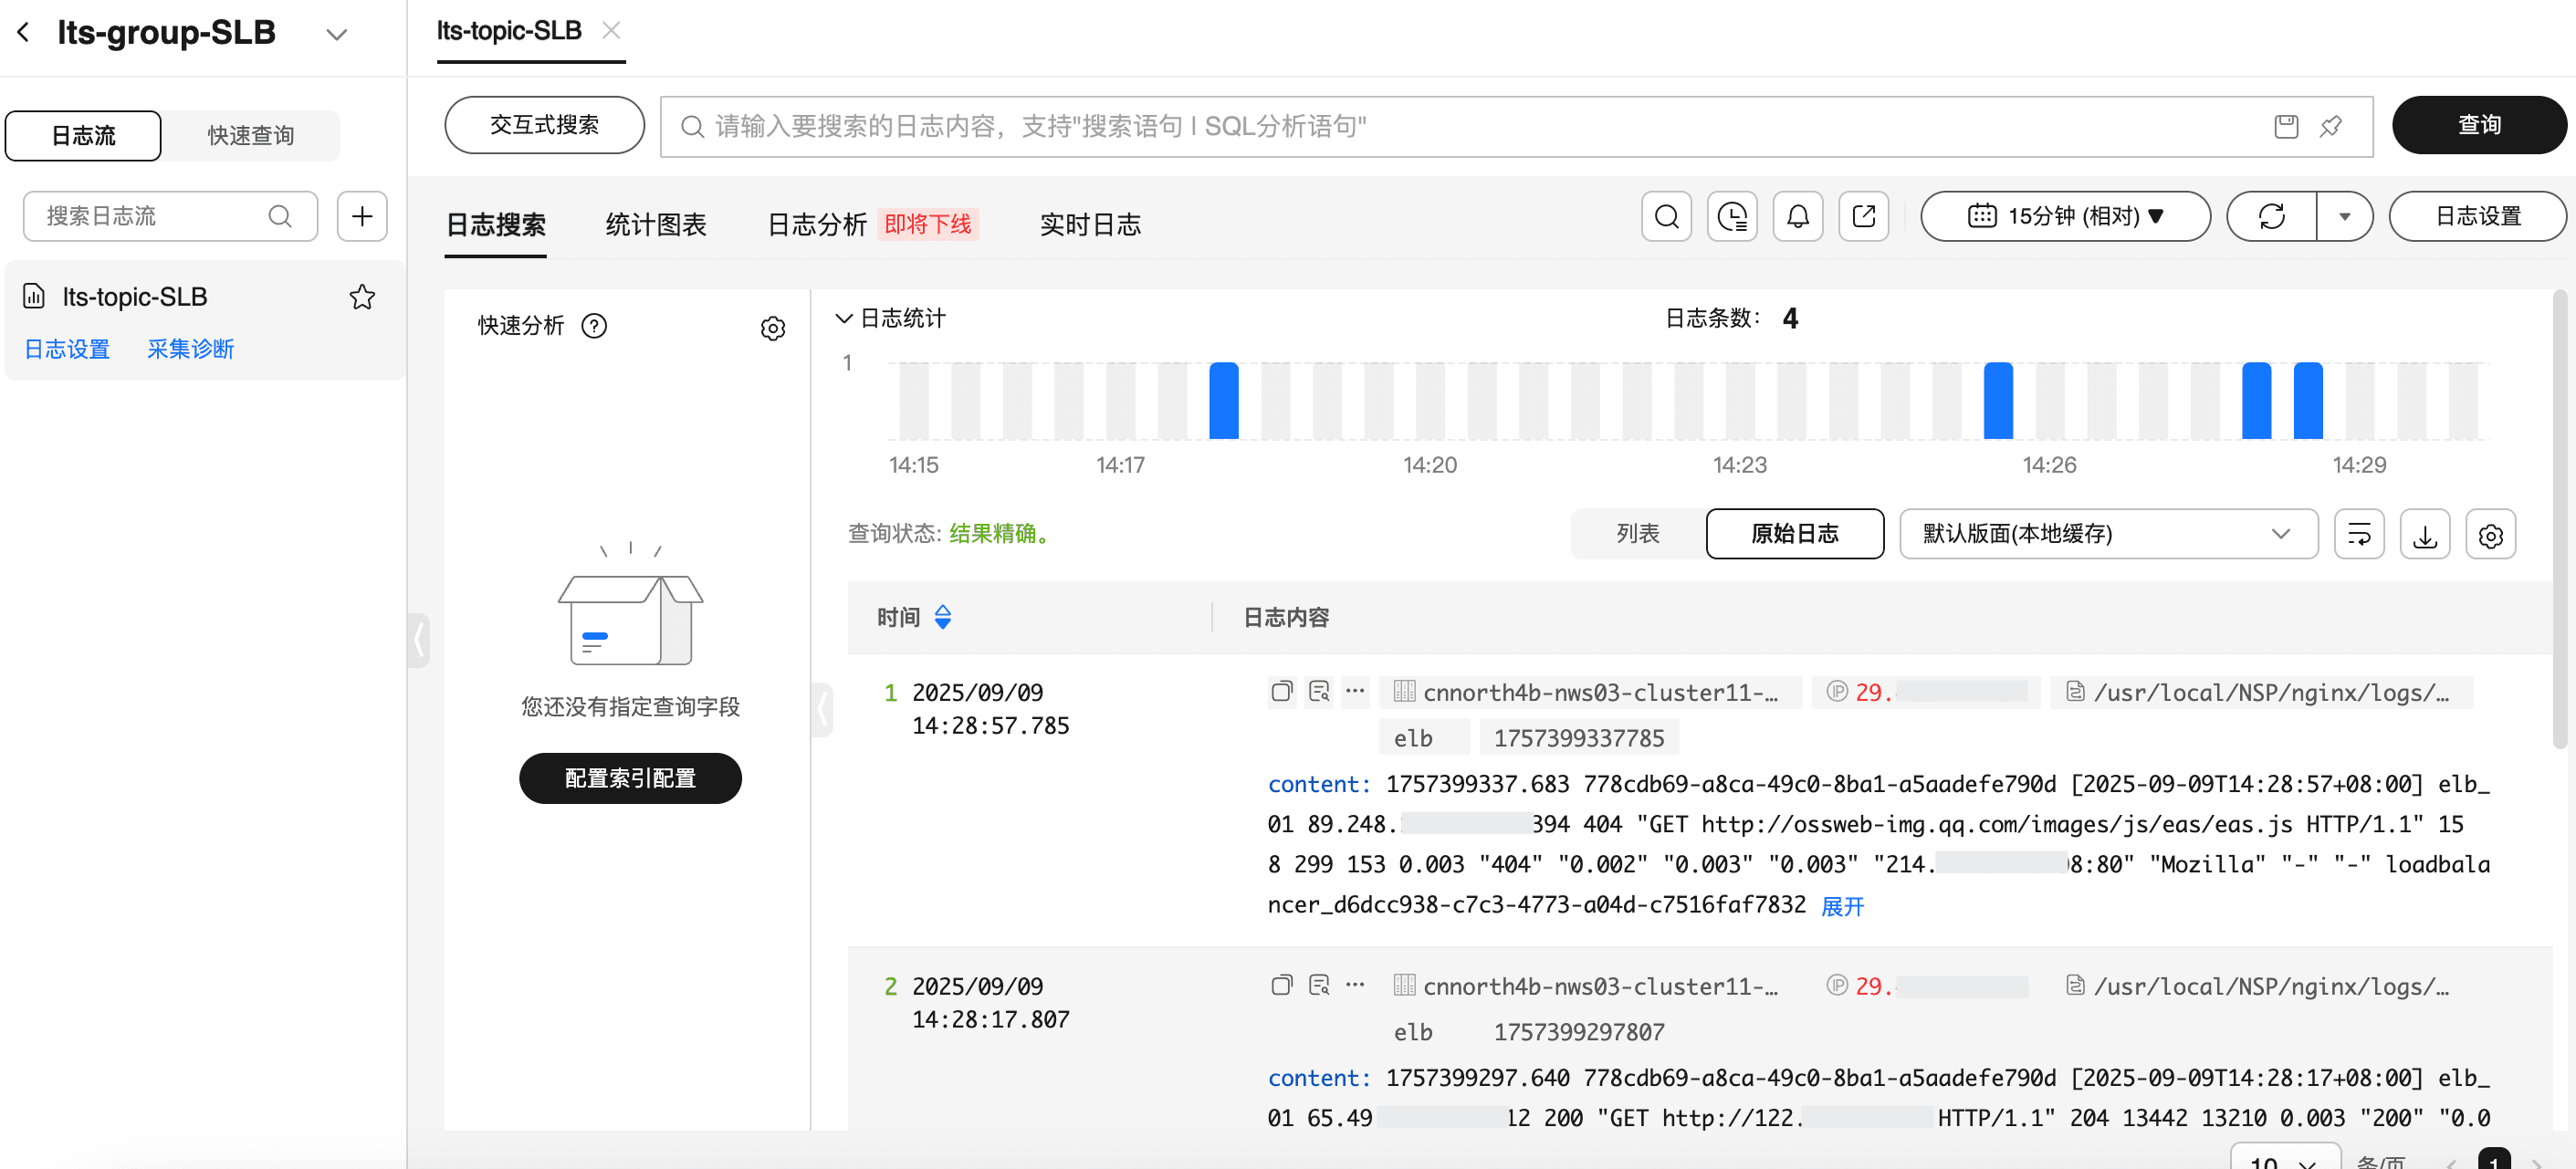
我们可以通过很多种方式把日志输出至 LTS 服务,本文以 华为云ELB日志为例,配置 ELB日志存储至 LTS ,配置完成之后我们可以查看在 LTS 日志组中是否有日志产生。
1、登录华为云控制台 → LTS控制台。
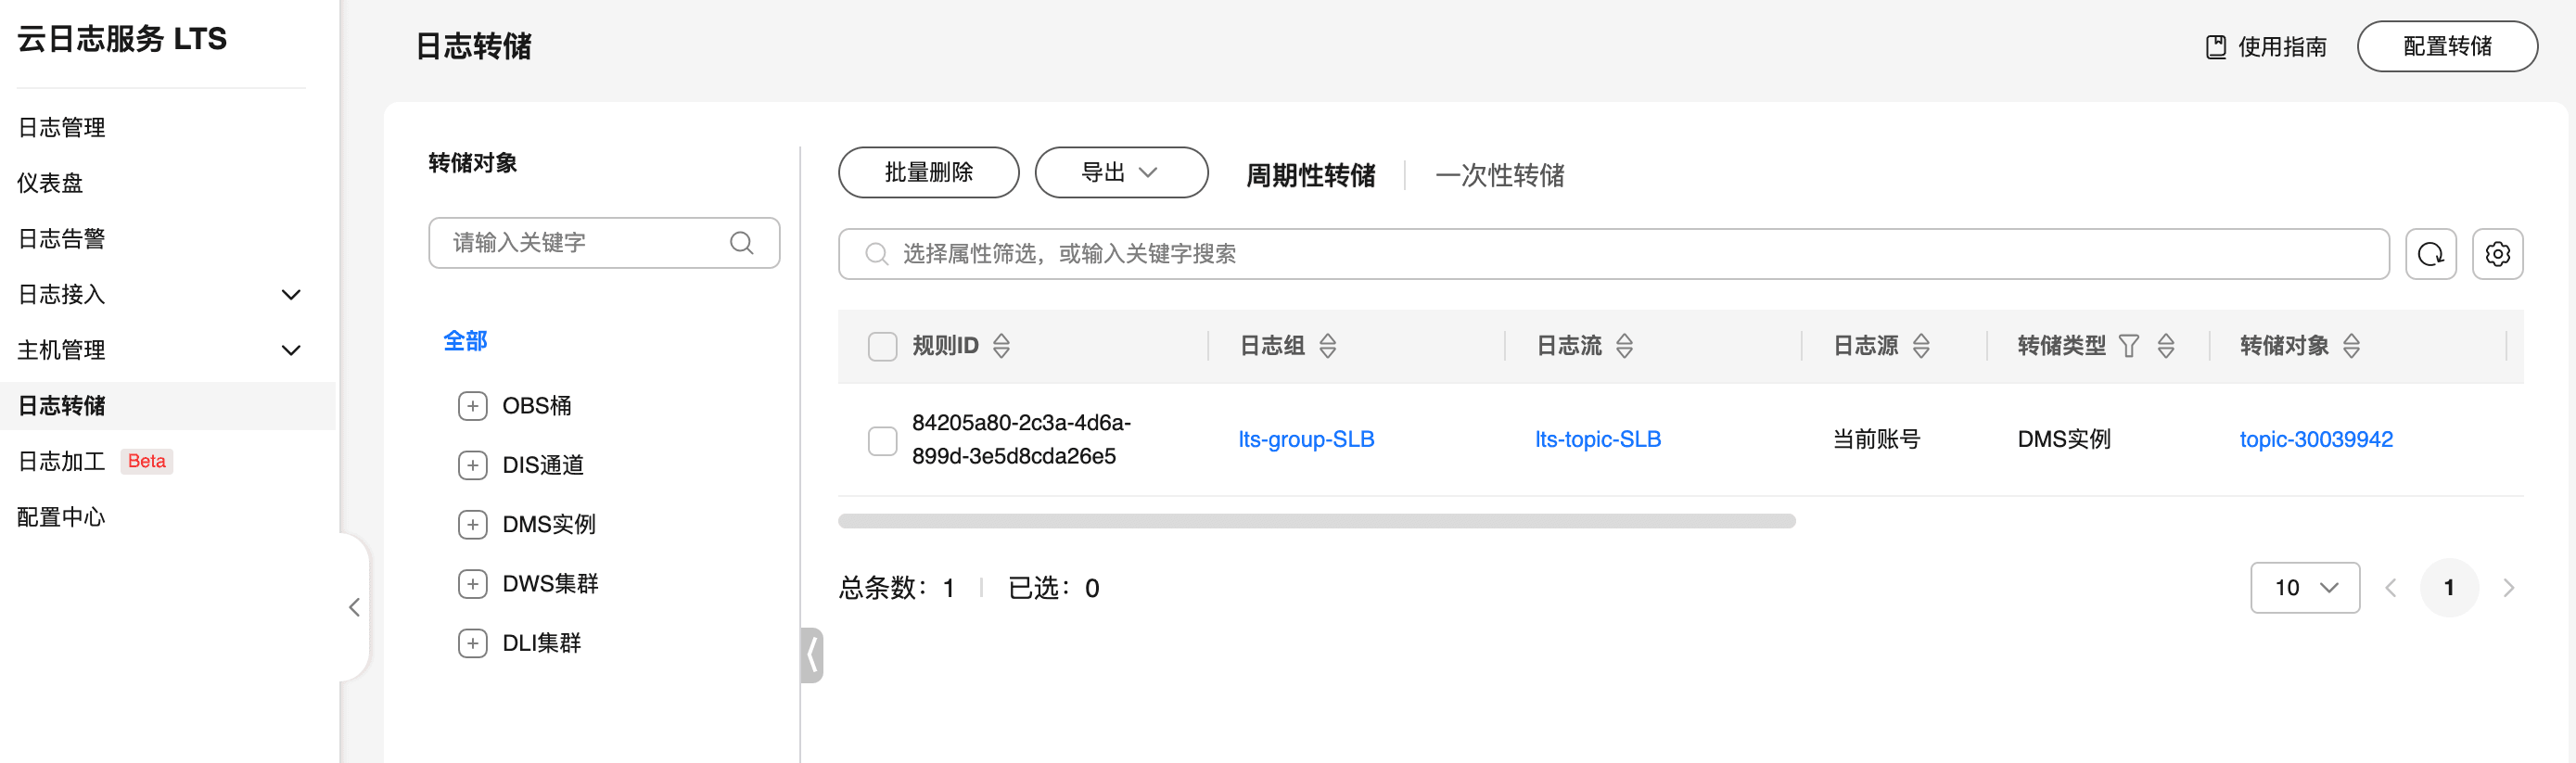
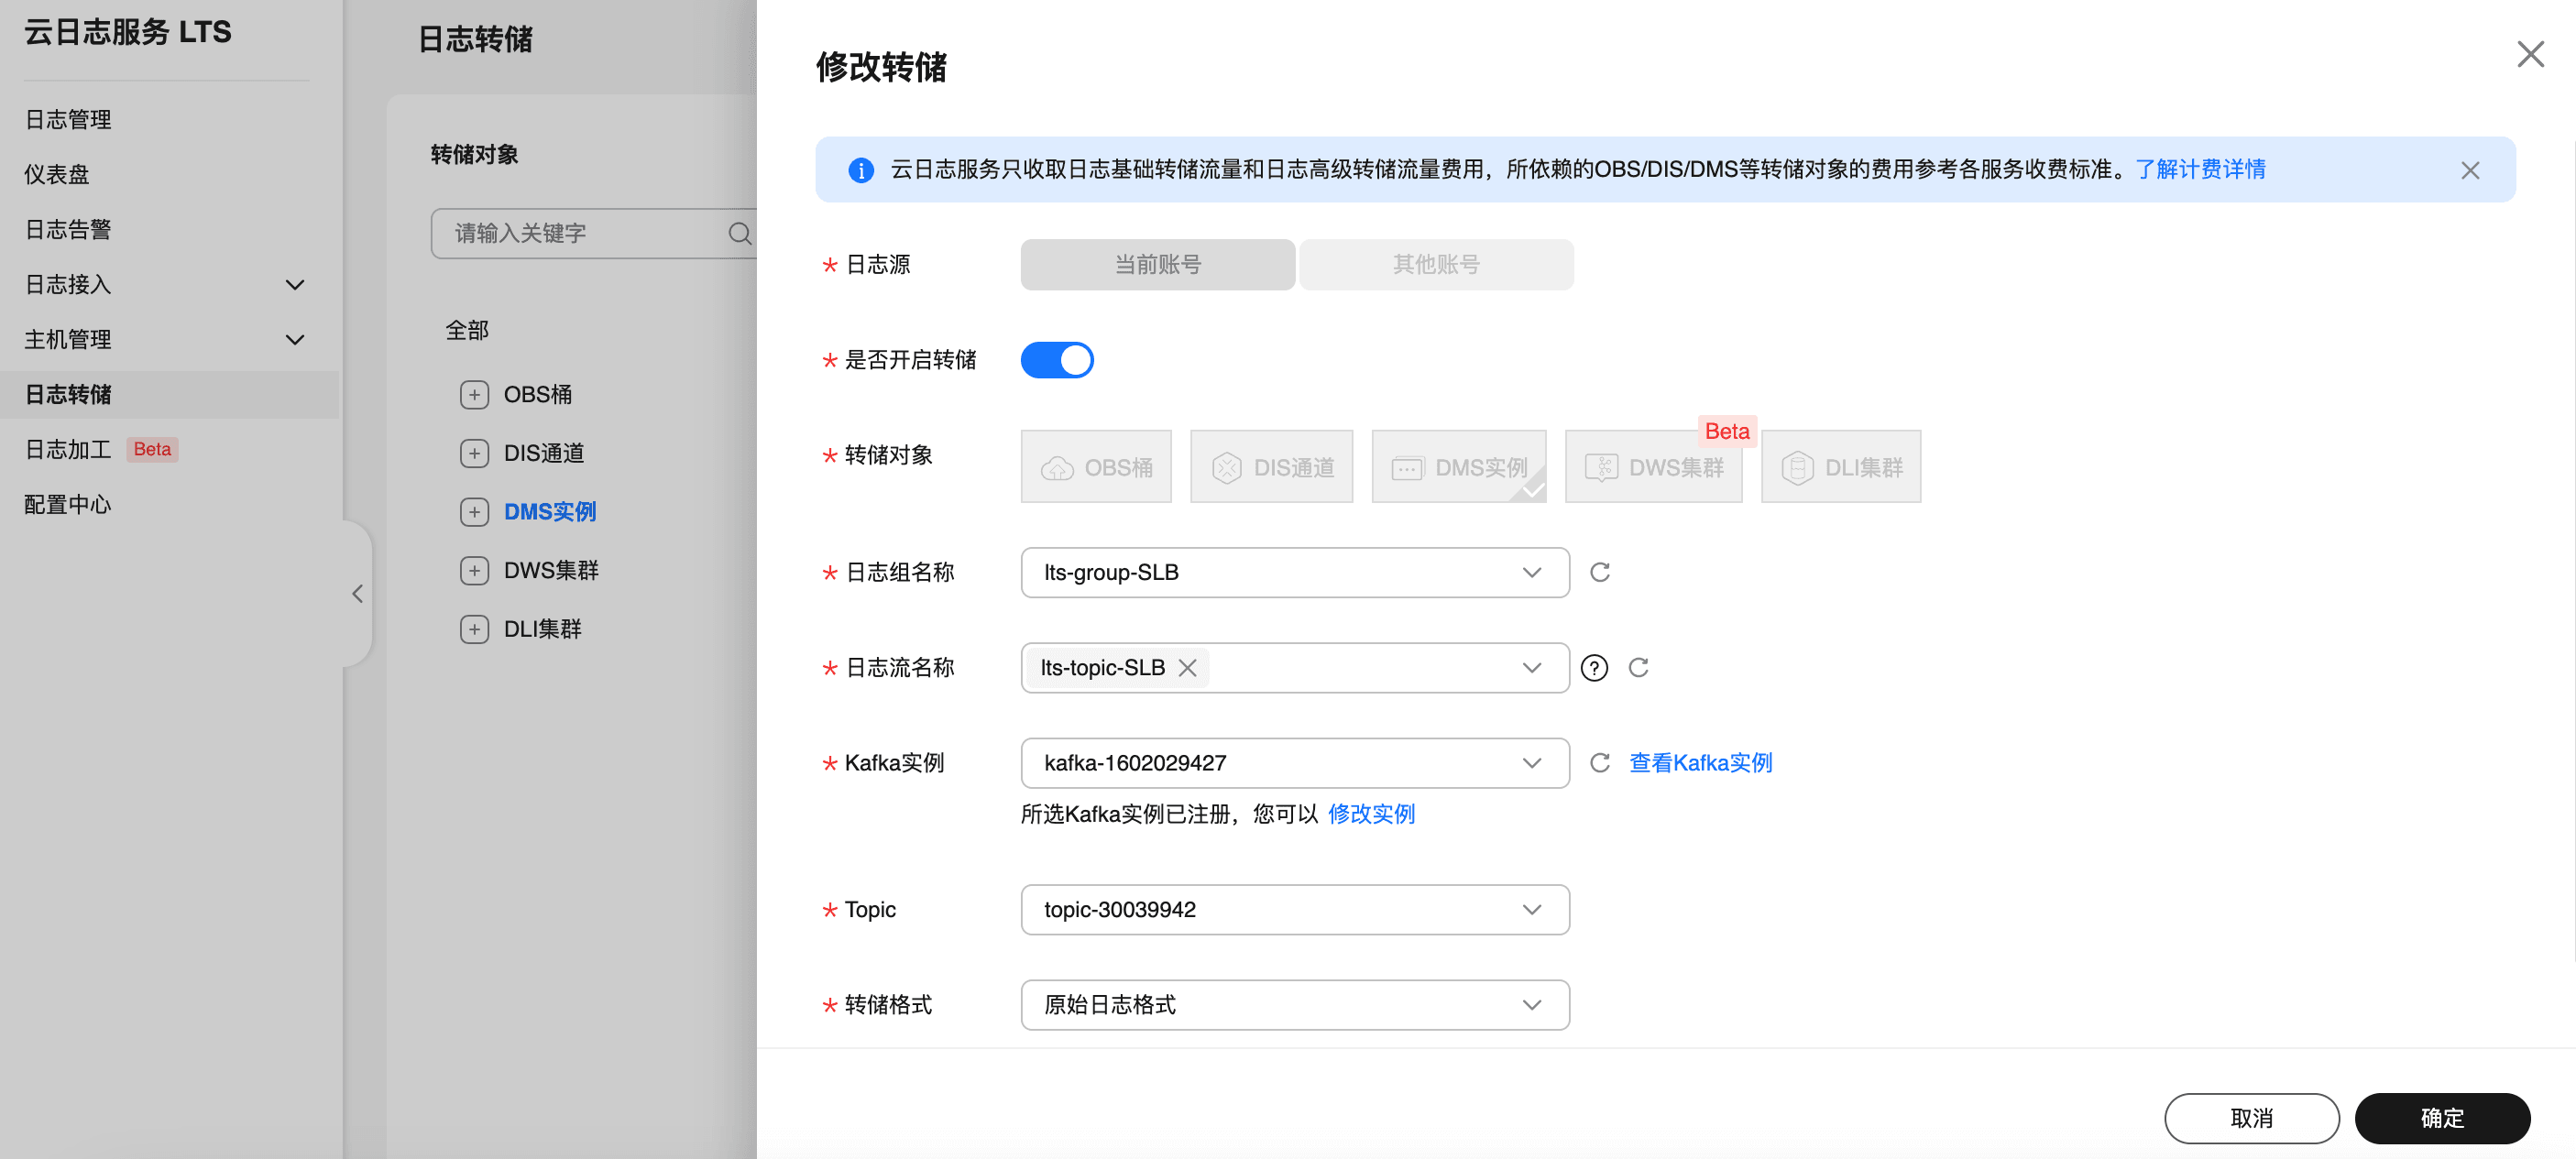
2、点击 "日志转储"。
3、配置转储目标:选择 DMS 作为转储对象,并设置实施转储,设置要转储的日志组和日志流名称,以及 DMS 实例和 topic。
步骤 2:部署 DataKit
在需要采集的环境中(如 ECS),安装 DataKit。
# 需要把token 改成观测云空间的实际token值(可在观测云控制台-->集成-->Datakit 上面获取)
DK_DATAWAY="https://openway.guance.com?token=tkn_xxxxxx" bash -c "$(curl -L https://static.guance.com/datakit/install.sh)"
步骤 3:开启 KafkaMQ 采集器
进入 DataKit 安装目录下(默认是 /usr/local/datakit/conf.d/ )的 conf.d/kafkamq 目录,复制 kafkamq.conf.sample 并命名为 kafkamq.conf。类似如下:
-rwxr-xr-x 1 root root 2574 Apr 30 23:52 kafkamq.conf
-rwxr-xr-x 1 root root 2579 May  1 00:40 kafkamq.conf.sample
调整 kafkamq 采集器配置如下:
- addrs = "192.168.0.106:9092"。
- kafka_version = "3.0.0",该文使用 Kafka 的版本。
- inputs.kafkamq.custom,删除注释符号"#"。
- inputs.kafkamq.custom.log_topic_map,删除注释符号"#"。
- "topic-30039942"="topicSLB.p",topic-30039942 为 Topic 的名字,topicSLB.p为观测云 Pipeline 可编程数据处理器的日志字段提取规则配置。涉及的业务日志和 topicSLB.p 的内容详细见下面的《使用 Pipeline》。
- 其他一些配置说明:
-
group_id = "datakit-group":消费者组名称,相同组内消费者共享分区消费进度。不同消费者组可独立消费同一主题
-
assignor = "roundrobin":分区轮询分配给消费者,适合组内消费者订阅相同主题列表,实现负载均衡
{"version": "1.81.1", "desc": "do NOT edit this line"}
[[inputs.kafkamq]]
addrs = ["192.168.0.106:9092"]your kafka version:0.8.2 ~ 3.2.0
kafka_version = "3.0.0"
group_id = "datakit-group"consumer group partition assignment strategy (range, roundrobin, sticky)
assignor = "roundrobin"
rate limit.
#limit_sec = 100
sample
sampling_rate = 1.0
kafka tls config
tls_enable = true
PLAINTEXT/SASL_SSL/SASL_PLAINTEXT
tls_security_protocol = "SASL_PLAINTEXT"
PLAIN/SCRAM-SHA-256/SCRAM-SHA-512/OAUTHBEARER,default is PLAIN.
tls_sasl_mechanism = "PLAIN"
tls_sasl_plain_username = "user"
tls_sasl_plain_password = "pw"
If tls_security_protocol is SASL_SSL, then ssl_cert must be configured.
ssl_cert = "/path/to/host.cert"
-1:Offset Newest, -2:Offset Oldest
offsets=-1
skywalking custom
#[inputs.kafkamq.skywalking]
Required: send to datakit skywalking input.
dk_endpoint="http://localhost:9529"
thread = 8
topics = [
"skywalking-metrics",
"skywalking-profilings",
"skywalking-segments",
"skywalking-managements",
"skywalking-meters",
"skywalking-logging",
]
namespace = ""
Jaeger from kafka. Please make sure your Datakit Jaeger collector is open!
#[inputs.kafkamq.jaeger]
Required: ipv6 is "[::1]:9529"
dk_endpoint="http://localhost:9529"
thread = 8
source: agent,otel,others...
source = "agent"
# Required: topics
topics=["jaeger-spans","jaeger-my-spans"]
user custom message with PL script.
[inputs.kafkamq.custom]
#spilt_json_body = true
#thread = 8
#storage_index = "" # NOTE: only working on logging collection## spilt_topic_map determines whether to enable log splitting for specific topic based on the values in the spilt_topic_map[topic]. #[inputs.kafkamq.custom.spilt_topic_map] # "log_topic"=true # "log01"=false [inputs.kafkamq.custom.log_topic_map] "topic-30039942"="topicSLB.p" # "log01"="log_01.p" #[inputs.kafkamq.custom.metric_topic_map] # "metric_topic"="metric.p" # "metric01"="rum_apm.p" #[inputs.kafkamq.custom.rum_topic_map] # "rum_topic"="rum_01.p" # "rum_02"="rum_02.p"#[inputs.kafkamq.remote_handle]
## Required
#endpoint="http://localhost:8080"
## Required topics
#topics=["spans","my-spans"]
# send_message_count = 100
# debug = false
# is_response_point = true
# header_check = falseReceive and consume OTEL data from kafka.
#[inputs.kafkamq.otel]
#dk_endpoint="http://localhost:9529"
#trace_api="/otel/v1/traces"
#metric_api="/otel/v1/metrics"
#trace_topics=["trace1","trace2"]
#metric_topics=["otel-metric","otel-metric1"]
#thread = 8todo: add other input-mq
-
步骤 4:重启 DataKit 生效
datakit service -R步骤 5:在观测云验证日志接入
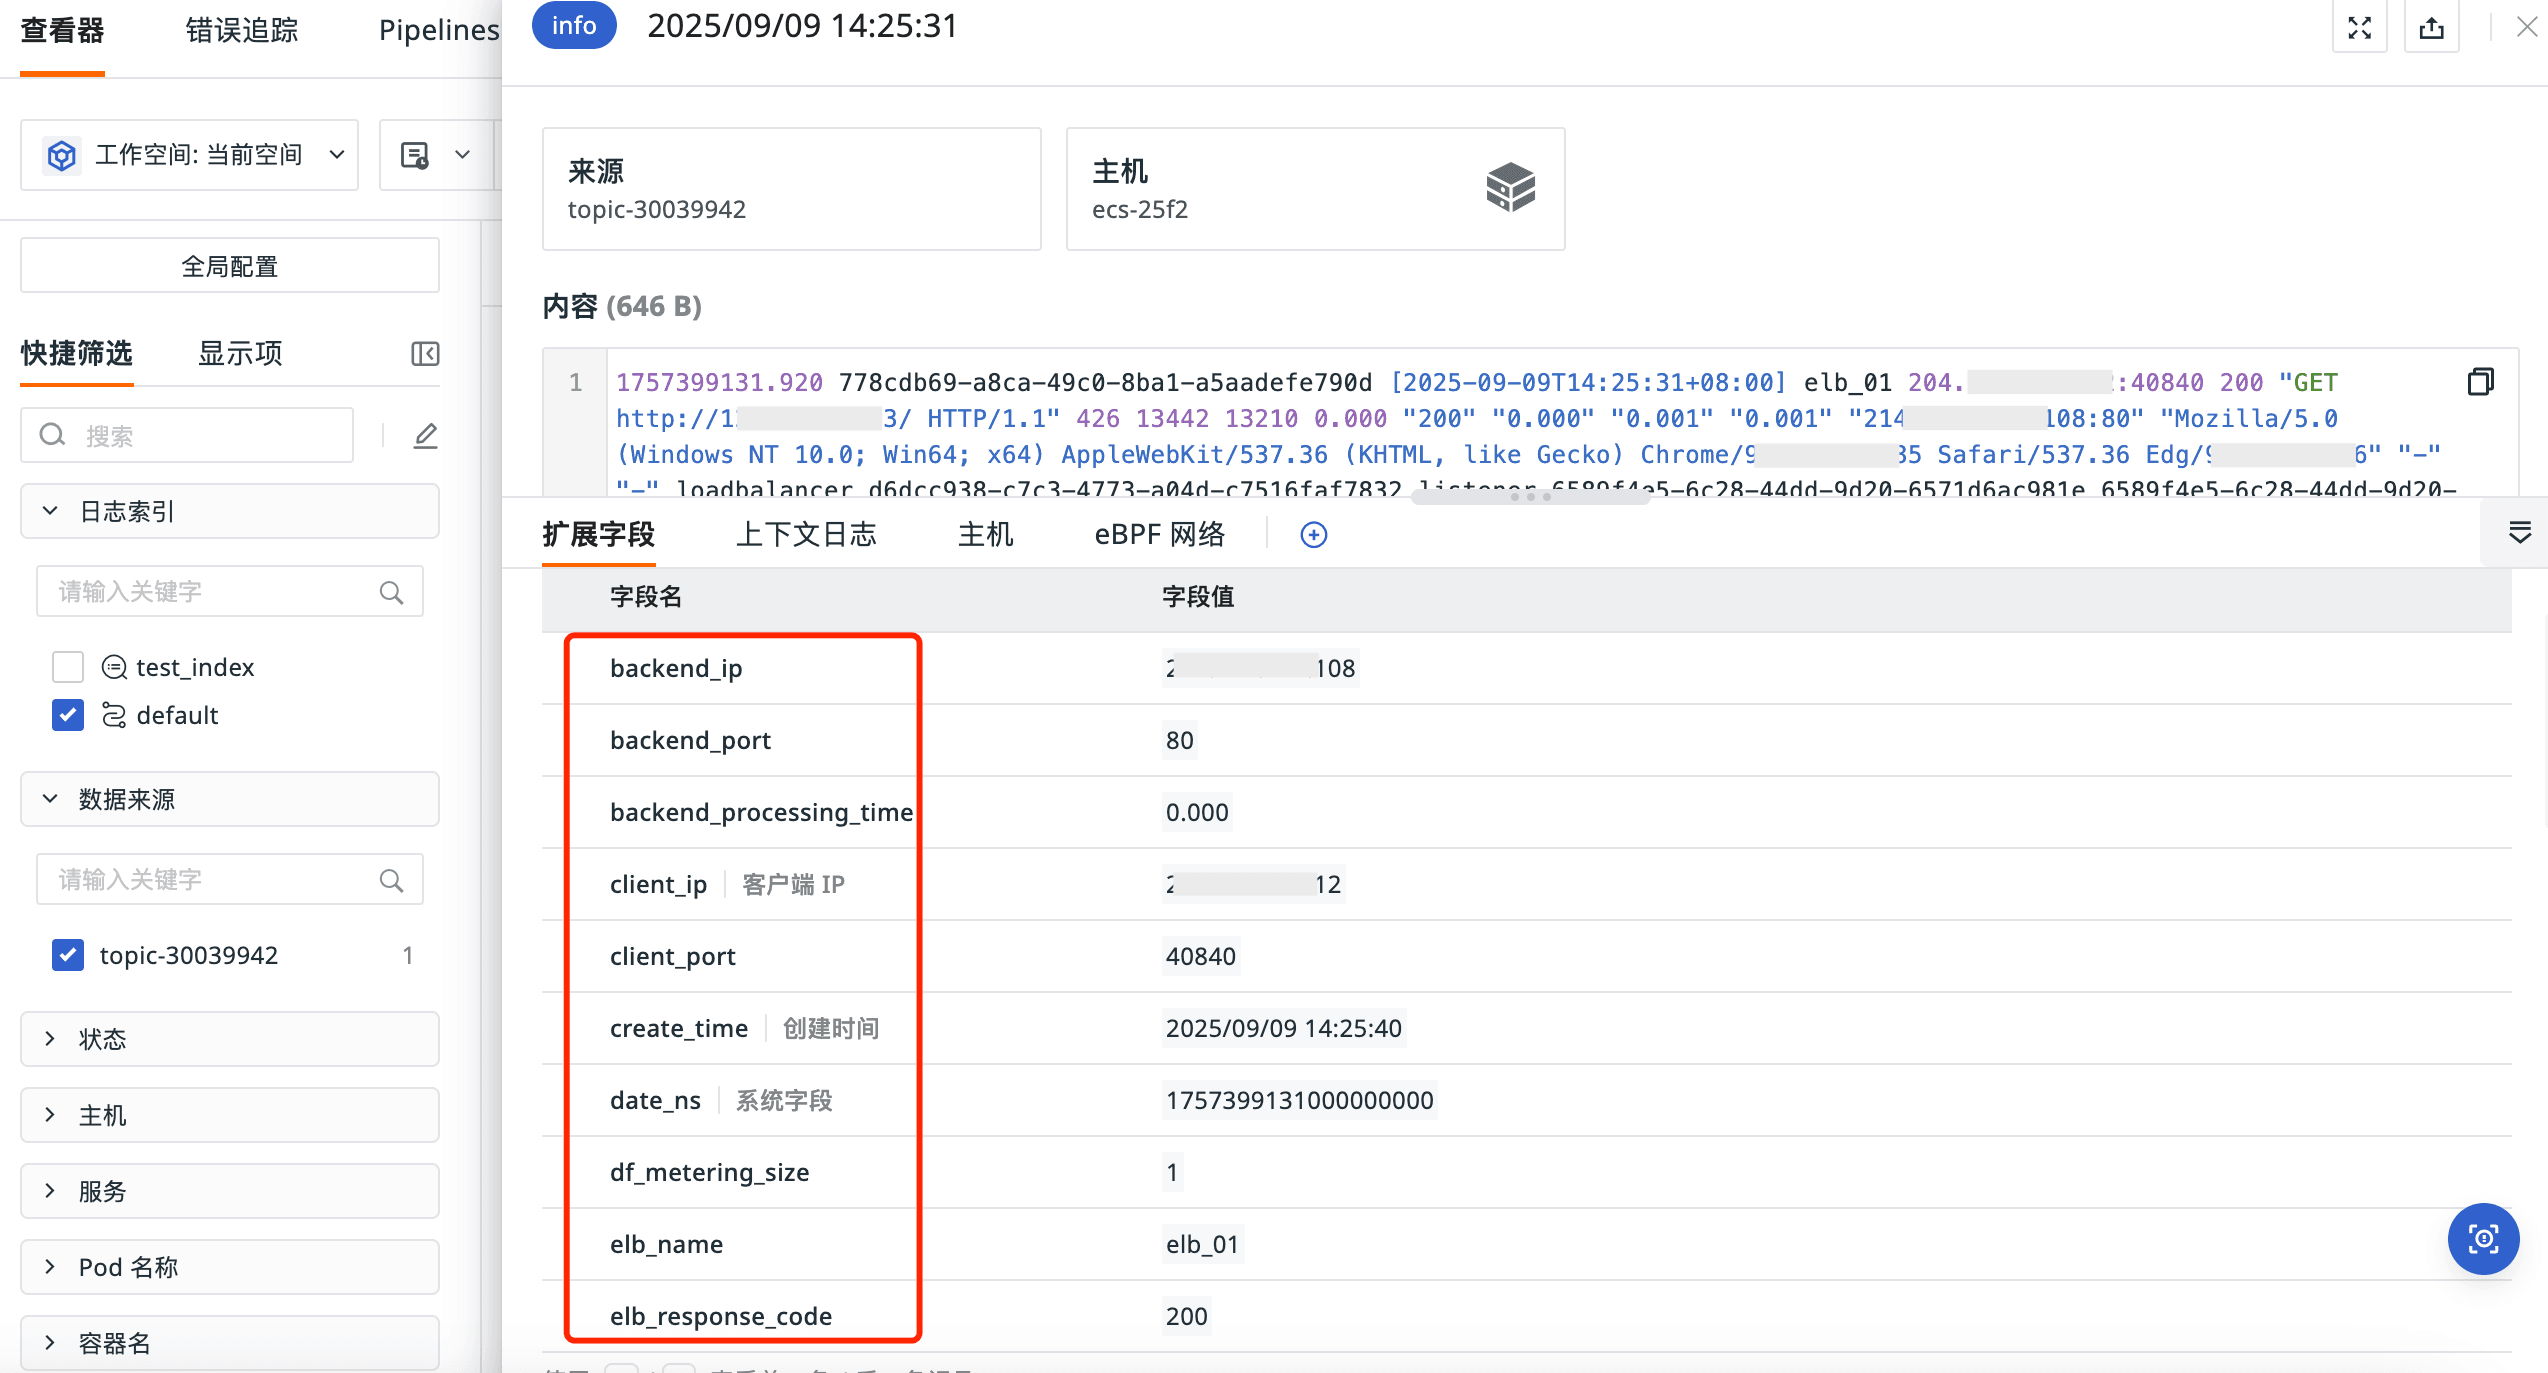
1、登录观测云控制台 → 日志查看器 ,可以看到相关日志已经被采集到了观测云。
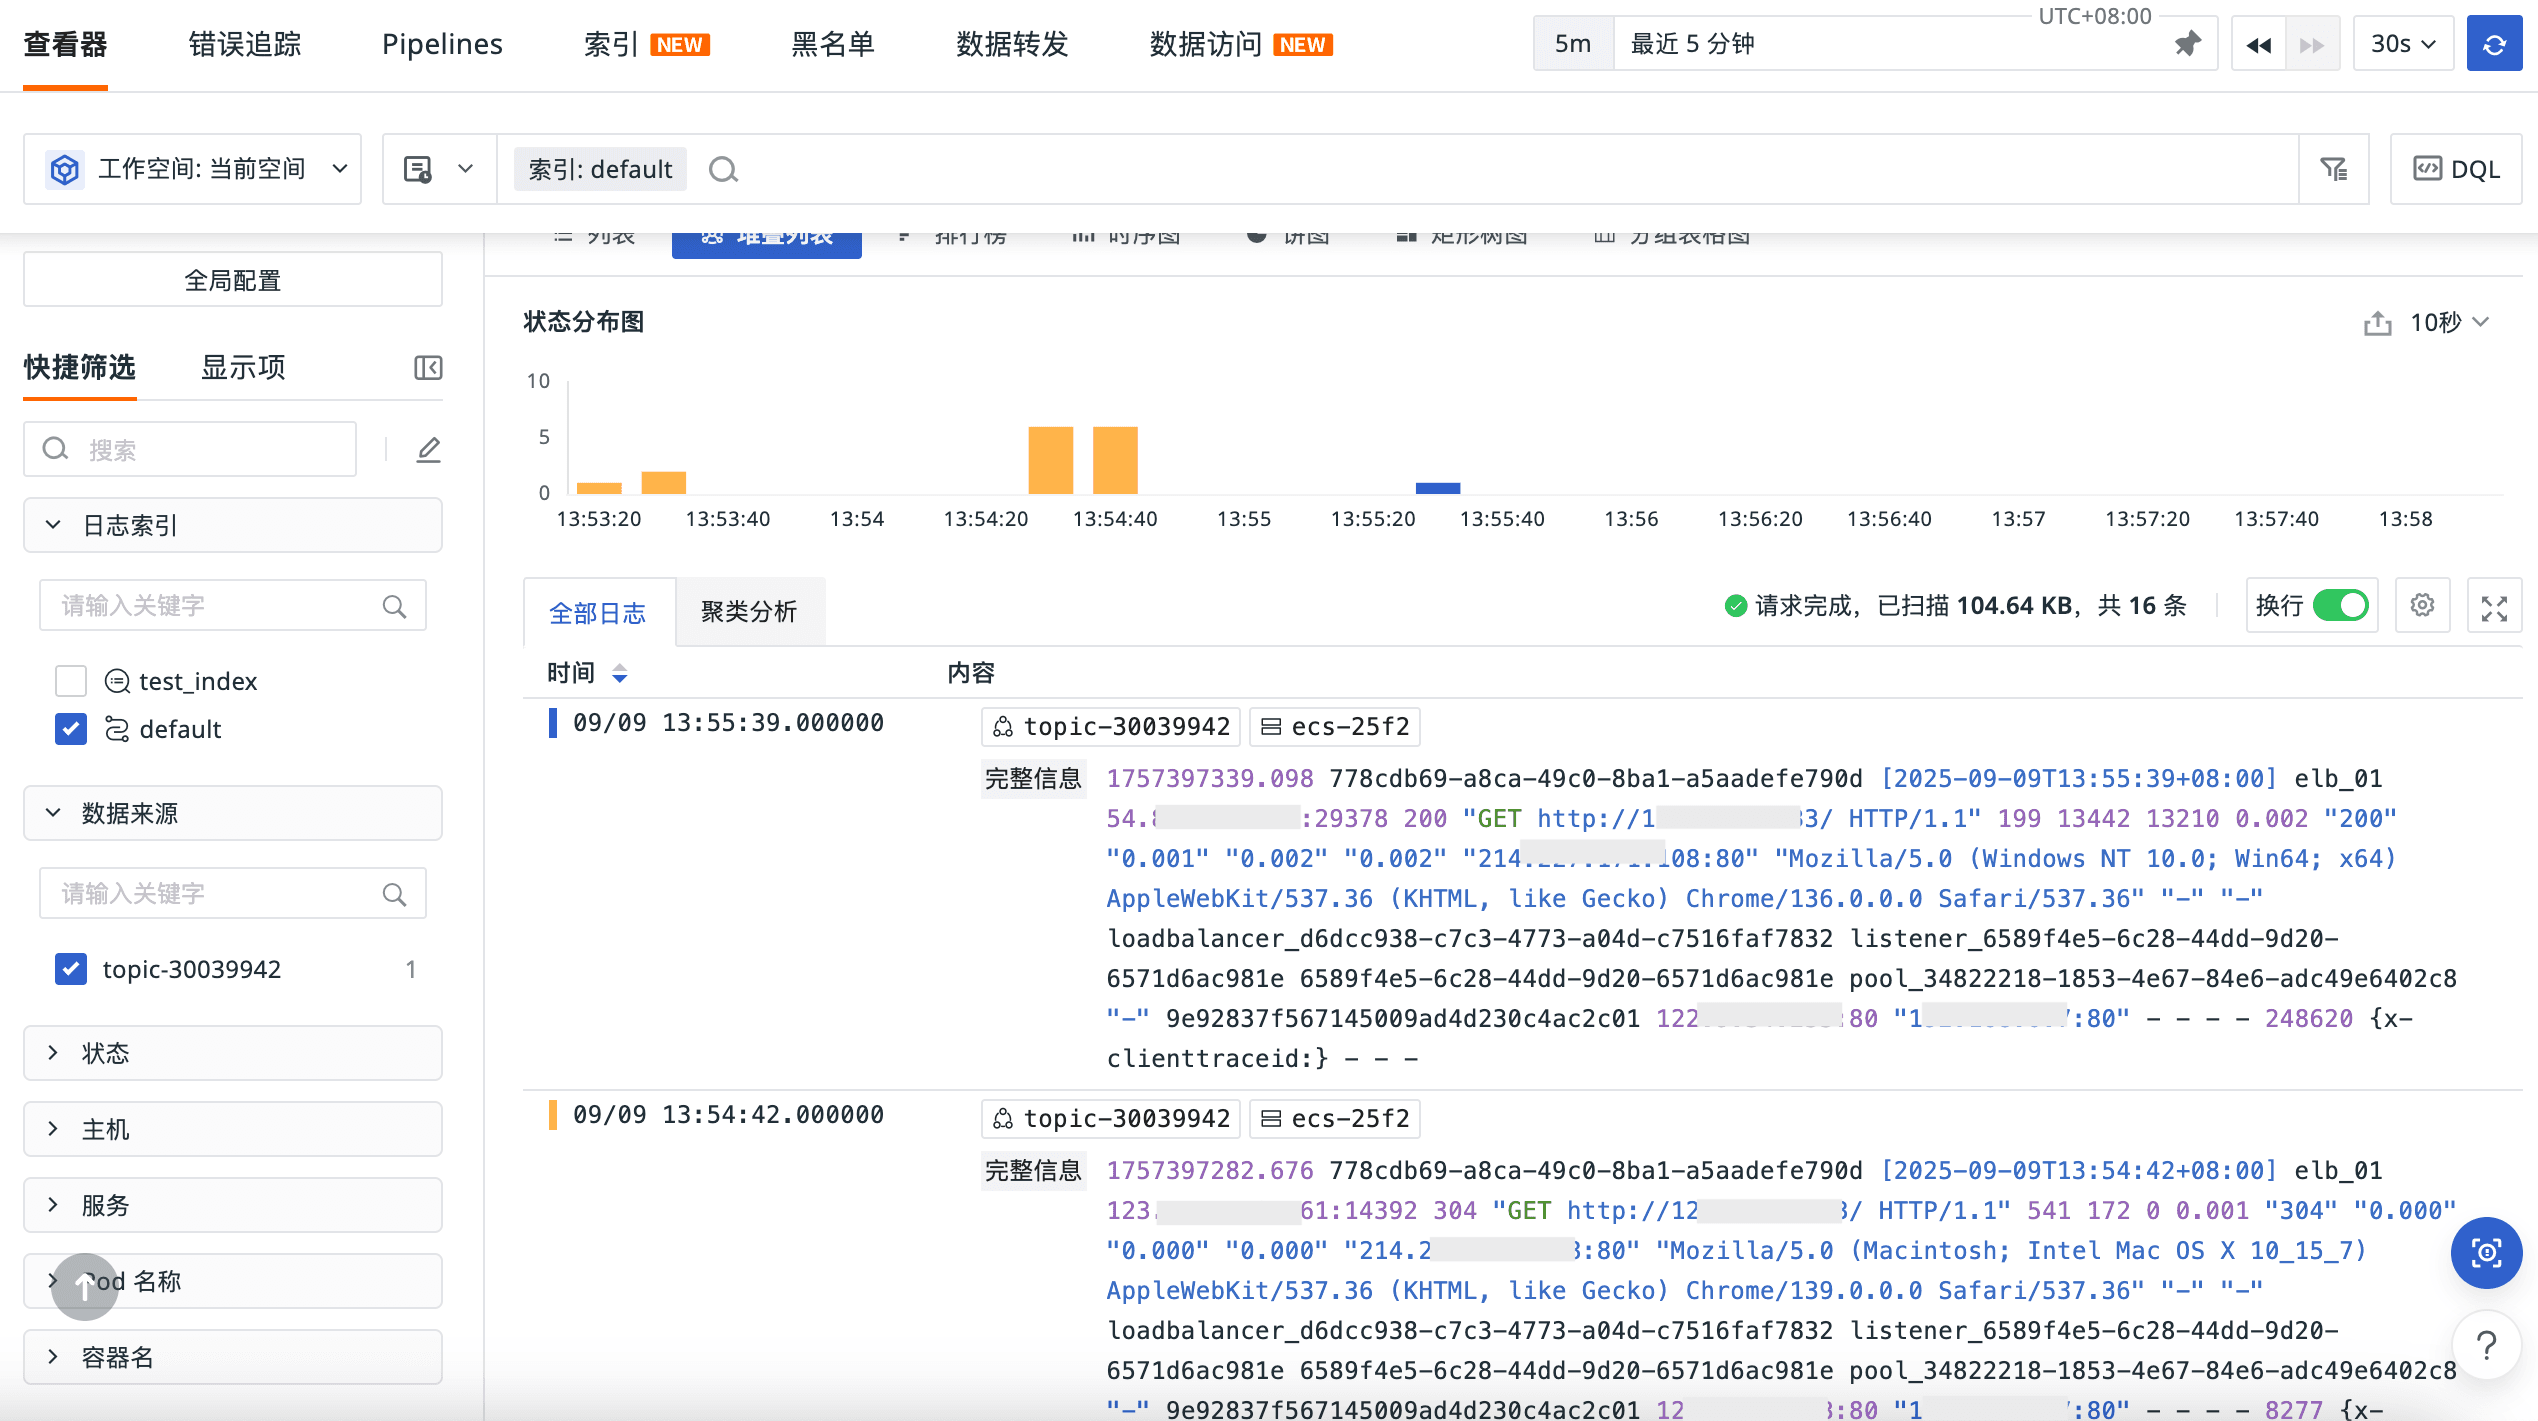
2、日志文本的字段已经被提取。