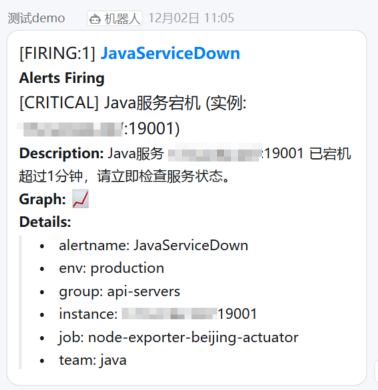
上文对alertmanager的部署进行详细阐述,本文对消息通知进行部署,消息通知采用钉钉机器人方式进行发送
配置文件 vim /xworks/monitor/dingtalk-webhook/config.yml
bash
#配置钉钉机器人token
targets:
default:
url: https://oapi.dingtalk.com/robot/send?access_token=钉钉token
critical:
url: https://oapi.dingtalk.com/robot/send?access_token=钉钉token
warning:
url: https://oapi.dingtalk.com/robot/send?access_token=钉钉token
java:
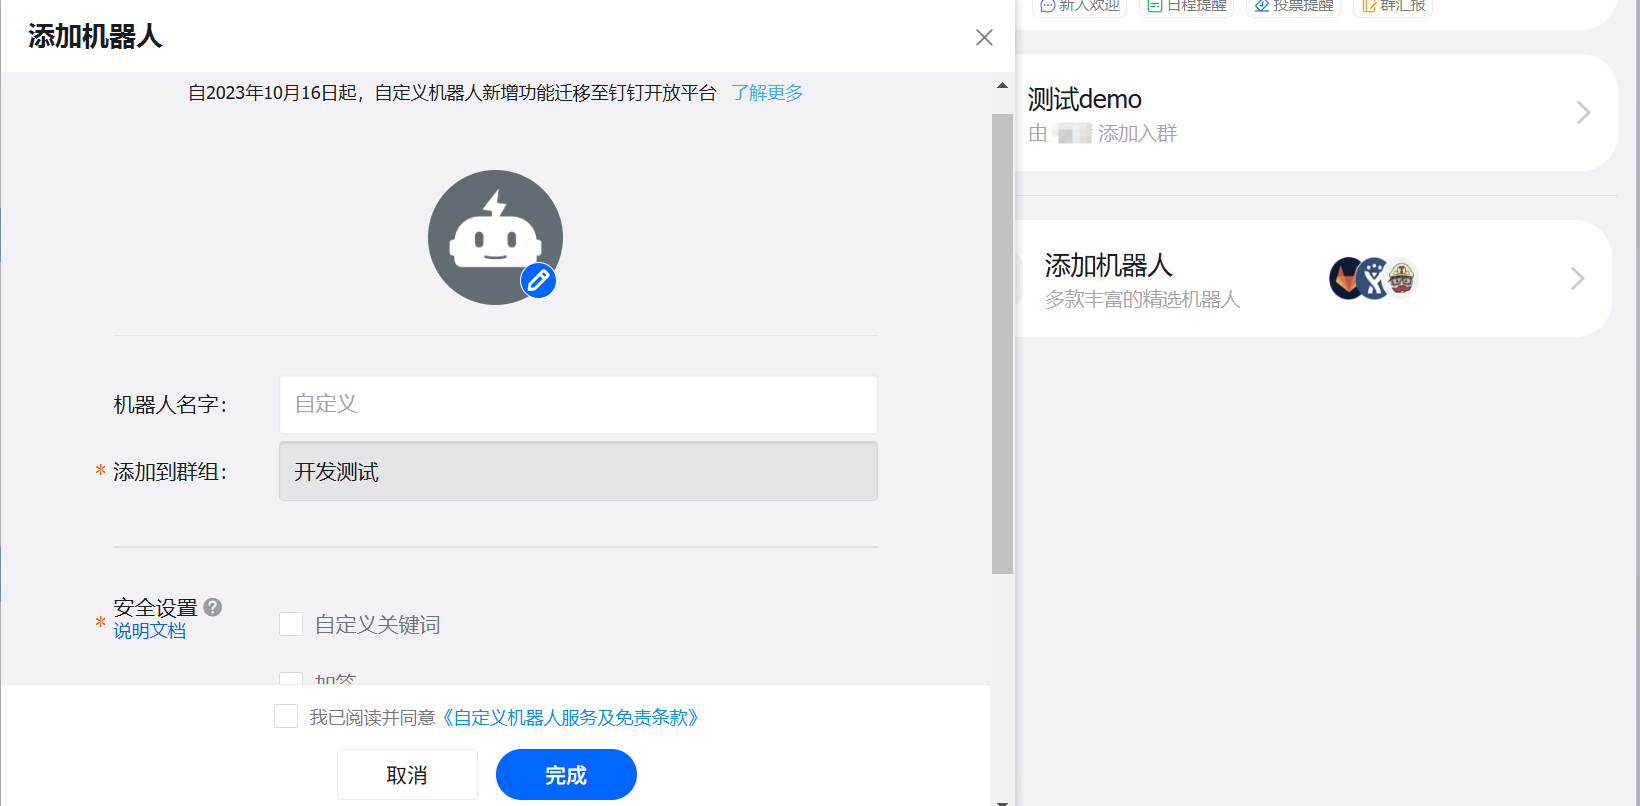
url: https://oapi.dingtalk.com/robot/send?access_token=钉钉token钉钉机器人token获取方式,通过待钉钉通知群设置
运行代码
bash
docker run -d \
  --name dingtalk-webhook \
  --restart=unless-stopped \
  -p 18060:8060 \
  -v /xworks/monitor/dingtalk-webhook/config.yml:/etc/prometheus-webhook-dingtalk/config.yml \
  -e TZ=Asia/Shanghai \
  -e LOG_LEVEL=info \
  timonwong/prometheus-webhook-dingtalk:latest
发送消息如下