👨🎓博主简介
💊交流社区: 运维交流社区 欢迎大家的加入!
🐋 希望大家多多支持,我们一起进步!😄
🎉如果文章对你有帮助的话,欢迎 点赞 👍🏻 评论 💬 收藏 ⭐️ 加关注+💗
文章目录
- [一、Prometheus 监控 k8s 方案及架构图](#一、Prometheus 监控 k8s 方案及架构图)
- 二、Kubernetes监控指标
-
- [2.1 K8S 集群层面监控](#2.1 K8S 集群层面监控)
- [2.2 Pod 层面监控](#2.2 Pod 层面监控)
- [2.3 监控组件对照表](#2.3 监控组件对照表)
- [2.4 Kubernetes 监控指标分层采集及告警架构](#2.4 Kubernetes 监控指标分层采集及告警架构)
- [三、部署 Prometheus 监控 kubernetes 资源所需服务](#三、部署 Prometheus 监控 kubernetes 资源所需服务)
-
- [3.1 创建监控所需namespace](#3.1 创建监控所需namespace)
- [3.2 部署node_exporter](#3.2 部署node_exporter)
- [3.3 部署 kube-state-metrics](#3.3 部署 kube-state-metrics)
- [3.4 部署 cAdvisor(DaemonSet方式)](#3.4 部署 cAdvisor(DaemonSet方式))
- [四、Prometheus 添加 K8s 集群监控目标配置](#四、Prometheus 添加 K8s 集群监控目标配置)
-
- [4.1 Prometheus 添加配置](#4.1 Prometheus 添加配置)
- [4.2 重载 Prometheus 配置](#4.2 重载 Prometheus 配置)
- [4.3 Prometheus 页面查看](#4.3 Prometheus 页面查看)
- [4.4 检查 Prometheus 是否支持 kubernetes 的 PromQL](#4.4 检查 Prometheus 是否支持 kubernetes 的 PromQL)
- [五、常用K8s监控指标 PromQL](#五、常用K8s监控指标 PromQL)
-
- [5.1 常用指标](#5.1 常用指标)
- [5.2 常用PromQL](#5.2 常用PromQL)
-
- [5.2.1 服务器层 (Node/基础设施)](#5.2.1 服务器层 (Node/基础设施))
- [5.2.2 容器资源层 (Container/Pod)](#5.2.2 容器资源层 (Container/Pod))
- [5.2.3 K8s 对象状态层 (调度/编排)](#5.2.3 K8s 对象状态层 (调度/编排))
- [5.2.4 集群容量与资源规划层](#5.2.4 集群容量与资源规划层)
- [5.2.5 K8s 核心组件监控 (Control Plane)](#5.2.5 K8s 核心组件监控 (Control Plane))
- [5.2.6 存储层监控 (PVC/Storage)](#5.2.6 存储层监控 (PVC/Storage))
- [5.2.7 网络与服务层 (Service/Ingress)](#5.2.7 网络与服务层 (Service/Ingress))
- [六、 配置 Kubernetes 常用 Alertmanager 告警规则](#六、 配置 Kubernetes 常用 Alertmanager 告警规则)
-
- [6.1 配置完成告警规则重载 Prometheus 配置](#6.1 配置完成告警规则重载 Prometheus 配置)
- [6.2 Prometheus 页面查看告警规则](#6.2 Prometheus 页面查看告警规则)
一、Prometheus 监控 k8s 方案及架构图
- 容器资源监控:
通过 cAdvisor DaemonSet 采集容器 CPU、内存、磁盘 I/O、网络流量等指标。
cAdvisor 以 特权容器 形式运行在每个 Node,通过
hostPort: 8080暴露/metrics端点,供外部 Prometheus 抓取容器指标,存储到自身的时序数据库 中,最后使用 Grafana 进行可视化展示。与 kubelet 内置 cAdvisor 不同,独立部署可解决外部访问认证问题。
- 宿主机监控:
通过 Node Exporter DaemonSet 采集物理机 CPU、内存、磁盘、网络、系统负载等指标。
通过
hostPort: 9100暴露/metrics端点,Prometheus 通过 Pull 模式 抓取宿主机资源状态指标,存储到自身的 时序数据库(TSDB) 中,最后使用 Grafana 进行可视化展示。
- 集群对象监控:
通过 kube-state-metrics 监听 API Server,将 K8s 资源对象(Pod、Deployment、Node、Service 等)状态转换为 Prometheus 指标,通过
hostPort:8080暴露/metrics端点,Prometheus在进行抓取,存储到自身的 时序数据库(TSDB) 中,最后使用 Grafana 进行可视化展示。
- Prometheus + Grafana + Alertmanager K8S 监控告警方案架构图
端口中:
Node Exporter默认端口为9100,可自行修改;
kube-state-metrics端口默认是8080,本文使用NodePort方式暴露出30080,可自行修改;
Cadvisor默认端口为8080,可自行修改;
📈 展示层
🔔 告警处理层
💾 处理 & 存储层
🔄 汇总层
📊 数据采集层
Pull :9100/metrics
Pull :30080/metrics
Pull :8080/metrics
写入
查询
Alert
邮件/钉钉/Slack
Node Exporter
主机指标
kube-state-metrics
K8s资源对象状态
Cadvisor
容器指标
Prometheus
服务发现 & 抓取
Prometheus TSDB
时序数据库
Alertmanager
分组/去重/路由
Grafana
可视化面板
告警通知
二、Kubernetes监控指标
2.1 K8S 集群层面监控
| 监控指标 | 说明 | 应用场景 |
|---|---|---|
| Node 资源利用率 | CPU、内存、磁盘、网络等硬件资源使用 | 节点负载评估、资源瓶颈定位 |
| Node 数量 | 节点规模与资源利用率、业务负载的比例 | 成本核算、自动扩缩容策略 |
| Pod 数量 | 各负载阶段下 Pod 与 Node 的分布关系 | 容量规划、服务器资源预估 |
| 资源对象状态 | Pod、Deployment、Service、Job、ConfigMap 等对象健康状态 | 集群健康度监控、故障排查 |
2.2 Pod 层面监控
| 监控指标 | 说明 | 数据来源 |
|---|---|---|
| Pod 运行状态 | 正常 Running / 异常 Pending、CrashLoopBackOff、Failed 数量分布 | kube-state-metrics |
| 容器资源利用率 | Pod 及内部容器的 CPU、内存、网络、磁盘 IO 使用 | cadvisor |
| 应用性能指标 | 并发连接数、请求 QPS、响应延迟、错误率 | 应用埋点(Prometheus SDK) |
2.3 监控组件对照表
| 监控目标 | 采集组件 | 核心指标 | 部署方式 |
|---|---|---|---|
| 容器性能 | cadvisor | CPU、内存、网络、磁盘利用率 | kubelet 内置 |
| Node 性能 | node-exporter | CPU、内存、磁盘、系统负载、硬件温度 | 二进制 |
| K8S 资源对象 | kube-state-metrics | Pod/Deployment/Service/Node 状态、副本数、重启次数 | Deployment |
| 应用自定义 | Prometheus SDK | 业务指标(订单量、接口延迟等) | 应用代码集成 |
2.4 Kubernetes 监控指标分层采集及告警架构
集群层
节点层
容器层
应用层
Prometheus SDK
cadvisor
node-exporter
kube-state-metrics
Prometheus
业务指标
订单/QPS/延迟
Pod 状态
资源利用率
Node 资源
硬件状态
K8S 对象
Deployment/Service
采集
TSDB
查询
告警触发
通知
TSDB
可视化面板
Grafana
Alertmanager
分组/去重/路由
邮件 / 钉钉 / Slack
三、部署 Prometheus 监控 kubernetes 资源所需服务
| 服务名称 | 版本 | 端口 | 对外端口 |
|---|---|---|---|
| node_exporter | 1.10.2 | 9100 | 宿主机部署:9100 |
| kube-state-metrics | 2.3.0 | 8080 | k8s使用nodeport模式:30080 |
| cAdvisor | latest | 8080 | k8s使用network=host模式:8080 |
需注意:
- 镜像版本 :
kube-state-metrics版本对应的是kubernetes1.20.10的版本。- 网络模式 :
kube-state-metrics使用的NodePort、cAdvisor使用的hostNetwork: true,无需配置service。- 端口 :如果Prometheus是在k8s中部署的,网络模式都可以采用
ClusterIP方式,在Prometheus配置中填写svc域名:port即可;还需注意kube-state-metrics和cAdvisor的 端口,他两都是8080,需要进行区分;
3.1 创建监控所需namespace
bash
kubectl create namespace monitoring3.2 部署node_exporter
- 二进制部署node_exporter(需每台被监控端都部署)
二进制方式部署
node_exporter服务可参考:【Linux】Prometheus + Grafana 的部署及介绍(亲测无问题) 第四、五步;
- k8s部署node_exporter(采用DaemonSet方式部署,每个节点都会自动部署一个)
k8s方式部署
node_exporter服务可参考:k8s部署Prometheus + node_exporter + Grafana + Alertmanager第三步;
3.3 部署 kube-state-metrics
kube-state-metrics是一个 K8s 集群级别的监控代理 ,通过监听 API Server 实时获取资源对象(Pod、Deployment、Node、PVC 等)的状态信息,并将其转换为 Prometheus 格式的指标暴露出来。
vi kube-state-metrics.yaml
yaml
apiVersion: rbac.authorization.k8s.io/v1
kind: ClusterRole
metadata:
  name: kube-state-metrics
rules:
- apiGroups: [""]
  resources: ["nodes", "pods", "services", "resourcequotas", "replicationcontrollers", "limitranges", "persistentvolumeclaims", "persistentvolumes", "namespaces", "endpoints", "secrets", "configmaps"]
  verbs: ["list", "watch"]
- apiGroups: ["apps"]
  resources: ["statefulsets", "daemonsets", "deployments", "replicasets"]
  verbs: ["list", "watch"]
- apiGroups: ["batch"]
  resources: ["cronjobs", "jobs"]
  verbs: ["list", "watch"]
- apiGroups: ["autoscaling"]
  resources: ["horizontalpodautoscalers"]
  verbs: ["list", "watch"]
- apiGroups: ["policy"]
  resources: ["poddisruptionbudgets"]
  verbs: ["list", "watch"]
- apiGroups: ["certificates.k8s.io"]
  resources: ["certificatesigningrequests"]
  verbs: ["list", "watch"]
- apiGroups: ["storage.k8s.io"]
  resources: ["storageclasses", "volumeattachments"]
  verbs: ["list", "watch"]
- apiGroups: ["admissionregistration.k8s.io"]
  resources: ["mutatingwebhookconfigurations", "validatingwebhookconfigurations"]
  verbs: ["list", "watch"]
- apiGroups: ["networking.k8s.io"]
  resources: ["networkpolicies", "ingresses"]
  verbs: ["list", "watch"]
- apiGroups: ["coordination.k8s.io"]
  resources: ["leases"]
  verbs: ["list", "watch"]
---
apiVersion: rbac.authorization.k8s.io/v1
kind: ClusterRoleBinding
metadata:
  name: kube-state-metrics
roleRef:
  apiGroup: rbac.authorization.k8s.io
  kind: ClusterRole
  name: kube-state-metrics
subjects:
- kind: ServiceAccount
  name: kube-state-metrics
  namespace: monitoring
---
apiVersion: v1
kind: ServiceAccount
metadata:
  name: kube-state-metrics
  namespace: monitoring
---
apiVersion: apps/v1
kind: Deployment
metadata:
  name: kube-state-metrics
  namespace: monitoring
spec:
  replicas: 1
  selector:
    matchLabels:
      app: kube-state-metrics
  template:
    metadata:
      labels:
        app: kube-state-metrics
    spec:
      serviceAccountName: kube-state-metrics
      containers:
      - name: kube-state-metrics
        image: bitnami/kube-state-metrics:2.3.0
        ports:
        - containerPort: 8080
          name: http-metrics
        - containerPort: 8081
          name: telemetry
        livenessProbe:
          httpGet:
            path: /healthz
            port: 8080
          initialDelaySeconds: 5
          timeoutSeconds: 5
        readinessProbe:
          httpGet:
            path: /healthz
            port: 8080
          initialDelaySeconds: 5
          timeoutSeconds: 5
        resources:
          requests:
            memory: "100Mi"
            cpu: "100m"
          limits:
            memory: "200Mi"
            cpu: "200m"
---
apiVersion: v1
kind: Service
metadata:
  name: kube-state-metrics
  namespace: monitoring
spec:
  type: NodePort
  ports:
  - name: http-metrics
    port: 8080
    targetPort: http-metrics
    nodePort: 30080  # 指定端口(30000-32767范围)
  - name: telemetry
    port: 8081
    targetPort: telemetry
    nodePort: 30081
  selector:
    app: kube-state-metrics
此 YAML 文件包含了部署 kube-state-metrics 所需的全部资源对象,共 5 个部分,使用---进行分割资源对象:
- ClusterRole(集群角色)
- ClusterRoleBinding(集群角色绑定)
- ServiceAccount(服务账户)
- Deployment(部署)
- Service(服务)
- 创建并启动服务
bash
kubectl apply -f kube-state-metrics.yaml- 验证
bash
# 查看 Pod 状态(状态为1/1则为运行成功)
kubectl get pods -n monitoring -l app=kube-state-metrics -o wide

# 查看日志确认无权限错误
kubectl logs -n monitoring kube-state-metrics-<pod名称后缀>

# 测试 metrics 接口
curl http://<NodeIP>:30080/metrics

# 查看采集的指标数量(正常会有200多个)
curl -s http://<NodeIP>:30080/metrics | grep -c "^# TYPE"
3.4 部署 cAdvisor(DaemonSet方式)
vi cadvisor.yaml
yaml
apiVersion: apps/v1
kind: DaemonSet
metadata:
  name: cadvisor
  namespace: monitoring
spec:
  selector:
    matchLabels:
      name: cadvisor
  template:
    metadata:
      labels:
        name: cadvisor
    spec:
      automountServiceAccountToken: false
      hostNetwork: true
      hostPID: true
      tolerations:           # ← 添加容忍度,可以添加多个容忍
        - key: node-role.kubernetes.io/master
          effect: NoSchedule
          operator: Exists
        - key: node-role.kubernetes.io/control-plane
          effect: NoSchedule
          operator: Exists
      containers:
      - name: cadvisor
        image: google/cadvisor:latest
        ports:
        - containerPort: 8080
          hostPort: 8080
          name: http
        args:
          - --housekeeping_interval=10s
          - --max_housekeeping_interval=15s
          - --disable_metrics=percpu,sched,tcp,udp,disk
        # 容器内路径,用于挂载宿主机目录及文件
        volumeMounts:
        # 系统核心
        - name: rootfs
          mountPath: /rootfs
          readOnly: true
        - name: var-run
          mountPath: /var/run
          readOnly: false
        - name: sys
          mountPath: /sys
          readOnly: true
        # 容器运行时(Docker 多路径 + Containerd)
        - name: docker
          mountPath: /var/lib/docker
          readOnly: true
          # 如果集群节点有docker路径不一样,可以新增一个
        - name: docker2
          mountPath: /data/docker
          readOnly: true
        - name: containerd
          mountPath: /var/lib/containerd
          readOnly: true
        - name: containerd-socket
          mountPath: /run/containerd
          readOnly: true
        # 磁盘信息
        - name: disk
          mountPath: /dev/disk
          readOnly: true
        securityContext:
          privileged: true
      # 宿主机路径映射(与上面 volumeMounts 一一对应)
      volumes:
      - name: rootfs
        hostPath:
          path: /
      - name: var-run
        hostPath:
          path: /var/run
      - name: sys
        hostPath:
          path: /sys
      - name: docker
        hostPath:
          path: /var/lib/docker
      - name: docker2
        hostPath:
          path: /data/docker
      - name: containerd
        hostPath:
          path: /var/lib/containerd
      - name: containerd-socket
        hostPath:
          path: /run/containerd/
      - name: disk
        hostPath:
          path: /dev/disk
---
apiVersion: v1
kind: Service
metadata:
  name: cadvisor
  namespace: monitoring
spec:
  type: ClusterIP
  ports:
  - port: 8080
    targetPort: 8080
    name: http
  selector:
name: cadvisor- 挂载各路径的作用
| 挂载名称 | 容器内路径 | 宿主机路径 | 作用 | 不挂载的后果 |
|---|---|---|---|---|
rootfs |
/rootfs |
/ |
读取宿主机根目录,获取系统级信息(CPU、内存、磁盘分区、进程等) | 看不到宿主机整体资源,只能看到容器相对值 |
var-run |
/var/run |
/var/run |
访问 docker/containerd 的 socket 文件,与容器运行时通信 | 无法实时获取容器列表,只能读到缓存数据 |
sys |
/sys |
/sys |
读取 cgroup 和内核数据,获取容器资源使用量的核心来源 | 完全采集不到任何容器指标,cadvisor 失效 |
docker |
/var/lib/docker |
/var/lib/docker |
读取 docker 容器元数据、镜像信息、容器状态、日志路径 | docker 容器显示为空,看不到容器名、镜像、启动时间 |
docker2 |
/data/docker |
/data/docker |
备用 docker 数据路径(某些节点自定义路径) | 该节点 docker 容器信息缺失 |
containerd |
/var/lib/containerd |
/var/lib/containerd |
读取 containerd 容器元数据、镜像、快照信息 | containerd 容器显示为空 |
containerd-socket |
/run/containerd |
/run/containerd |
访问 containerd 的 socket 文件,实时通信 | 无法获取 containerd 容器动态信息 |
disk |
/dev/disk |
/dev/disk |
获取磁盘设备信息、分区表、磁盘容量和 I/O 统计 | 缺少磁盘容量、I/O 指标,无法监控存储 |
- 创建并启动服务
bash
kubectl apply -f cadvisor.yaml- 验证
bash
# 1. 查看 Pod 运行状态(状态为1/1则为运行成功)
kubectl get pods -n monitoring -l name=cadvisor -o wide
# 2. 测试 metrics 接口(任一节点的 8080 端口)
curl http://<node-ip>:8080/metrics | head -20
# 3. 检查容器日志
kubectl logs -n monitoring cadvisor-<pod名称后缀> | tail -20
# 4. 查看采集到的容器指标(任一节点的 8080 端口)
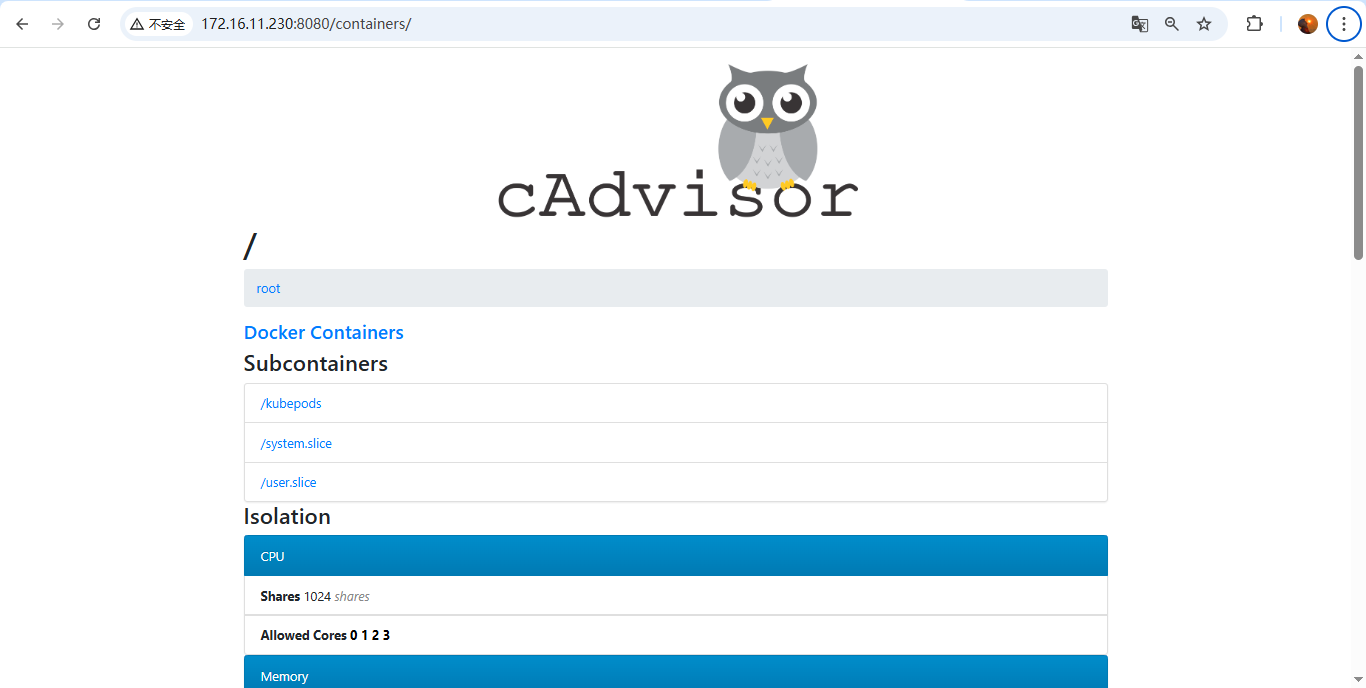
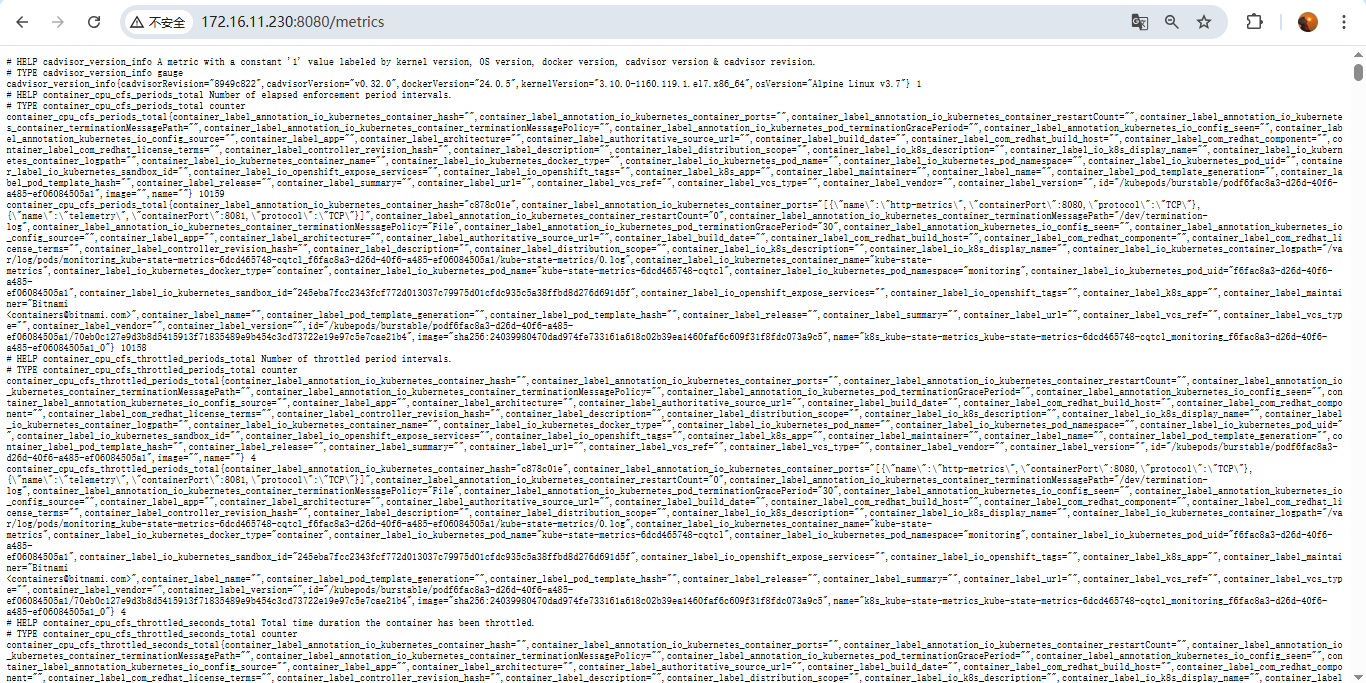
curl http://<node-ip>:8080/api/v1.3/containers/ | head -50页面访问测试:node-ip:8080 和 node-ip:8080/metrics
四、Prometheus 添加 K8s 集群监控目标配置
4.1 Prometheus 添加配置
添加
kube-state-metrics和cadvisor到Prometheus配置中;
kube-state-metrics是采用的nodeport吧端口对外暴露了30080,所以直接写集群任意IP:30080即可;cadvisor采用的是network=host模式,直接写集群每台节点的ip:8088即可;
加clusterip是因为适配k8s部署的Prometheus,可直接使用域名;
yaml
  - job_name: 'kube-state-metrics'
    static_configs:
      - targets: ['172.16.11.230:30080']

  - job_name: 'cadvisor'
    static_configs:
      - targets: ['172.16.11.230:8080','172.16.11.231:8080','172.16.11.232:8080']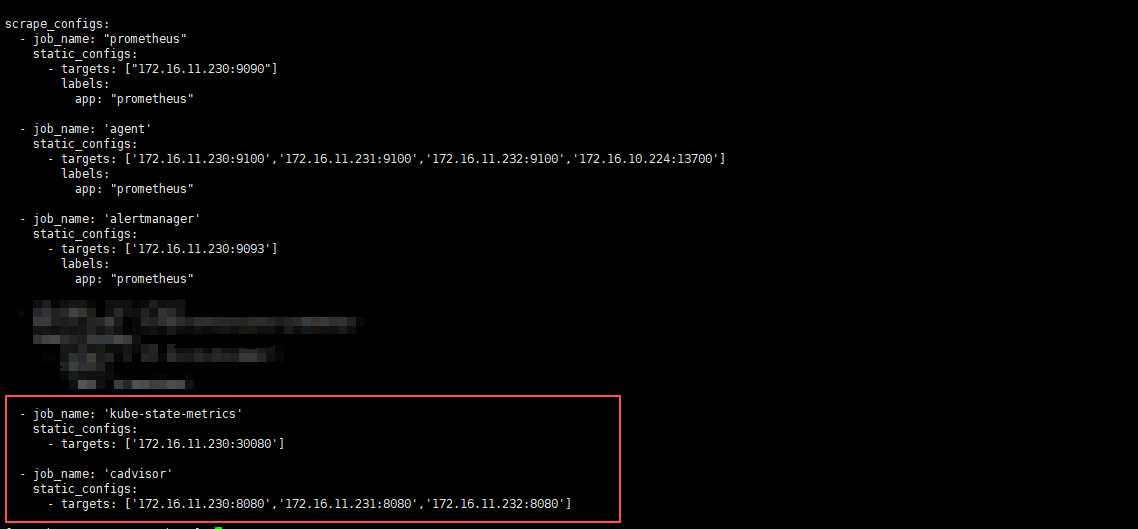
4.2 重载 Prometheus 配置
localhost可换为IP;
bash
curl -X POST http://localhost:9090/-/reload4.3 Prometheus 页面查看
172.16.11.230:9090/targets
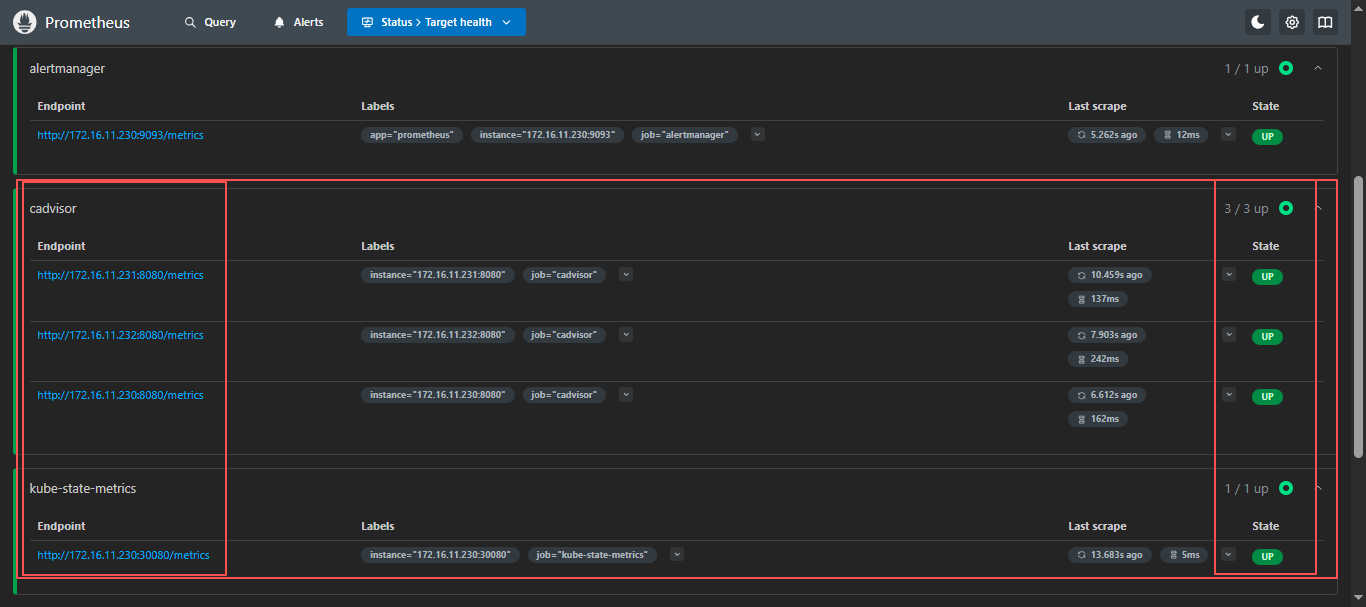
添加完成,检查PromQL是否支持查询k8s信息;
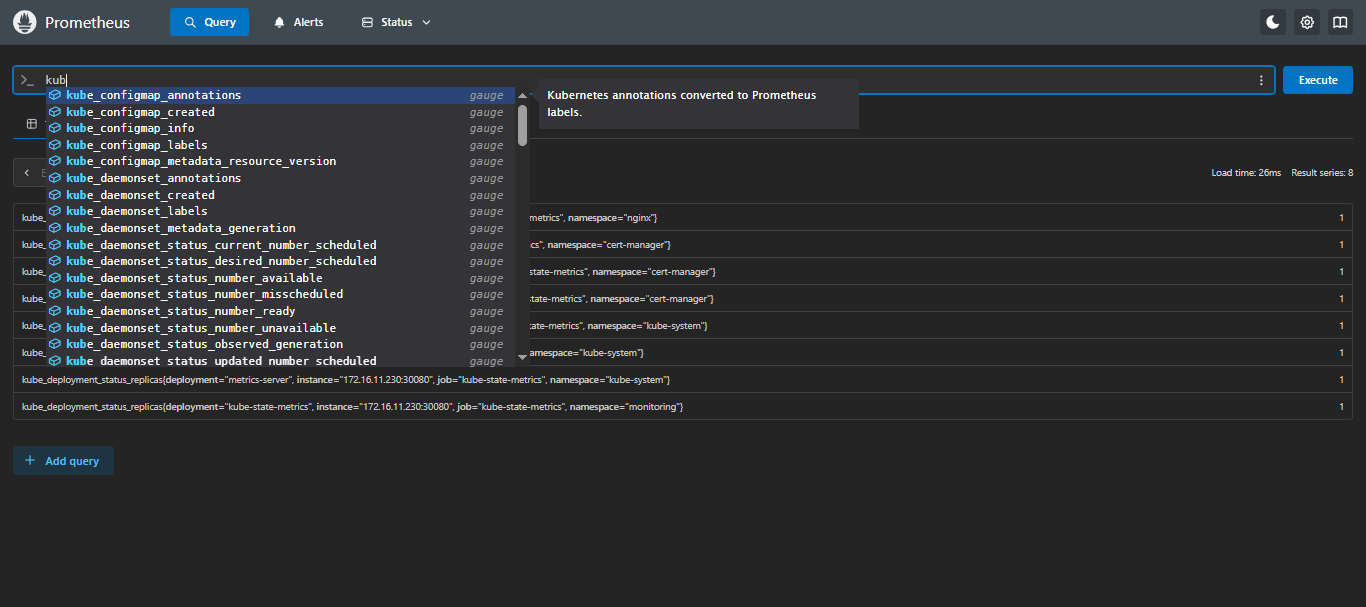
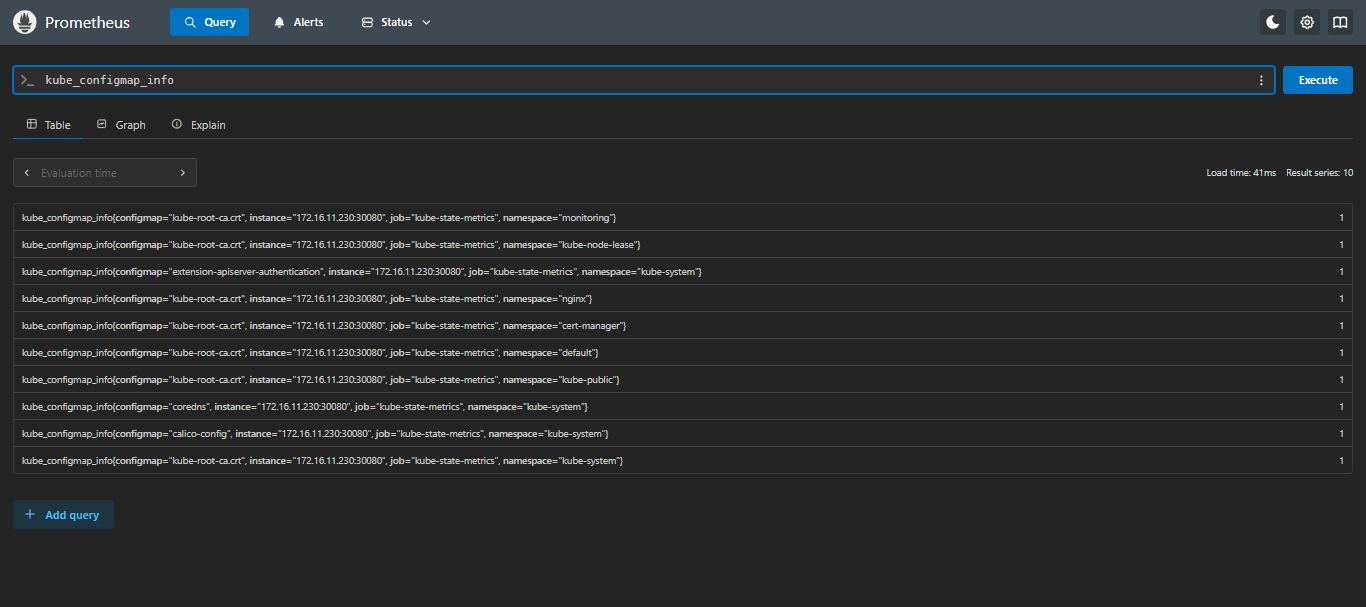
4.4 检查 Prometheus 是否支持 kubernetes 的 PromQL
在
Prometheus页面的Query输入kube,只要可以出现kube_*并可以查出来就没问题;
五、常用K8s监控指标 PromQL
5.1 常用指标
可查看:【云原生】PromQL 常用内置指标 第 十六、kubernetes 常用指标
5.2 常用PromQL
5.2.1 服务器层 (Node/基础设施)
sql
# ========== CPU 监控 ==========

# CPU 使用率(按节点)
100 - (avg by(instance) (irate(node_cpu_seconds_total{mode="idle"}[5m])) * 100)

# CPU 各模式使用率分布(用户态/系统态/IO等待等)
avg by(instance, mode) (irate(node_cpu_seconds_total[5m])) * 100

# CPU 负载(1分钟/5分钟/15分钟)
node_load1 / on(instance) (count by(instance) (node_cpu_seconds_total{mode="idle"}) / 2)
node_load5
node_load15

# ========== 内存监控 ==========

# 内存使用率(推荐用 MemAvailable,更准确)
(1 - node_memory_MemAvailable_bytes / node_memory_MemTotal_bytes) * 100

# 内存使用量(按节点)
node_memory_MemTotal_bytes - node_memory_MemAvailable_bytes

# Swap 使用率
(1 - node_memory_SwapFree_bytes / node_memory_SwapTotal_bytes) * 100

# ========== 磁盘监控 ==========

# 磁盘使用率(排除 tmpfs 等虚拟文件系统)
(1 - node_filesystem_avail_bytes{mountpoint!~"/boot|/run.*",fstype!~"tmpfs|rootfs"} / node_filesystem_size_bytes) * 100

# 磁盘 IO 利用率(读写时间占比)
irate(node_disk_io_time_seconds_total[5m]) * 100

# 磁盘吞吐量(读/写 MB/s)
irate(node_disk_read_bytes_total[5m]) / 1024 / 1024
irate(node_disk_written_bytes_total[5m]) / 1024 / 1024

# 磁盘 IOPS
irate(node_disk_reads_completed_total[5m])
irate(node_disk_writes_completed_total[5m])

# ========== 网络监控 ==========

# 网络带宽使用率(入站/出站 MB/s)
irate(node_network_receive_bytes_total{device!~"lo|veth.*|docker.*|flannel.*|cali.*"}[5m]) / 1024 / 1024
irate(node_network_transmit_bytes_total{device!~"lo|veth.*|docker.*|flannel.*|cali.*"}[5m]) / 1024 / 1024

# 网络错误包数
irate(node_network_receive_errs_total[5m])
irate(node_network_transmit_errs_total[5m])

# TCP 连接数
node_netstat_Tcp_CurrEstab
5.2.2 容器资源层 (Container/Pod)
sql
# ========== Pod CPU 监控 ==========

# Pod CPU 使用率(占 Request 百分比)
sum(rate(container_cpu_usage_seconds_total{image!="",pod!=""}[5m])) by (pod, namespace)
/
sum(kube_pod_container_resource_requests{resource="cpu",container!="POD"}) by (pod, namespace) * 100

# Pod CPU 使用率(占 Limit 百分比)
sum(rate(container_cpu_usage_seconds_total{image!="",pod!=""}[5m])) by (pod, namespace)
/
sum(kube_pod_container_resource_limits{resource="cpu",container!="POD"}) by (pod, namespace) * 100

# 容器 CPU 节流率(throttling,说明 CPU 被限制)
rate(container_cpu_cfs_throttled_seconds_total{image!=""}[5m])

# ========== Pod 内存监控 ==========

# Pod 内存使用量(Working Set,更准确)
sum(container_memory_working_set_bytes{image!="",pod!=""}) by (pod, namespace)

# Pod 内存使用率(占 Request 百分比)
sum(container_memory_working_set_bytes{image!="",pod!=""}) by (pod, namespace)
/
sum(kube_pod_container_resource_requests{resource="memory",container!="POD"}) by (pod, namespace) * 100

# Pod 内存使用率(占 Limit 百分比)- OOM 预警关键指标
sum(container_memory_working_set_bytes{image!="",pod!=""}) by (pod, namespace)
/
sum(kube_pod_container_resource_limits{resource="memory",container!="POD"}) by (pod, namespace) * 100

# 容器 OOM Kill 次数
increase(container_memory_failures_total{type="pgmajfault"}[10m])

# ========== 容器状态监控 ==========

# 容器重启次数(10分钟内变化)
increase(kube_pod_container_status_restarts_total[10m]) > 0

# 正在等待的容器(如镜像拉取中)
kube_pod_container_status_waiting_reason{reason=~"ImagePullBackOff|ErrImagePull|CrashLoopBackOff|ContainerCreating"}

# Pod 处于 Terminating 状态超过 5 分钟
time() - kube_pod_deletion_timestamp > 300 and kube_pod_status_phase{phase="Running"} == 1
5.2.3 K8s 对象状态层 (调度/编排)
sql
# ========== Pod 状态监控 ==========

# 各命名空间 Pending Pod 数量
sum(kube_pod_status_phase{phase="Pending"}) by (namespace)

# 各命名空间 Failed Pod 数量
sum(kube_pod_status_phase{phase="Failed"}) by (namespace)

# Unknown 状态 Pod(节点失联)
sum(kube_pod_status_phase{phase="Unknown"}) by (namespace)

# 非 Running 状态 Pod 列表
sum by (namespace, pod) (kube_pod_status_phase{phase=~"Pending|Failed|Unknown"} == 1)

# Pod 未就绪(Not Ready)
sum by (namespace, pod) (kube_pod_status_ready{condition="false"} == 1)

# ========== Deployment 监控 ==========

# Deployment 期望副本数与实际副本数差异
kube_deployment_spec_replicas - kube_deployment_status_replicas_available

# Deployment 更新进度(滚动更新中)
kube_deployment_status_observed_generation != kube_deployment_metadata_generation

# Deployment 健康状态(不可用副本 > 0)
kube_deployment_status_replicas_unavailable > 0

# ========== StatefulSet/DaemonSet 监控 ==========

# StatefulSet 副本缺失
kube_statefulset_replicas - kube_statefulset_status_replicas_ready

# DaemonSet 调度失败(期望 vs 实际)
kube_daemonset_status_desired_number_scheduled - kube_daemonset_status_current_number_scheduled

# DaemonSet 未就绪 Pod 数
kube_daemonset_status_number_unavailable > 0

# ========== Job/CronJob 监控 ==========

# Job 失败次数(最近1小时)
increase(kube_job_status_failed[1h]) > 0

# Job 执行时间(开始到现在)
time() - kube_job_status_start_time

# CronJob 下次调度时间监控
kube_cronjob_next_schedule_time - time() < 0  # 错过调度

# ========== HPA 监控 ==========

# HPA 当前副本数 vs 期望
kube_horizontalpodautoscaler_status_current_replicas != kube_horizontalpodautoscaler_status_desired_replicas

# HPA 达到最大副本数(扩容受限)
kube_horizontalpodautoscaler_status_current_replicas == kube_horizontalpodautoscaler_spec_max_replicas

# HPA 指标缺失(无法获取指标)
kube_horizontalpodautoscaler_status_condition{condition="ScalingActive",status="false"} == 1
5.2.4 集群容量与资源规划层
sql
# ========== 集群 CPU 容量规划 ==========

# CPU Request 使用率(集群整体,> 80% 需扩容)
sum(kube_pod_container_resource_requests{resource="cpu"})
/
sum(kube_node_status_allocatable{resource="cpu"}) * 100

# CPU Limit 使用率(防止 overcommit 过高)
sum(kube_pod_container_resource_limits{resource="cpu"})
/
sum(kube_node_status_allocatable{resource="cpu"}) * 100

# 可分配 CPU 剩余量(按节点)
kube_node_status_allocatable{resource="cpu"} - sum by (node) (kube_pod_container_resource_requests{resource="cpu"})

# ========== 集群内存容量规划 ==========

# Memory Request 使用率(集群整体)
sum(kube_pod_container_resource_requests{resource="memory"})
/
sum(kube_node_status_allocatable{resource="memory"}) * 100

# Memory Limit 使用率(危险指标,应 < 100%)
sum(kube_pod_container_resource_limits{resource="memory"})
/
sum(kube_node_status_allocatable{resource="memory"}) * 100

# 节点内存压力状态
kube_node_status_condition{condition="MemoryPressure",status="true"} == 1
kube_node_status_condition{condition="DiskPressure",status="true"} == 1
kube_node_status_condition{condition="PIDPressure",status="true"} == 1

# ========== Pod 资源分配合规性 ==========

# 未设置 CPU Limit 的容器(风险项)
count by (namespace, pod) (kube_pod_container_info{container!="POD"})
unless
count by (namespace, pod) (kube_pod_container_resource_limits{resource="cpu"})

# 未设置内存 Limit 的容器(OOM 风险)
count by (namespace, pod) (kube_pod_container_info{container!="POD"})
unless
count by (namespace, pod) (kube_pod_container_resource_limits{resource="memory"})

# 未设置 Request 的容器(调度风险)
count by (namespace, pod) (kube_pod_container_info{container!="POD"})
unless
count by (namespace, pod) (kube_pod_container_resource_requests{resource="cpu"})
5.2.5 K8s 核心组件监控 (Control Plane)
sql
# ========== API Server 监控 ==========

# API Server QPS(按动词和资源)
sum(rate(apiserver_request_total[5m])) by (verb, resource)

# API Server 请求延迟(P99)
histogram_quantile(0.99, sum(rate(apiserver_request_duration_seconds_bucket{verb!~"WATCH|LIST"}[5m])) by (le, verb))

# API Server 错误率(5xx)
sum(rate(apiserver_request_total{code=~"5.."}[5m])) / sum(rate(apiserver_request_total[5m])) * 100

# ETCD 写延迟(磁盘 fsync)
histogram_quantile(0.99, sum(rate(etcd_disk_wal_fsync_duration_seconds_bucket[5m])) by (le))

# ETCD 空间使用率
(etcd_mvcc_db_total_size_in_bytes / etcd_server_quota_backend_bytes) * 100

# ========== Scheduler 监控 ==========

# 调度失败率
sum(rate(scheduler_schedule_attempts_total{result="unschedulable"}[5m]))

# 调度延迟(e2e)
histogram_quantile(0.99, sum(rate(scheduler_e2e_scheduling_duration_seconds_bucket[5m])) by (le))

# ========== Controller Manager 监控 ==========

# 工作队列深度(堆积情况)
workqueue_depth{name=~"kube-system.*"}

# 重试次数增加
increase(workqueue_retries_total[10m]) > 0
5.2.6 存储层监控 (PVC/Storage)
sql
# ========== PVC 监控 ==========

# PVC 使用率(需 kubelet_volume_stats 指标)
(kubelet_volume_stats_capacity_bytes - kubelet_volume_stats_available_bytes) / kubelet_volume_stats_capacity_bytes * 100

# PVC 剩余空间小于 10GB
kubelet_volume_stats_available_bytes / 1024 / 1024 / 1024 < 10

# 未绑定的 PVC(Pending 状态)
kube_persistentvolumeclaim_status_phase{phase="Pending"} == 1

# PV 可用状态监控
kube_persistentvolume_status_phase{phase=~"Failed|Released"} == 1

# ========== Storage Class 性能 ==========

# 存储操作延迟(如果有 CSI 指标)
histogram_quantile(0.95, sum(rate(csi_sidecar_operations_seconds_bucket[5m])) by (le, driver_name))
5.2.7 网络与服务层 (Service/Ingress)
sql
# ========== Service 监控 ==========

# Service Endpoint 可用性(Endpoint 为空)
kube_endpoint_address_available == 0 and kube_endpoint_address_not_ready > 0

# Service 无后端 Pod
kube_service_spec_type unless count by (service, namespace) (kube_endpoint_address_available > 0)

# ========== Ingress 监控(需 nginx-ingress 或类似) ==========

# Ingress 请求 QPS
sum(rate(nginx_ingress_controller_requests[5m])) by (ingress, status)

# Ingress 5xx 错误率
sum(rate(nginx_ingress_controller_requests{status=~"5.."}[5m])) by (ingress)
/
sum(rate(nginx_ingress_controller_requests[5m])) by (ingress) * 100

# Ingress 上行/下行流量
sum(rate(nginx_ingress_controller_bytes_sent_bucket[5m])) by (ingress)
sum(rate(nginx_ingress_controller_request_size_bucket[5m])) by (ingress)

# Ingress 响应时间 P99
histogram_quantile(0.99, sum(rate(nginx_ingress_controller_request_duration_seconds_bucket[5m])) by (le, ingress))
六、 配置 Kubernetes 常用 Alertmanager 告警规则
如下告警规则可根据自己实际情况进行修改,例如:我的k8s集群是使用二进制systemd方式部署的,如果您不是使用这种方式,可以更换为自己的部署方式监控;
kubernetes_rules.yml
yaml
groups:

  # =========================
  # 1) Kubernetes 核心服务(systemd)
  # =========================
  - name: kubernetes核心服务状态
    rules:

      - alert: docker服务宕机
        expr: node_systemd_unit_state{name="docker.service",state="active"} == 0
        for: 1m
        labels:
          severity: 严重
        annotations:
          summary: "IP为 {{ $labels.instance }} 的 docker 服务已停止"
          description: "IP为 {{ $labels.instance }} 的 docker 服务当前为非激活状态,请立即检查 Docker 服务状态。"

      - alert: containerd服务宕机
        expr: node_systemd_unit_state{name="containerd.service",state="active"} == 0
        for: 1m
        labels:
          severity: 严重
        annotations:
          summary: "IP为 {{ $labels.instance }} 的 containerd 服务已停止"
          description: "IP为 {{ $labels.instance }} 的 containerd 服务当前为非激活状态,请立即检查 containerd 服务状态。"

      - alert: etcd服务宕机
        expr: node_systemd_unit_state{name="etcd.service",state="active"} == 0
        for: 1m
        labels:
          severity: 严重
        annotations:
          summary: "IP为 {{ $labels.instance }} 的 etcd 服务已停止"
          description: "IP为 {{ $labels.instance }} 的 etcd 服务当前为非激活状态,请立即检查 etcd 及集群健康,防止数据不一致或集群无法选主。"

      - alert: kubeApiserver服务宕机
        expr: node_systemd_unit_state{name="kube-apiserver.service",state="active"} == 0
        for: 1m
        labels:
          severity: 严重
        annotations:
          summary: "IP为 {{ $labels.instance }} 的 kube-apiserver 服务已停止"
          description: "IP为 {{ $labels.instance }} 的 kube-apiserver 服务当前为非激活状态,将导致整个集群 API 不可用,请立即排查。"

      - alert: kubeControllerManager服务宕机
        expr: node_systemd_unit_state{name="kube-controller-manager.service",state="active"} == 0
        for: 1m
        labels:
          severity: 严重
        annotations:
          summary: "IP为 {{ $labels.instance }} 的 kube-controller-manager 服务已停止"
          description: "IP为 {{ $labels.instance }} 的 kube-controller-manager 服务当前为非激活状态,将导致副本控制器、节点控制器等无法工作,请立即修复。"

      - alert: kubeScheduler服务宕机
        expr: node_systemd_unit_state{name="kube-scheduler.service",state="active"} == 0
        for: 1m
        labels:
          severity: 严重
        annotations:
          summary: "IP为 {{ $labels.instance }} 的 kube-scheduler 服务已停止"
          description: "IP为 {{ $labels.instance }} 的 kube-scheduler 服务当前为非激活状态,将导致 Pod 无法被调度到新节点,请立即检查。"

      - alert: kubelet服务宕机
        expr: node_systemd_unit_state{name="kubelet.service",state="active"} == 0
        for: 1m
        labels:
          severity: 严重
        annotations:
          summary: "IP为 {{ $labels.instance }} 的 kubelet 服务已停止"
          description: "IP为 {{ $labels.instance }} 的 kubelet 服务当前为非激活状态,将导致该节点 Pod 生命周期无法管理,请立即恢复 kubelet。"

      - alert: kubeProxy服务宕机
        expr: node_systemd_unit_state{name="kube-proxy.service",state="active"} == 0
        for: 1m
        labels:
          severity: 严重
        annotations:
          summary: "IP为 {{ $labels.instance }} 的 kube-proxy 服务已停止"
          description: "IP为 {{ $labels.instance }} 的 kube-proxy 服务当前为非激活状态,将导致该节点服务流量无法转发,请立即检查。"

      - alert: chronyd服务宕机
        expr: node_systemd_unit_state{name=~"chronyd.service|chrony.service",state="active"} == 0
        for: 5m
        labels:
          severity: 警告
        annotations:
          summary: "IP为 {{ $labels.instance }} 的时间同步服务已停止"
          description: "时间不同步会引发证书校验、etcd 选主、日志对齐等问题,建议尽快恢复 chrony/ntp。"

  # =========================
  # 2) 节点资源与容量(带当前值)
  # =========================
  - name: 节点资源与容量
    rules:

      - alert: 节点CPU使用率过高
        expr: (1 - avg by (instance) (rate(node_cpu_seconds_total{mode="idle"}[5m]))) * 100 > 90
        for: 5m
        labels:
          severity: 警告
        annotations:
          summary: 'IP为 {{ $labels.instance }} 的 CPU 使用率过高'
          description: '当前CPU使用率为: {{ printf "%.2f" $value }}%,建议: 排查热点进程/Pod,或扩容节点资源。'

      - alert: 节点CPU使用率极高
        expr: (1 - avg by (instance) (rate(node_cpu_seconds_total{mode="idle"}[5m]))) * 100 > 97
        for: 5m
        labels:
          severity: 严重
        annotations:
          summary: 'IP为 {{ $labels.instance }} 的 CPU 使用率极高'
          description: '当前CPU使用率为: {{ printf "%.2f" $value }}%,建议: 立即定位热点,避免 kubelet/关键组件被拖慢。'

      - alert: 节点内存使用率过高
        expr: (1 - (node_memory_MemAvailable_bytes / node_memory_MemTotal_bytes)) * 100 > 90
        for: 10m
        labels:
          severity: 警告
        annotations:
          summary: 'IP为 {{ $labels.instance }} 的内存使用率过高'
          description: '当前内存使用率为: {{ printf "%.2f" $value }}%,建议: 排查内存大户进程/Pod,必要时提升内存或调整限额。'

      - alert: 节点内存使用率极高
        expr: (1 - (node_memory_MemAvailable_bytes / node_memory_MemTotal_bytes)) * 100 > 97
        for: 5m
        labels:
          severity: 严重
        annotations:
          summary: 'IP为 {{ $labels.instance }} 的内存压力极高'
          description: '当前内存使用率为: {{ printf "%.2f" $value }}%,建议: 高风险 OOM/驱逐,立即处理(释放内存/扩容/降载)。'

      - alert: 节点磁盘空间不足
        expr: (1 - node_filesystem_avail_bytes{fstype!~"tmpfs|overlay|squashfs|ramfs",mountpoint!="/media/cdrom"} / node_filesystem_size_bytes{fstype!~"tmpfs|overlay|squashfs|ramfs",mountpoint!="/media/cdrom"}) * 100 > 90
        for: 10m
        labels:
          severity: 警告
        annotations:
          summary: 'IP为 {{ $labels.instance }} 的磁盘使用率过高'
          description: '告警磁盘: {{ $labels.mountpoint }};当前使用率: {{ printf "%.2f" $value }}%;建议: 清理日志/容器镜像/临时文件,或扩容磁盘。'

      - alert: 节点磁盘空间极低
        expr: (1 - node_filesystem_avail_bytes{fstype!~"tmpfs|overlay|squashfs|ramfs",mountpoint!="/media/cdrom"} / node_filesystem_size_bytes{fstype!~"tmpfs|overlay|squashfs|ramfs",mountpoint!="/media/cdrom"}) * 100 > 95
        for: 5m
        labels:
          severity: 严重
        annotations:
          summary: 'IP为 {{ $labels.instance }} 的磁盘使用率极高'
          description: '告警磁盘: {{ $labels.mountpoint }};当前使用率: {{ printf "%.2f" $value }}%;建议: 立即处理,避免 kubelet/容器运行时写入失败导致节点异常。'

      - alert: 节点Inode不足
        expr: (1 - node_filesystem_files_free{fstype!~"tmpfs|overlay|squashfs|ramfs"} / node_filesystem_files{fstype!~"tmpfs|overlay|squashfs|ramfs"}) * 100 > 90
        for: 10m
        labels:
          severity: 警告
        annotations:
          summary: 'IP为 {{ $labels.instance }} 的 Inode 使用率过高'
          description: '告警磁盘: {{ $labels.mountpoint }};当前Inode使用率: {{ printf "%.2f" $value }}%;建议: 清理小文件(日志/缓存/容器层),避免创建文件失败。'

      - alert: 节点负载过高
        expr: (node_load1 / count without(cpu, mode) (node_cpu_seconds_total{mode="idle"})) > 2
        for: 10m
        labels:
          severity: 警告
        annotations:
          summary: 'IP为 {{ $labels.instance }} 的系统负载过高'
          description: '当前 Load1/CPU核数为: {{ printf "%.2f" $value }};建议: 可能存在 IO/CPU 饱和,排查 top、iostat、容器限流与磁盘问题。'


  # =========================
  # 3) 节点网络与系统资源(连接、句柄、错误包)
  # =========================
  - name: 节点网络与系统资源
    rules:

      - alert: 节点网络接收错误过多
        expr: rate(node_network_receive_errs_total{device!~"lo|veth.*|docker.*|cni.*|flannel.*|cali.*"}[5m]) > 10
        for: 10m
        labels:
          severity: 警告
        annotations:
          summary: 'IP为 {{ $labels.instance }} 的网络接收错误过多'
          description: '网卡: {{ $labels.device }};当前每秒接收错误: {{ printf "%.2f" $value }};建议: 排查物理链路/网卡驱动/丢包与交换机端口。'

      - alert: 节点网络发送错误过多
        expr: rate(node_network_transmit_errs_total{device!~"lo|veth.*|docker.*|cni.*|flannel.*|cali.*"}[5m]) > 10
        for: 10m
        labels:
          severity: 警告
        annotations:
          summary: 'IP为 {{ $labels.instance }} 的网络发送错误过多'
          description: '网卡: {{ $labels.device }};当前每秒发送错误: {{ printf "%.2f" $value }};建议: 排查链路质量/拥塞/驱动与 MTU 配置。'

      - alert: 节点conntrack使用率过高
        expr: (node_nf_conntrack_entries / node_nf_conntrack_entries_limit) * 100 > 80
        for: 10m
        labels:
          severity: 警告
        annotations:
          summary: 'IP为 {{ $labels.instance }} 的 conntrack 使用率过高'
          description: '当前使用率: {{ printf "%.2f" $value }}%;建议: 检查连接风暴/异常流量,必要时调大 nf_conntrack_max。'

      - alert: 节点文件句柄使用率过高
        expr: (node_filefd_allocated / node_filefd_maximum) * 100 > 80
        for: 10m
        labels:
          severity: 警告
        annotations:
          summary: 'IP为 {{ $labels.instance }} 的文件句柄使用率过高'
          description: '当前使用率: {{ printf "%.2f" $value }}%;建议: 排查打开文件数异常的进程/容器,必要时提升系统限制。'


  # ==================================================
  # 4) Pod/容器层(需要 kube-state-metrics)
  # ==================================================
  - name: Pod与容器状态
    rules:

      - alert: Pod崩溃循环
        expr: kube_pod_container_status_waiting_reason{reason="CrashLoopBackOff"} == 1
        for: 5m
        labels: { severity: 严重 }
        annotations:
          summary: 'Pod CrashLoopBackOff'
          description: 'namespace={{ $labels.namespace }} pod={{ $labels.pod }} container={{ $labels.container }} 发生 CrashLoopBackOff。'

      - alert: 镜像拉取失败
        expr: kube_pod_container_status_waiting_reason{reason=~"ImagePullBackOff|ErrImagePull"} == 1
        for: 5m
        labels: { severity: 严重 }
        annotations:
          summary: '镜像拉取失败'
          description: 'namespace={{ $labels.namespace }} pod={{ $labels.pod }} container={{ $labels.container }} 镜像拉取失败。'

      - alert: Pod频繁重启
        expr: increase(kube_pod_container_status_restarts_total[30m]) > 3
        for: 5m
        labels: { severity: 警告 }
        annotations:
          summary: 'Pod重启次数过多'
          description: 'namespace={{ $labels.namespace }} pod={{ $labels.pod }} container={{ $labels.container }} 30分钟内重启>3次。'

      - alert: Pod未就绪
        expr: kube_pod_status_ready{condition="true"} == 0 and kube_pod_status_phase{phase=~"Running|Pending|Unknown"} == 1
        for: 10m
        labels: { severity: 警告 }
        annotations:
          summary: 'Pod长时间未Ready'
          description: 'namespace={{ $labels.namespace }} pod={{ $labels.pod }} 持续10分钟未Ready,请检查探针/依赖/资源。'


  # ==================================================
  # 5) Workload 层(Deployment/StatefulSet/DaemonSet)
  # ==================================================
  - name: Workload副本与发布
    rules:

      - alert: Deployment副本不足
        expr: kube_deployment_status_replicas_available < kube_deployment_spec_replicas
        for: 10m
        labels: { severity: 警告 }
        annotations:
          summary: 'Deployment副本不足'
          description: 'namespace={{ $labels.namespace }} deployment={{ $labels.deployment }} 可用副本低于期望值。'

      - alert: StatefulSet副本不足
        expr: kube_statefulset_status_replicas_ready < kube_statefulset_spec_replicas
        for: 10m
        labels: { severity: 警告 }
        annotations:
          summary: 'StatefulSet副本不足'
          description: 'namespace={{ $labels.namespace }} statefulset={{ $labels.statefulset }} 就绪副本不足。'

      - alert: DaemonSet调度异常
        expr: kube_daemonset_status_number_misscheduled > 0 or kube_daemonset_status_desired_number_scheduled != kube_daemonset_status_current_number_scheduled
        for: 10m
        labels: { severity: 警告 }
        annotations:
          summary: 'DaemonSet调度异常'
          description: 'namespace={{ $labels.namespace }} daemonset={{ $labels.daemonset }} 调度数量不一致或存在误调度。'


  # ==================================================
  # 6) 调度与容量(Pending/资源逼近)
  # ==================================================
  - name: 调度与容量风险
    rules:

      - alert: Pod长时间Pending
        expr: kube_pod_status_phase{phase="Pending"} == 1
        for: 10m
        labels: { severity: 警告 }
        annotations:
          summary: 'Pod长时间Pending'
          description: 'namespace={{ $labels.namespace }} pod={{ $labels.pod }} Pending超过10分钟,可能资源不足或约束不满足。'

      - alert: 集群CPURequests接近耗尽
        expr: (sum(kube_pod_container_resource_requests{resource="cpu"}) / sum(kube_node_status_allocatable{resource="cpu"})) * 100 > 90
        for: 10m
        labels: { severity: 警告 }
        annotations:
          summary: '集群CPU requests接近耗尽'
          description: '当前CPU requests占比: {{ printf "%.2f" $value }}%,阈值: 90%,持续: 10分钟。'

      - alert: 集群内存Requests接近耗尽
        expr: (sum(kube_pod_container_resource_requests{resource="memory"}) / sum(kube_node_status_allocatable{resource="memory"})) * 100 > 90
        for: 10m
        labels: { severity: 警告 }
        annotations:
          summary: '集群内存 requests接近耗尽'
          description: '当前内存 requests占比: {{ printf "%.2f" $value }}%,阈值: 90%,持续: 10分钟。'
6.1 配置完成告警规则重载 Prometheus 配置
localhost可换为IP;
bash
curl -X POST http://localhost:9090/-/reload6.2 Prometheus 页面查看告警规则
172.16.11.230:9090/targets
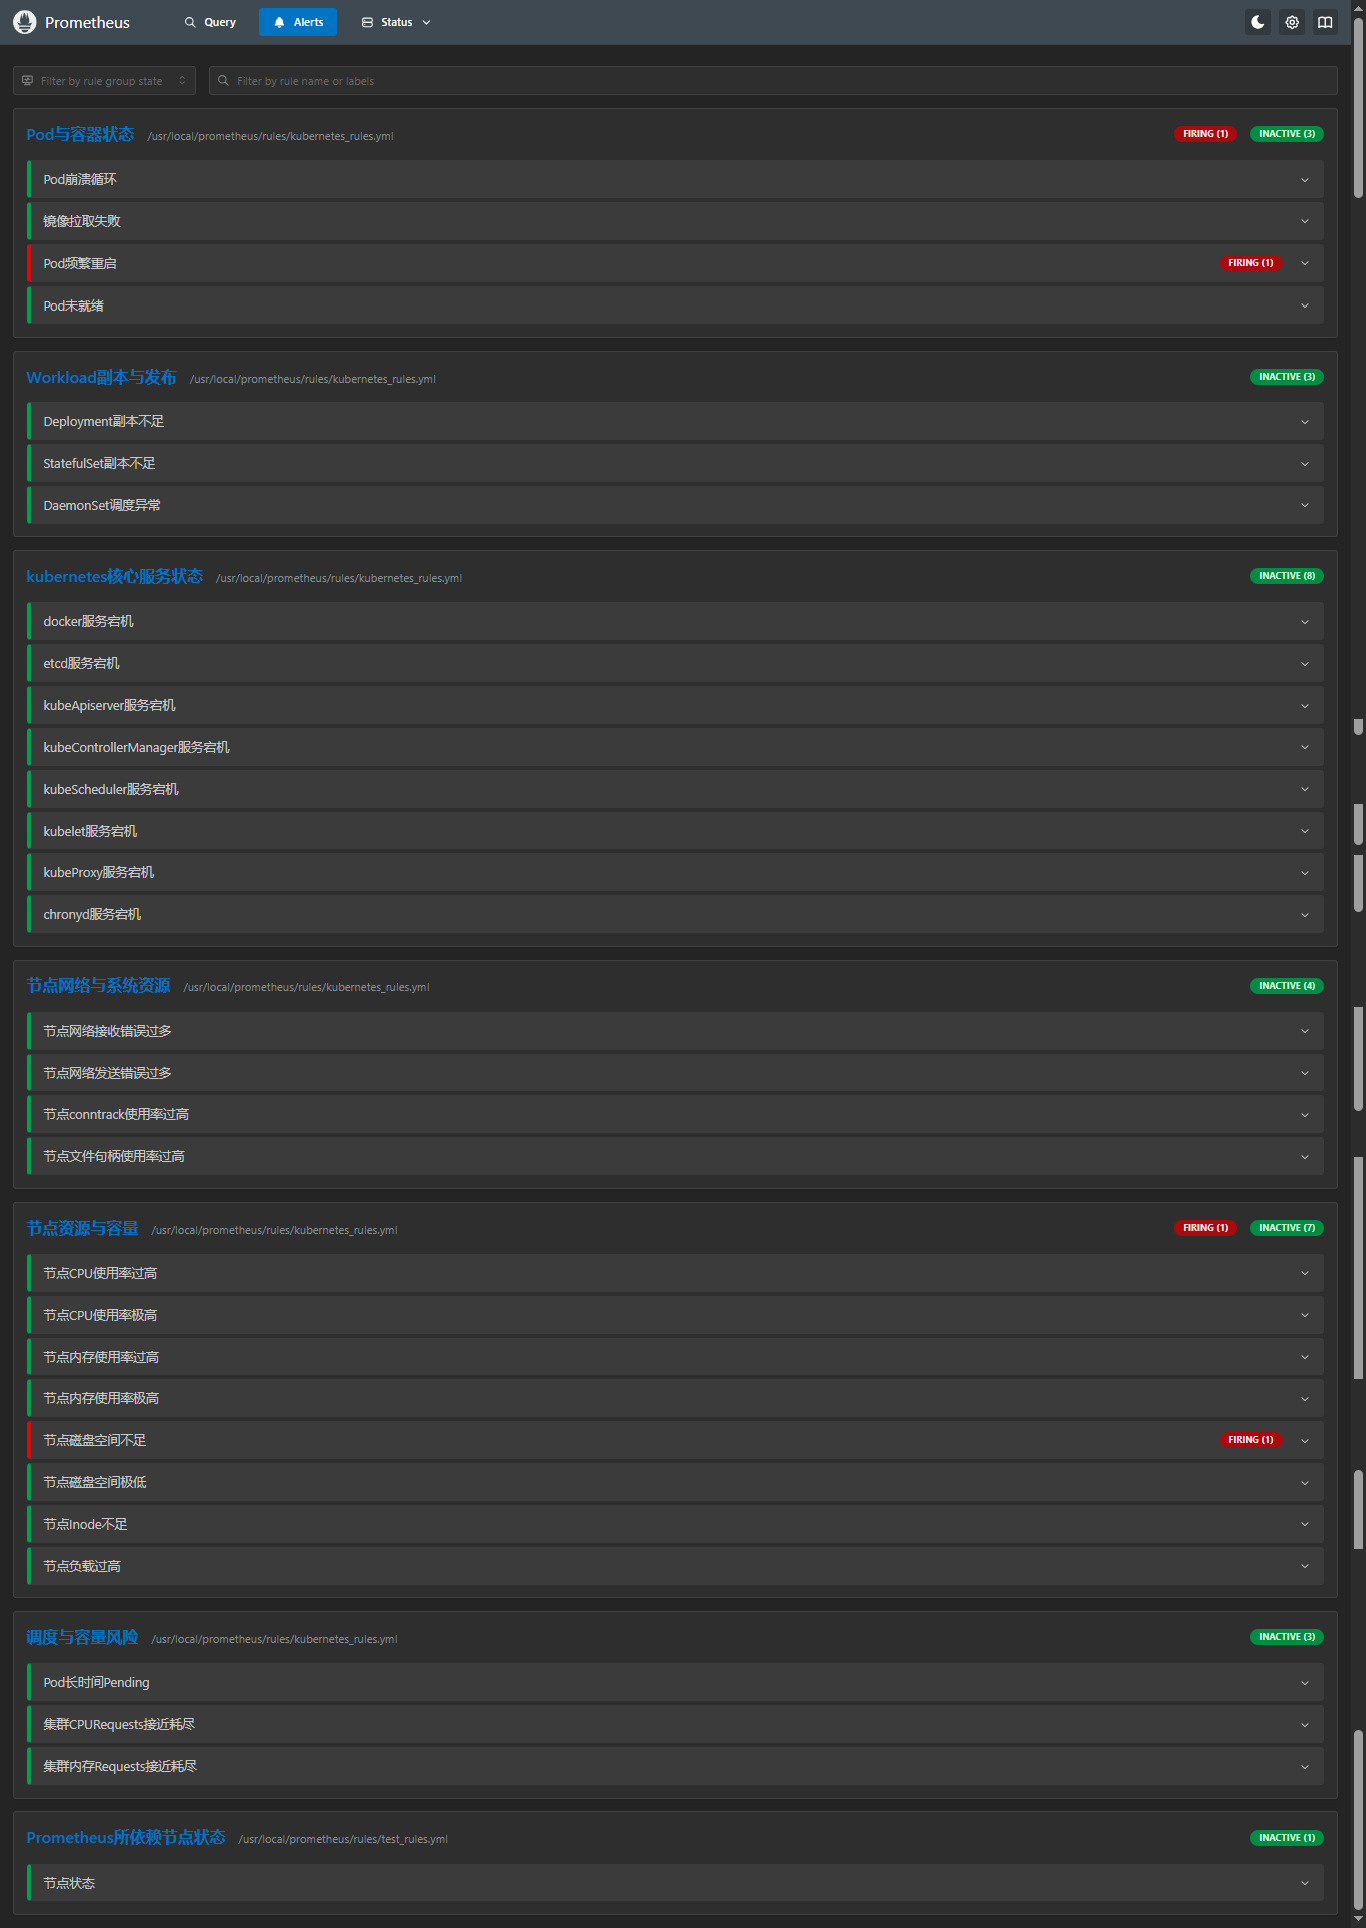
配置完成!!!