项目演示
说明:本项目系华南理工大学五人团队根据相关课程要求设计开发的项目,融合【前端MVC和AspNetCore页面-后端EFCore+SQLite数据库-机器学习和统计学习预测】三链条技术栈。同时包括3个月校园食堂高精度仿真数据的制备环节。
本文是个人独立撰写的记录该项目设计和技术开发流程的博文,使用英文记述。
Content
[(1) Technical Approach & Interface Design](#(1) Technical Approach & Interface Design)
[(2) Interaction Design](#(2) Interaction Design)
[(3) Iterative Relational-Schema Design](#(3) Iterative Relational-Schema Design)
[(4) Data Ingestion & Sanitization](#(4) Data Ingestion & Sanitization)
[(5) Analytics: Daily Foot-Traffic & Dish-Sales Forecasting](#(5) Analytics: Daily Foot-Traffic & Dish-Sales Forecasting)
[5.1 Algorithm Overview & Data Preparation](#5.1 Algorithm Overview & Data Preparation)
[5.2 Evaluation & Model Selection](#5.2 Evaluation & Model Selection)
[5.3 Model Prediction (Cuisine Sales in the next 7 days)](#5.3 Model Prediction (Cuisine Sales in the next 7 days))
[(6) Synthetic-Data Generation](#(6) Synthetic-Data Generation)
[6.1 Foot-Traffic Simulation](#6.1 Foot-Traffic Simulation)
[6.2 Window Data(Not including auto-generation script)](#6.2 Window Data(Not including auto-generation script))
[6.3 Students' visits Data](#6.3 Students’ visits Data)
[6.4 Ingredients Purchasing(Not including auto-generation script)](#6.4 Ingredients Purchasing(Not including auto-generation script))
[6.5 Cuisine Sales](#6.5 Cuisine Sales)
[(7) Brilliant Ideas](#(7) Brilliant Ideas)
[(8) Future Enhancements](#(8) Future Enhancements)
Smart Canteen System is a dual-user sales recording and intervention system primarily targeting canteen vendors and school managers.
The core optimization objectives address different needs for each user role:
(1) Data Recording Function: Through database technology, the system records daily/weekly/monthly dish information, sales volume, and customer traffic patterns. This helps tenant vendors understand their operational performance, enabling adjustments to raw material procurement cycles and quantities, as well as staff allocation. Simultaneously, it assists management in monitoring different vendors' revenue streams, facilitating vendor selection and tendering processes.
(2) Predictive Analytics Function: Utilizing statistical models alongside machine learning and deep learning algorithms, the system provides daily forecasts for customer traffic and dish sales volume, with performance evaluation through scientific metrics. This enables vendors to anticipate future sales trends for menu items, supporting strategic planning for menu innovation and portion sizing. Additionally, it helps schools understand dynamic vendor performance trends.
Technical Architecture: We employ a web-based interactive frontend coupled with a backend database and regression prediction model framework. The organizational structure diagram is presented below.
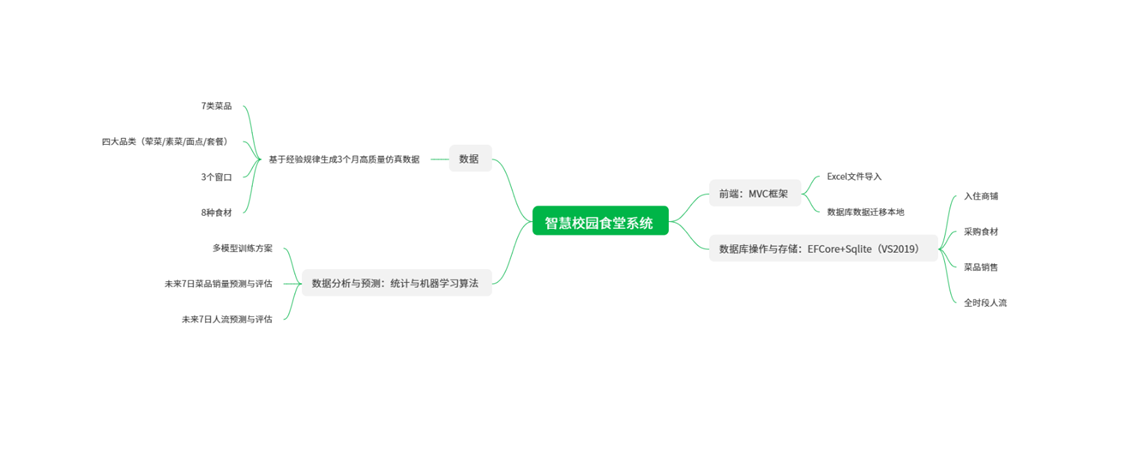
Figure 1 System Architecture Design
Figure 2 Major Design---Database System (EntityFramework and SQLite based)
(1) Technical Approach & Interface Design
The frontend web interface is built using CSHTML scripts and the MVC framework. Currently, the system does not yet support differentiated database read/write permissions for vendor and school-administrator logins; developing granular database-access control is one of our planned enhancements.
The frontend is organized into four main sections:
-
Data-upload zone
-
Foot-traffic prediction panel*(display-only at present)
-
Dish-sales prediction panel(display-only at present)
-
Python-based machine-learning prediction zone (local database migration + script invocation)
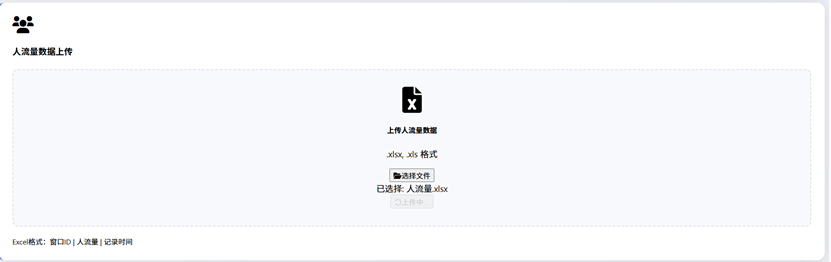
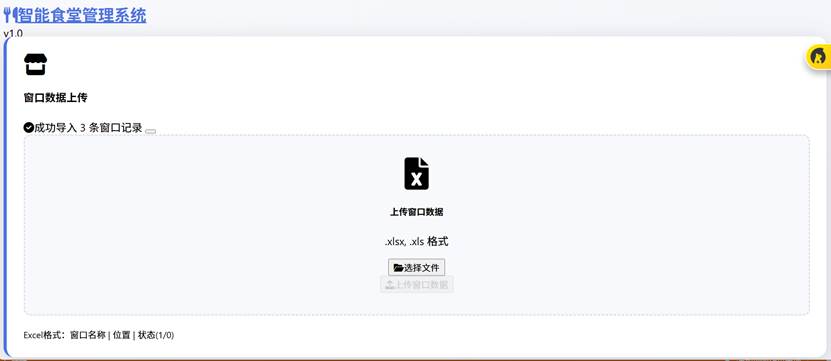
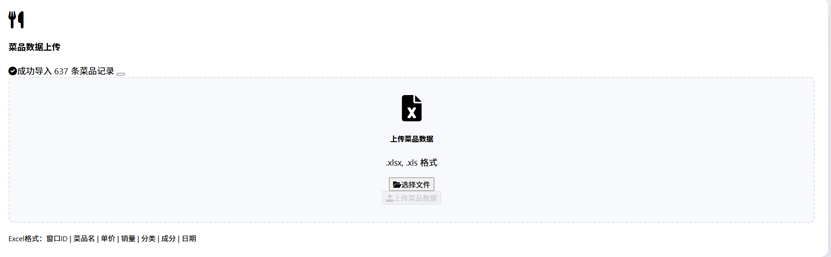
Figure 3 Data Upload Zones(With data format requirements placed at left-bottom corner, column order should be strictly matched)
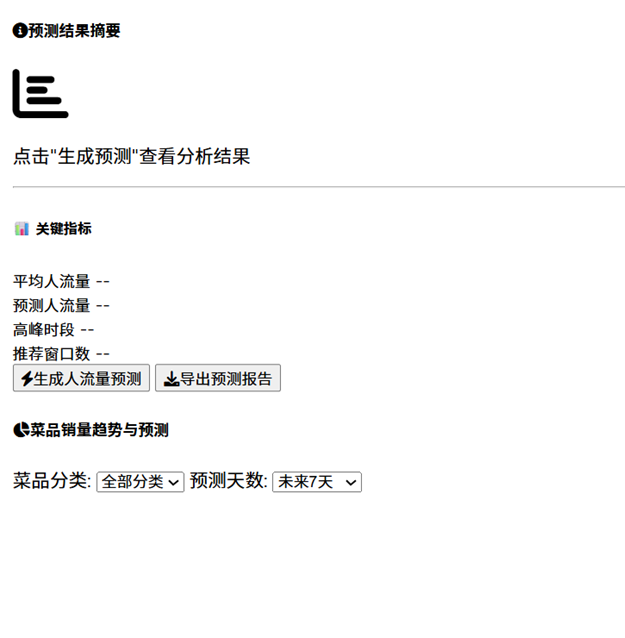
Figure 4 Students' visits prediction demo
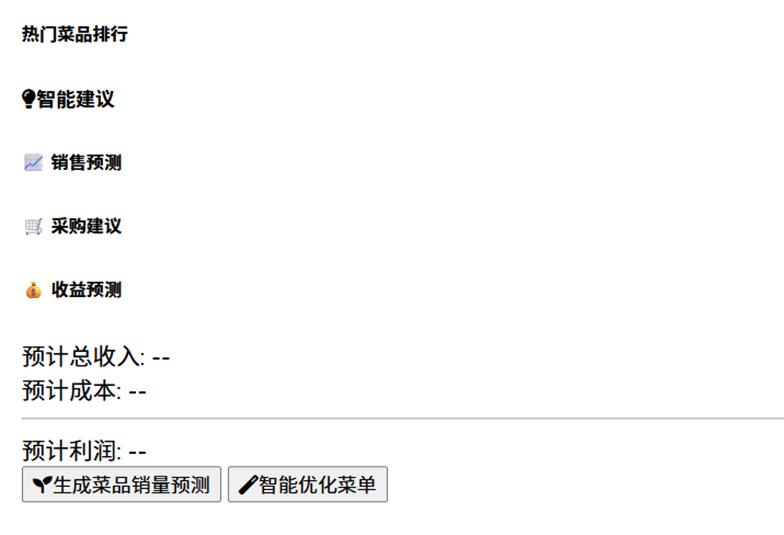
Figure 5 Cuisine Sales Prediction Demo
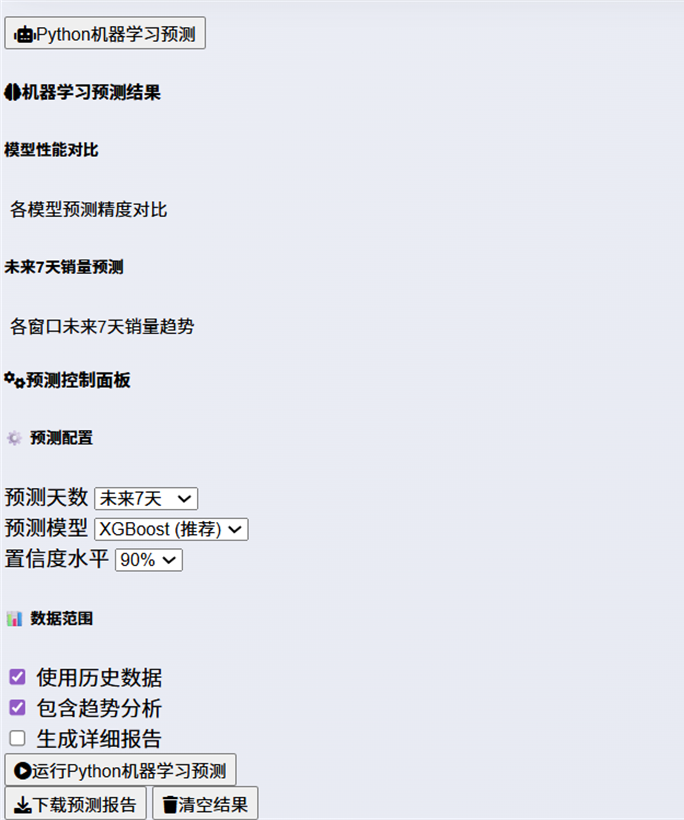
Figure 6 Python Script Prediction Zone
(2) Interaction Design
Data persistence and CRUD operations rely on the Microsoft.EntityFrameworkCore and Microsoft.EntityFrameworkCore.Sqlite stacks, implemented in C#. The layer provides basic create-read-update-delete capability but does not yet support multi-criteria, compound queries.
(3) Iterative Relational-Schema Design
The database model is partitioned into four core relations:
-
foot-traffic
-
menu-item (dish)
-
raw-material
-
vendor-window
Each relation has been refined iteratively: attributes (fields), domains, and permissible value ranges were specified in response to evolving business requirements.
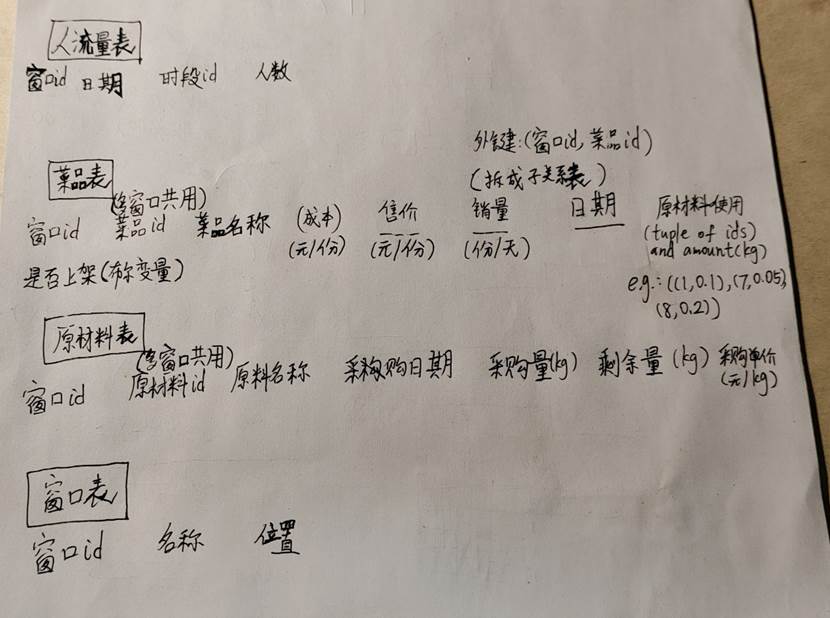
Figure 7 Relation Schema Design
(4) Data Ingestion & Sanitization
The main interaction style is uploading Excel workbooks.
Primary-key checks are enforced to prevent duplicates and to improve data reliability (see the following figure).
For every relation we expose a dedicated upload handler inside HomeController.cs; the figure excerpts the Cuisine bulk-import and processing routine.


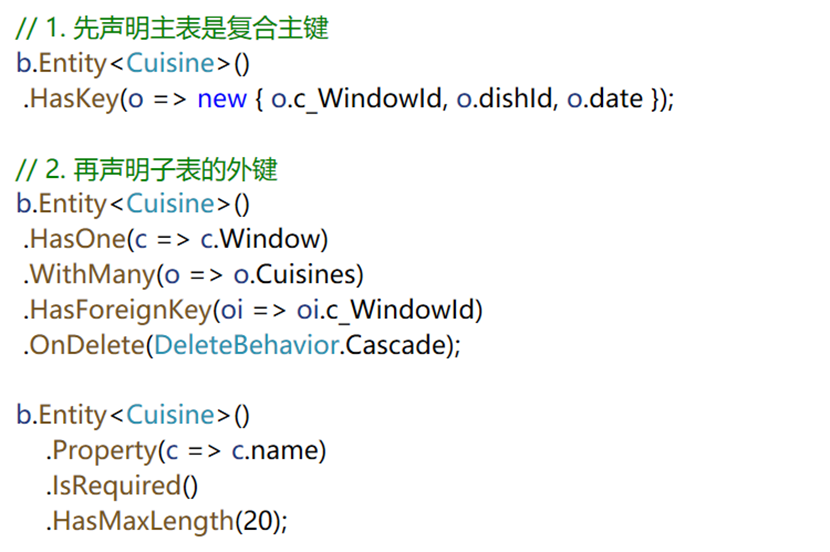
Figure 8 Use FluentAPI to define primary key, foreign key and constraints
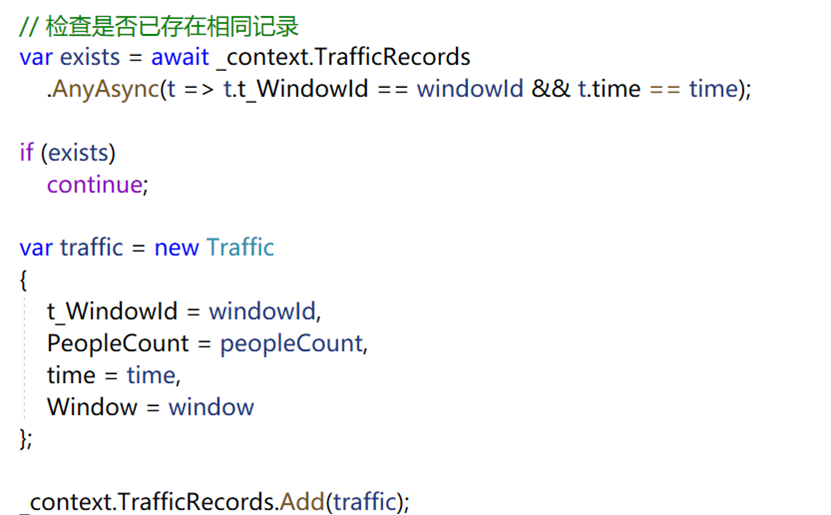
Figure 9 A Second Time Data Creation Caused Primary Key Conflict Preservation
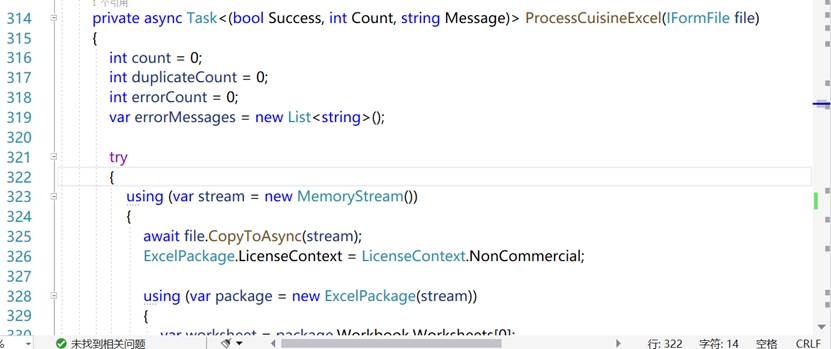
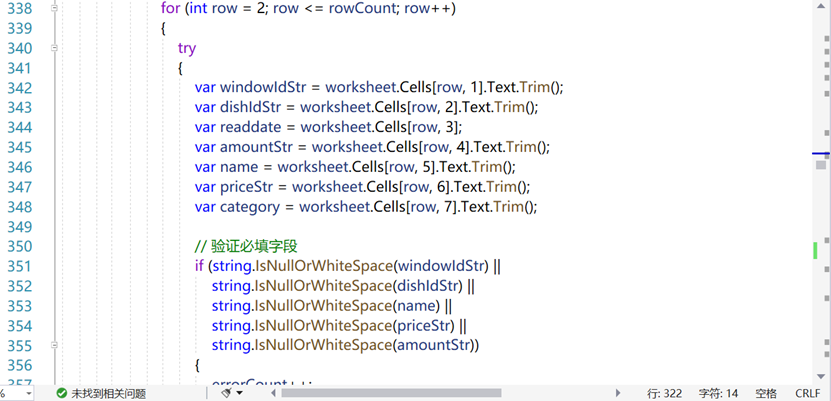
Figure 10 Cuisine Table Upload and Processing
(5) Analytics: Daily Foot-Traffic & Dish-Sales Forecasting
5.1 Algorithm Overview & Data Preparation
Per window we forecast:
-
hourly foot-traffic per day
-
daily dish-sales
The system, by default, generates a 7-day horizon, with emphasis on dish-sales accuracy.
All relevant records (or a filtered subset) are first exported to a local Excel file; the workbook is then fed to the training pipeline.
Model zoo:
-
Statistical baseline: multiple linear regression
-
Machine-learning candidates: LightGBM, XGBoost, RandomForest
Architecture is identical across windows; hyper-parameters are tuned per window according to sales volatility and training-set size.
5.2 Evaluation & Model Selection
Because dish-sales volumes vary by orders of magnitude, absolute error is misleading. We therefore adopt:
-
MAPE (Mean Absolute Percentage Error) as the primary loss
-
R² to quantify the linear agreement between predicted and actual sales
Models are ranked on these metrics and the top performer is promoted to production.
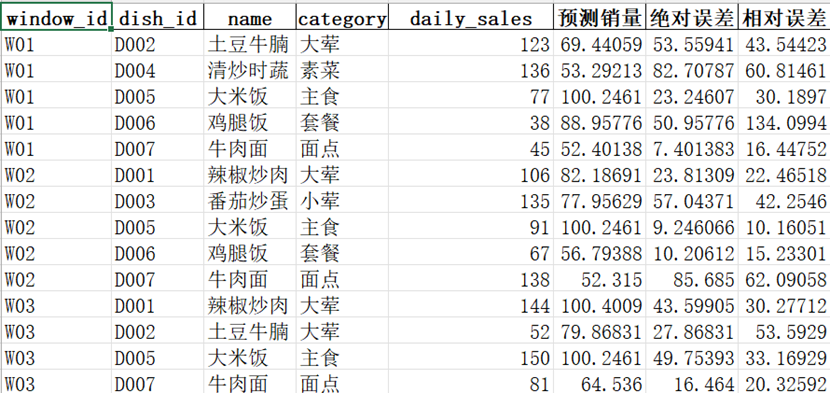
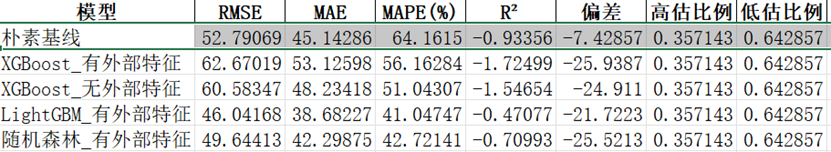
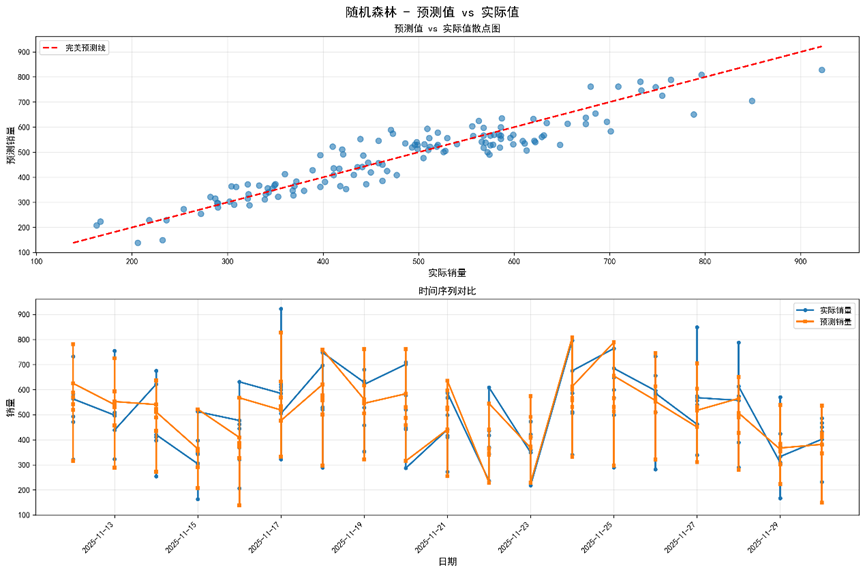
Figure 11 A demonstration of index evaluation on 6 days train and 1 day validation
The closer R² is to 1 and the closer MAPE is to 0, the better the predictive performance. Empirical tests on our dataset show that, among the four candidate models, Random Forest delivers the best results.
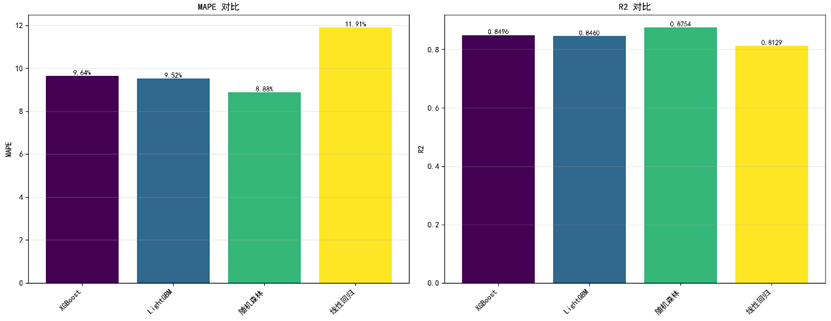
Figure 12 Evaluation on performance of 4 algorithms based on simulation dataset (4:1 train valid split) ----MAPE && R2
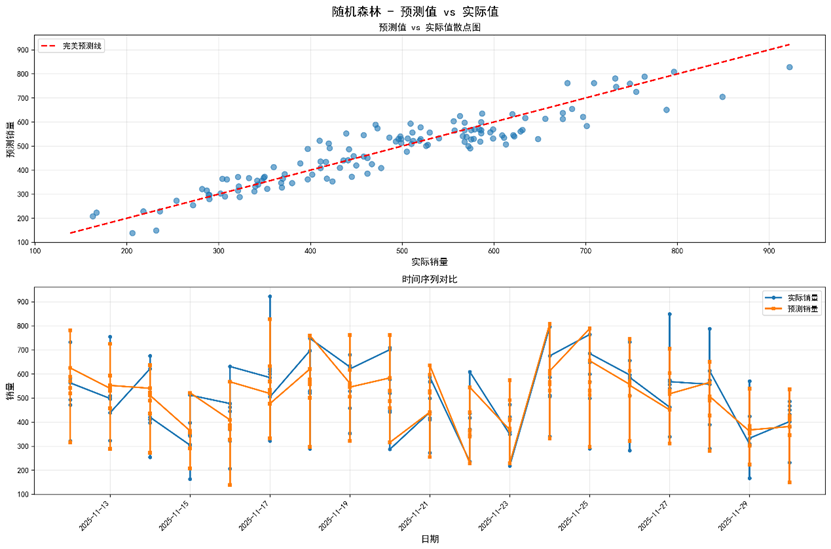
Figure 13 Best evaluation performance attributes to RRF Machine-Learning model
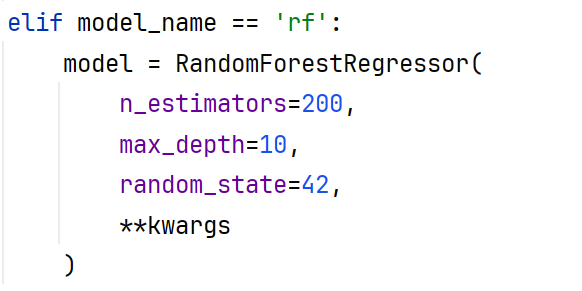
Figure 14 Random Regression Forest hyperparameters setting
5.3 Model Prediction (Cuisine Sales in the next 7 days)
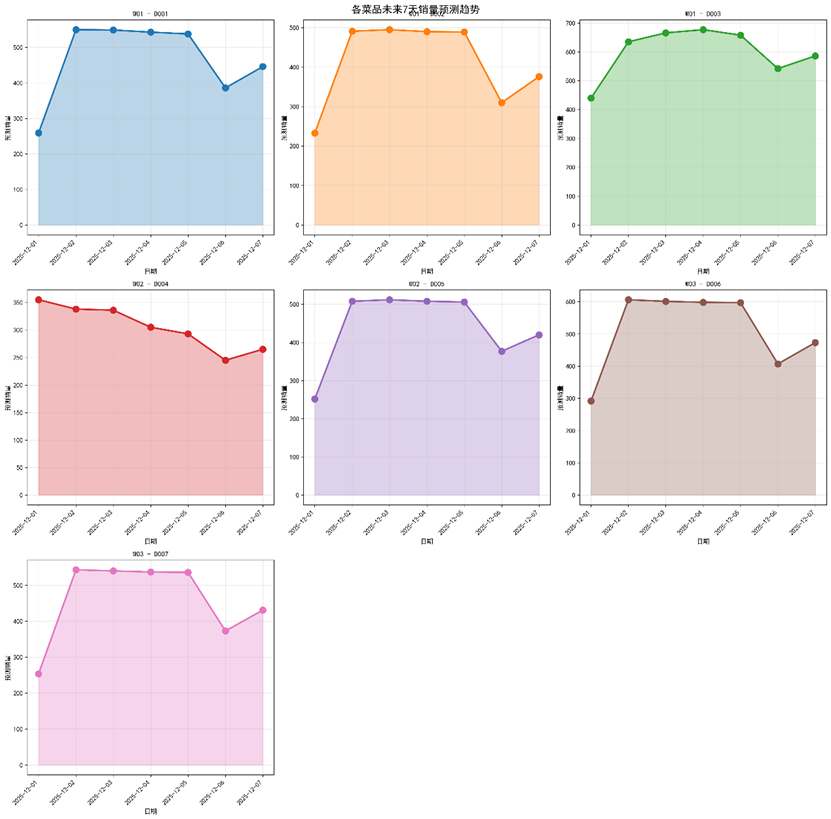
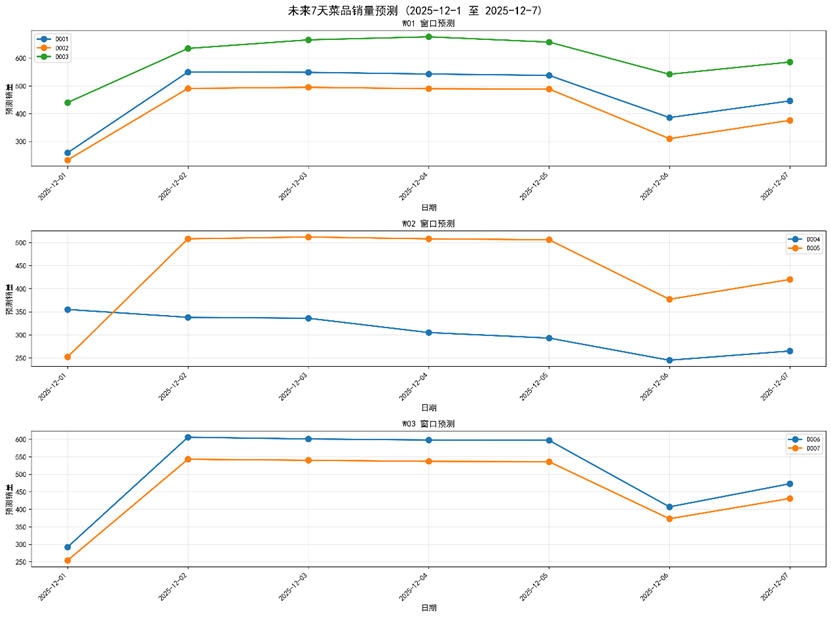
Figure 15 Sales amount prediction for 7 dishes among 3 windows in the next week based on3-month high-quality simulation dataset
(6) Synthetic-Data Generation
Owing to limited manpower and tight schedule, real sales and foot-traffic records from campus canteens were unavailable. We therefore employed an AI-driven generator, injecting externally validated rules to produce behaviour-plausible data. The current corpus covers 3 windows, 3 months, 7 dishes and 4 categories (vegetarian / meat / set meal / pastry).
6.1 Foot-Traffic Simulation
Key drivers embedded in the generator are:
-
meal-period effect
-
window-specific popularity index
-
weekday vs. holiday (including weekend) differential
-
weather condition
Dish-sales volumes are coupled directly to the generated traffic curve.
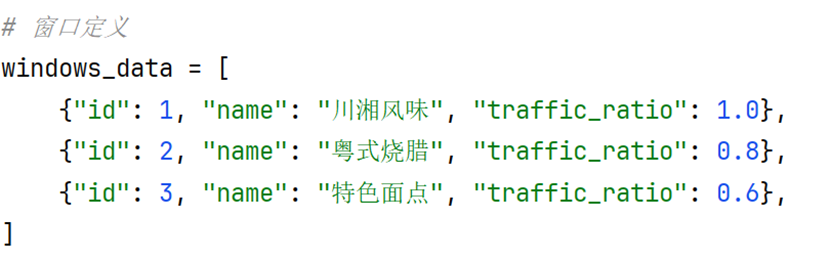
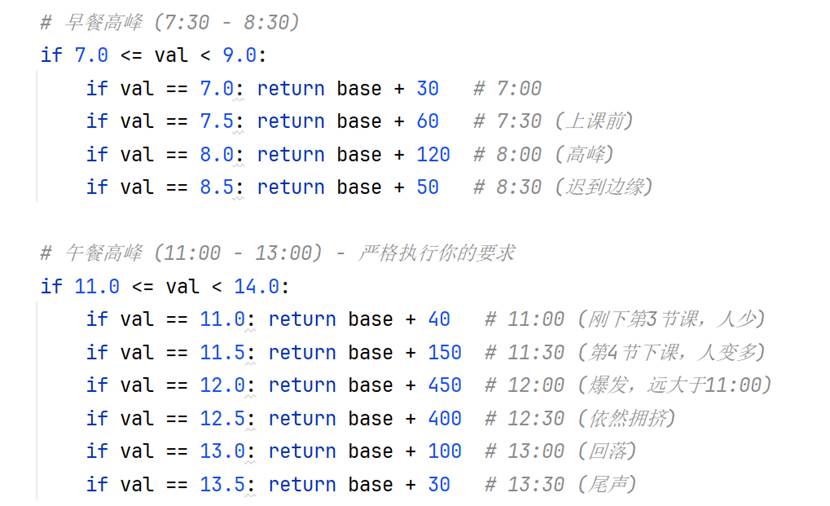
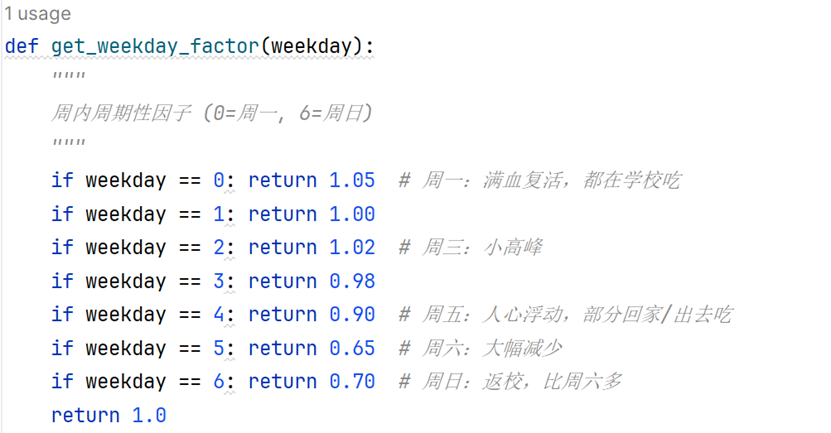
Figure 16 人流量数据计算依据
# Weather and Mood Impacts on dining

Considering time, window and weekday effects

# Other Influence

Note: Because data quality governs model evaluation and selection, future work will either scrape publicly available university-canteen data sets or collect ground-truth statistics offline.
6.2 Window Data(Not including auto-generation script)
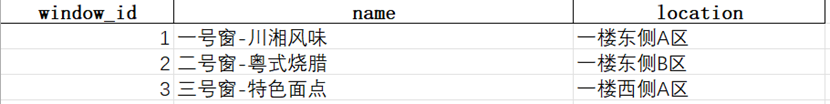
Simulation data of three windows, containing primary key id, window name and selective attribute location.
6.3 Students' visits Data
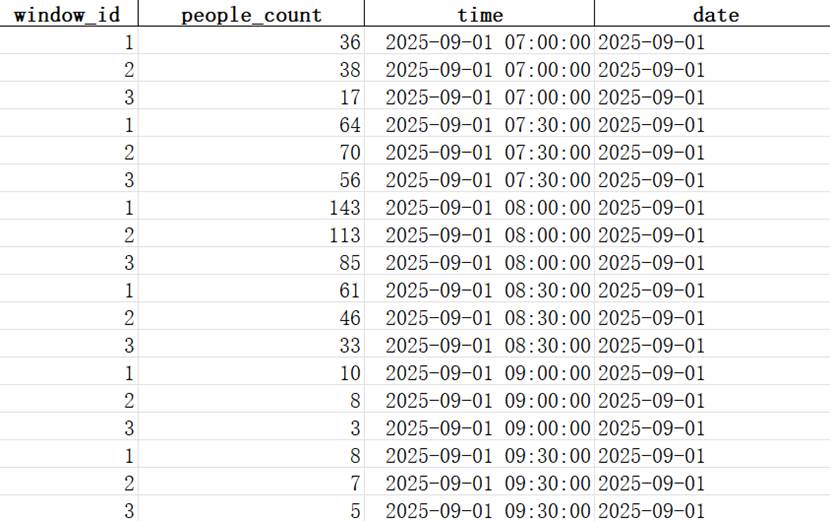
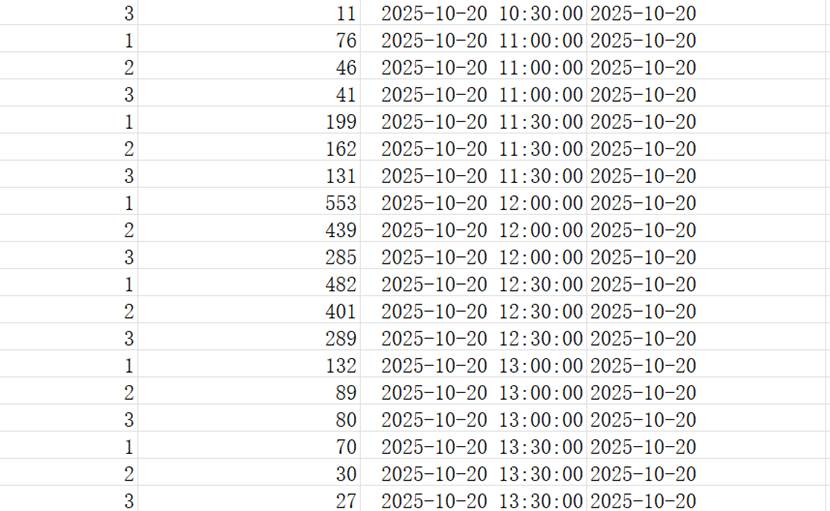
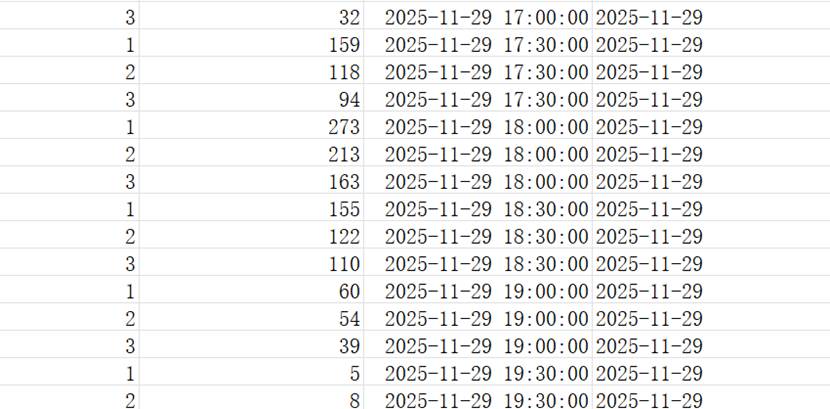
Visits to the three different windows around dining time in the morning, afternoon and evening.
Primary key is (window_id, time).
6.4 Ingredients Purchasing(Not including auto-generation script)
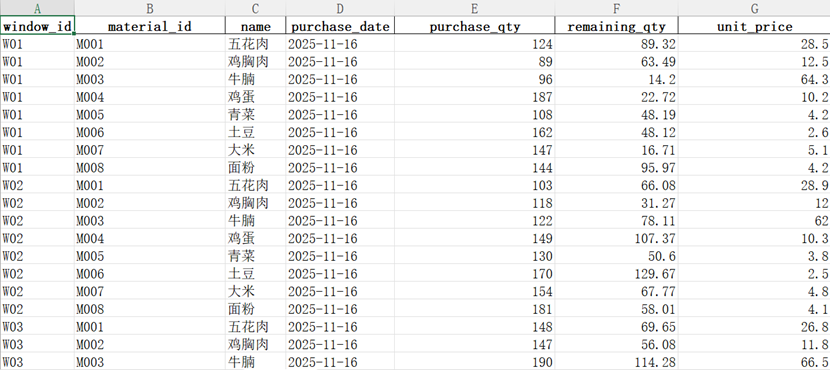
Simulation of type, purchasing date, purchasing amount, left(wasted) amount and unit cost of ingredients.
Primary key is (window_id, material_id, purchase_date).
6.5 Cuisine Sales
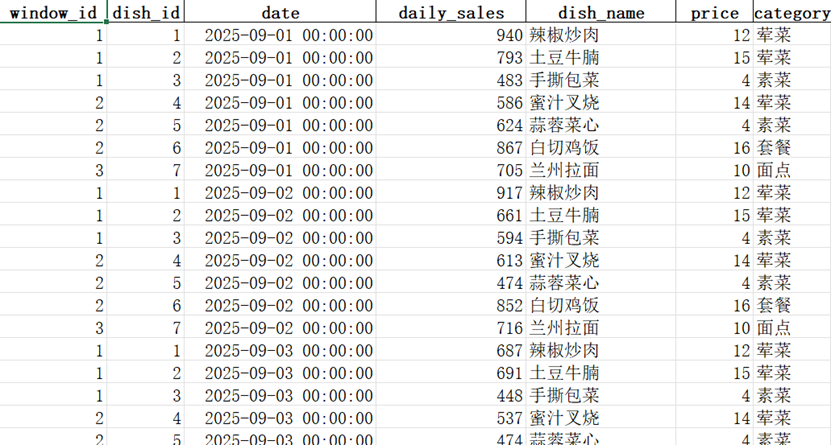
Including cuisine name, category, unit sales price, sales amount, sales date, components of dish, where primary key is (window_id, dish_id, sales_date).
(7) Brilliant Ideas
-
The four-table schema (window -- dish -- raw material -- foot-traffic) mirrors operational reality, supplying vendors with actionable insights for staffing, menu renewal and procurement tuning.
-
Beyond conventional OLTP storage, an online analytical layer captures aggregate sales momentum and latent potential, furnishing school administrators with evidence-based decision support.
(8) Future Enhancements
-
Refactor the relational model: purge redundant attributes (e.g., "on-shelf status") and normalise to 3NF/BCNF to boost storage efficiency.
-
Introduce role-based registration and fine-grained access control for distinct user types.
-
Institute stricter data-provenance and quality protocols to guarantee authenticity of collected or simulated inputs.
-
Enrich DB interaction---multi-criteria query builder, polished UI, and expanded feedback/print utilities.