作者,Evil Genius
2025最后一天了,希望来马年真的马到成功。
最后一天,我们来解析一下空间转录组的通讯细节。受体细胞"关注"其周围的发送细胞,而这些发送细胞的影响通过注意力加权聚合后,共同决定受体细胞的表型。
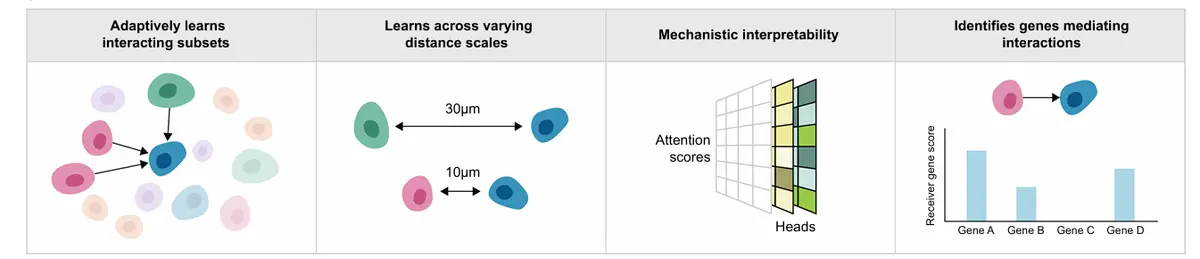
分析目标有三个
自适应地学习跨不同空间尺度的细胞互作;
解析依赖于空间位置的互作细胞亚群;
并将互作与受体细胞的下游功能效应(如转录程序变化)建立联系。
所推断出的LR权重同时依赖于邻近细胞的表型及其与受体细胞的空间距离,能够识别出哪些发送细胞亚群在何种距离上对受体产生影响。
看看示例代码
#!pip install -q amici-st
import os
import torch
import scanpy as sc
import numpy as np
import pandas as pd
import pytorch_lightning as pl
import seaborn as sns
import matplotlib.pyplot as plt
from amici import AMICI
from amici.callbacks import AttentionPenaltyMonitor
from amici.interpretation import (
AMICICounterfactualAttentionModule,
AMICIAttentionModule,
AMICIAblationModule,
)
# Load data
adata_path = "./data/mouse_cortex_tutorial.h5ad"
adata = sc.read(adata_path, backup_url="https://figshare.com/ndownloader/files/58303438")
# Saving the spatial coordinates in the adata.obsm["spatial"] key
adata.obsm["spatial"] = adata.obs[["centroid_x", "centroid_y"]].values
adata_train = adata[adata.obs['in_test'] == False].copy()
adata_test = adata[adata.obs['in_test'] == True].copy()
print("Train set size: ", adata_train.shape)
print("Test set size: ", adata_test.shape)
# Create the cell type palette
labels_key = "subclass"
CELL_TYPE_PALETTE = {
# Excitatory Neurons
"L2/3 IT": "#e41a1c",
"L4/5 IT": "#ff7f00",
"L5 IT": "#fdbf6f",
"L5 ET": "#e31a1c",
"L6 IT": "#6a3d9a",
"L6 IT Car3": "#cab2d6",
"L6 CT": "#fb9a99",
"L5/6 NP": "#a6cee3",
"L6b": "#1f78b4",
# Inhibitory Neurons
"Pvalb": "#8dd3c7",
"Sst": "#80b1d3",
"Lamp5": "#33a02c",
"Vip": "#b2df8a",
"Sncg": "#bc80bd",
# Glial Cells
"Astro": "#bebada",
"Oligo": "#fb8072",
"OPC": "#b3de69",
"Micro": "#fccde5",
"VLMC": "#d9d9d9",
# Vascular Cells
"Endo": "#ffff33",
"Peri": "#ffffb3",
"PVM": "#fdb462",
"SMC": "#8dd3c7",
# Other
"other": "#999999",
}
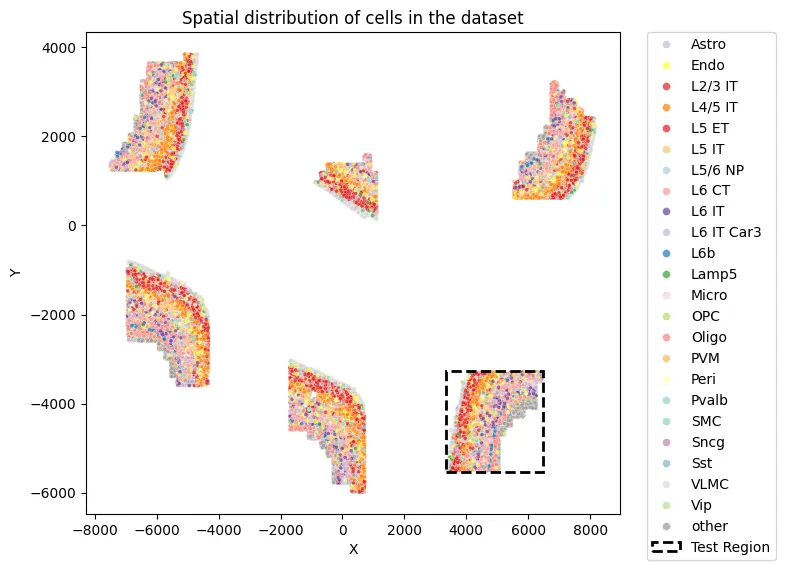
def visualize_spatial_distribution(adata, labels_key="subclass", x_lim=None, y_lim=None):
plot_df = pd.DataFrame(adata.obsm["spatial"].copy(), columns=["X", "Y"])
plot_df[labels_key] = adata.obs[labels_key].values
plot_df["in_test"] = adata.obs["in_test"].values
plot_df["slice_id"] = adata.obs["slice_id"].values
plt.figure(figsize=(8, 6))
sns.scatterplot(
plot_df, x="X", y="Y", hue=labels_key, alpha=0.7, s=8, palette=CELL_TYPE_PALETTE
)
test_df = plot_df[plot_df["in_test"] == True]
if len(test_df) > 0:
min_x, max_x = test_df["X"].min(), test_df["X"].max()
min_y, max_y = test_df["Y"].min(), test_df["Y"].max()
width = max_x - min_x
height = max_y - min_y
padding = 20
rect = plt.Rectangle(
(min_x - padding, min_y - padding),
width + 2*padding,
height + 2*padding,
fill=False,
color='black',
linestyle='--',
linewidth=2,
label=f'Test Region'
)
plt.gca().add_patch(rect)
plt.xlabel("X")
plt.ylabel("Y")
plt.title(f"Spatial distribution of cells in the dataset")
handles, labels = plt.gca().get_legend_handles_labels()
plt.legend(
handles=handles,
labels=labels,
bbox_to_anchor=(1.05, 1),
loc="upper left",
borderaxespad=0.0,
markerscale=2
)
if x_lim is not None:
plt.xlim(0, x_lim)
if y_lim is not None:
plt.ylim(0, y_lim)
plt.tight_layout()
plt.show()
visualize_spatial_distribution(adata)
# Set up the seed for reproducibility
seed = 18
pl.seed_everything(seed)
penalty_schedule_params = {
"start_val": 1e-6,
"end_val": 1e-3,
"epoch_start": 10,
"epoch_end": 30,
"flavor": "linear",
}
model_params = {
"n_heads": 8,
"n_query_dim": 128,
"n_head_size": 32,
"n_nn_embed": 256,
"n_nn_embed_hidden": 512,
"attention_dummy_score": 3.0,
"neighbor_dropout": 0.1,
"attention_penalty_coef": penalty_schedule_params[
"start_val"
],
"value_l1_penalty_coef": 1e-5,
}
exp_params = {
"lr": 1e-3,
"epochs": 400,
"batch_size": 512,
"early_stopping": True,
"early_stopping_monitor": "elbo_validation",
"early_stopping_patience": 20,
"learning_rate_monitor": True,
"n_neighbors": 50,
}
AMICI.setup_anndata(
adata_train,
labels_key=labels_key,
coord_obsm_key="spatial",
n_neighbors=exp_params["n_neighbors"],
)
model = AMICI(adata_train, **model_params)
model_path = os.path.join(
"./saved_models",
f"cortex_{seed}_params",
)
plan_kwargs = {}
if "lr" in exp_params:
plan_kwargs["lr"] = exp_params["lr"]
model.train(
max_epochs=int(exp_params.get("epochs")),
batch_size=int(exp_params.get("batch_size")),
plan_kwargs=plan_kwargs,
early_stopping=exp_params.get("early_stopping"),
early_stopping_monitor=exp_params.get("early_stopping_monitor"),
early_stopping_patience=exp_params.get("early_stopping_patience"),
check_val_every_n_epoch=1,
callbacks=[
AttentionPenaltyMonitor(
**penalty_schedule_params
),
],
)
model.save(model_path, overwrite=True)
AMICI.setup_anndata(
adata,
labels_key=labels_key,
coord_obsm_key="spatial",
n_neighbors=exp_params["n_neighbors"],
)
# Get test set metrics
test_elbo = model.get_elbo(
adata, indices=np.where(adata.obs["in_test"])[0], batch_size=128
).item()
test_reconstruction_loss = model.get_reconstruction_error(
adata, indices=np.where(adata.obs["in_test"])[0], batch_size=128
)["reconstruction_loss"]
print(f"Test ELBO: {test_elbo}")
print(f"Test Reconstruction Loss: {test_reconstruction_loss}")
model = AMICI.load(
model_path,
adata=adata,
)
AMICI.setup_anndata(
adata,
labels_key=labels_key,
coord_obsm_key="spatial",
n_neighbors=exp_params["n_neighbors"],
)
ablation_residuals_path = "./data/cortex_ablation_residuals.pkl"
if os.path.exists(ablation_residuals_path):
ablation_residuals = AMICIAblationModule.load_object(ablation_residuals_path)
else:
ablation_residuals = model.get_neighbor_ablation_scores(
adata=adata,
compute_z_value=True,
)
ablation_residuals.save_object(ablation_residuals_path)
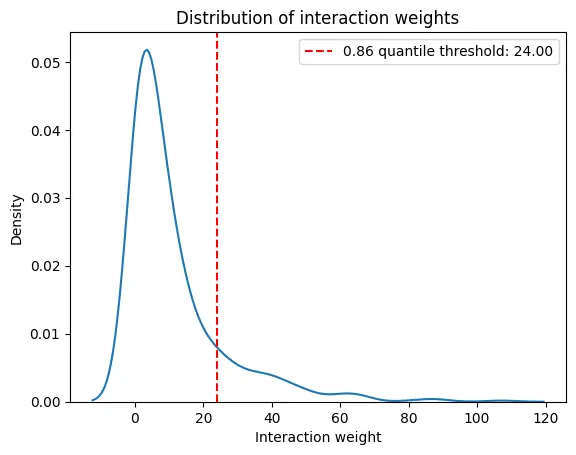
interaction_weight_matrix_df = ablation_residuals._get_interaction_weight_matrix()
interaction_weight_matrix = interaction_weight_matrix_df.values.flatten()
quantile = 0.86
weight_threshold = np.quantile(interaction_weight_matrix, quantile)
print(f"{quantile} quantile threshold: {weight_threshold:.2f}")
sns.kdeplot(
x=interaction_weight_matrix
)
plt.title("Distribution of interaction weights")
plt.xlabel("Interaction weight")
plt.ylabel("Density")
plt.axvline(weight_threshold, color='r', linestyle='--', label=f'{quantile} quantile threshold: {weight_threshold:.2f}')
plt.legend()
plt.show()
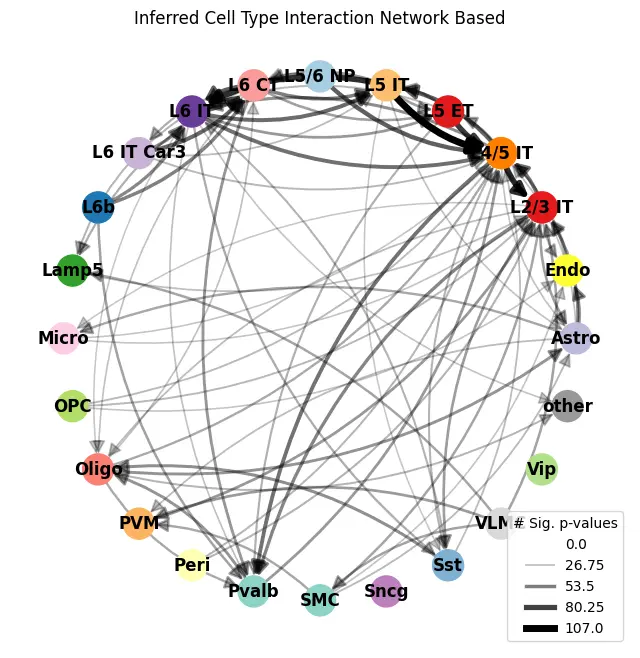
ablation_residuals.plot_interaction_directed_graph(
    significance_threshold=0.05,
    weight_threshold=weight_threshold,
    node_size=500,
    palette=CELL_TYPE_PALETTE,
)
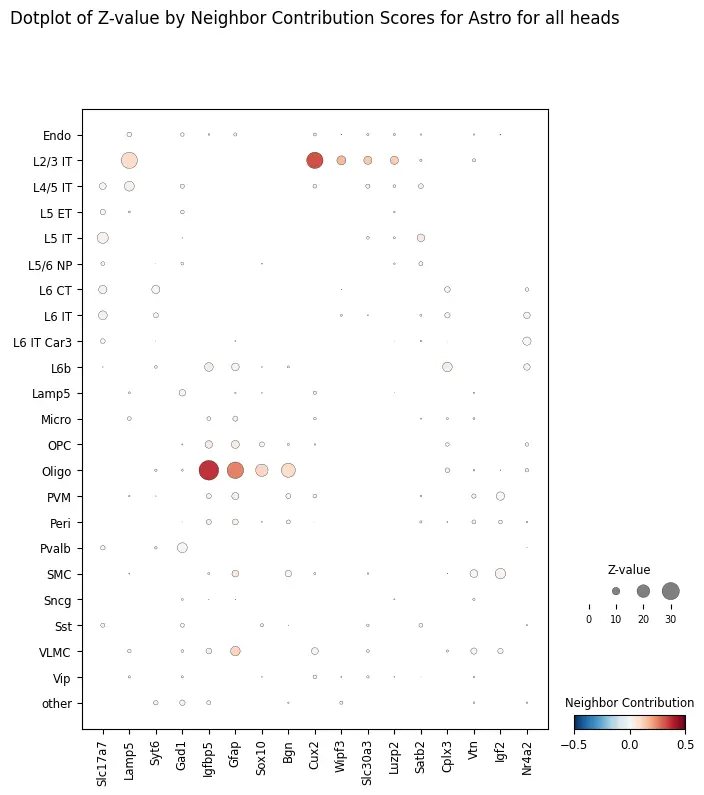
target_ct = "Astro"

ablation_residuals.plot_featurewise_contributions_dotplot(
    cell_type=target_ct,
    color_by="diff",
    size_by="z_value",
    min_size_by=10,
    step=10,
    n_top_genes=5,
)
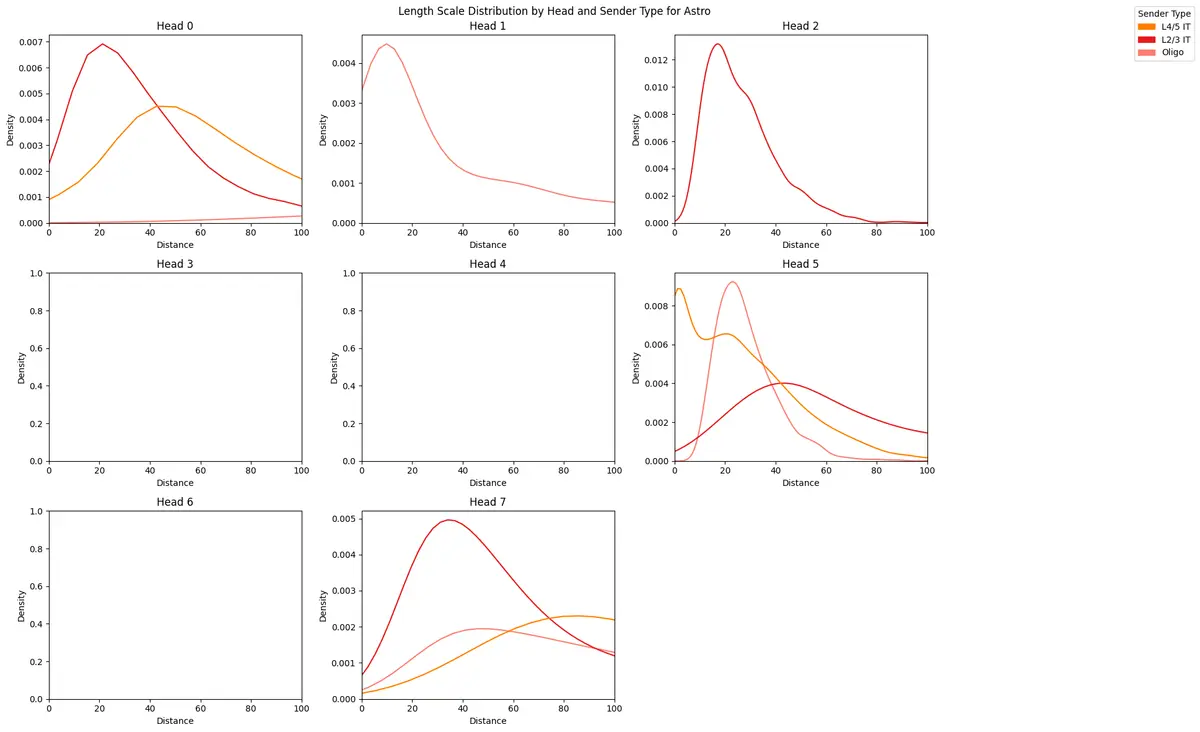
counterfactual_attention_patterns = model.get_counterfactual_attention_patterns(
    cell_type=target_ct,
    adata=adata,
)

sender_types = ["L4/5 IT", "L2/3 IT", "Oligo"]

length_scale_df = counterfactual_attention_patterns.plot_length_scale_distribution(
    head_idxs=range(model.module.n_heads),
    sender_types=sender_types,
    attention_threshold=0.1,
    plot_kde=True,
    sample_threshold=0.02,
    max_length_scale=100,
    palette=CELL_TYPE_PALETTE
)
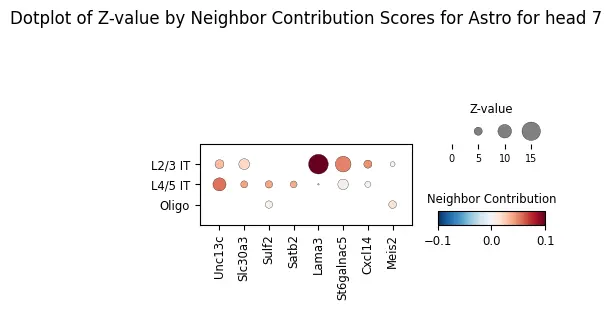
ablation_residuals_sub = model.get_neighbor_ablation_scores(
    adata=adata,
    ablated_neighbor_ct_sub=["L4/5 IT", "L2/3 IT", "Oligo"],
    compute_z_value=True,
    head_idx=7,
)

ablation_residuals_sub.plot_featurewise_contributions_dotplot(
    cell_type=target_ct,
    color_by="diff",
    size_by="z_value",
    min_size_by=2,
    step=5,
    n_top_genes=5,
    vrange=0.1,
)
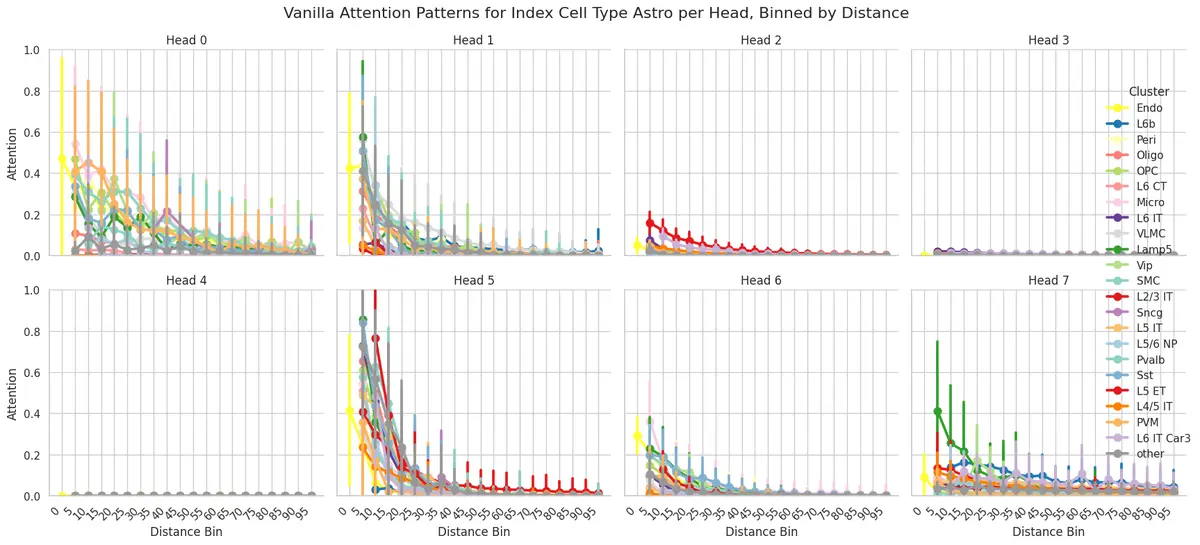
attention_patterns = model.get_attention_patterns(
    adata,
    batch_size=32,
)

attention_patterns.plot_attention_summary(
    cell_type_sub=["Astro"],
    palette=CELL_TYPE_PALETTE,
)
生活很好,有你更好,马年一定马到成功。