1.使用QCharts绘制库
饼状图创建初始化:
cpp
//饼状图初始化
void initChart()
{
ChartDialogcom = new QDialog(this);
ChartDialogcom->setWindowTitle("数据色阶统计图");
ChartDialogcom->setStyleSheet("background-color: rgb(33, 73, 140);font-family: 'Microsoft YaHei';");
ChartDialogcom->setFixedSize(500, 500);
ChartDialogcom->setModal(false);
// 移除问号按钮
ChartDialogcom->setWindowFlags(ChartDialogcom->windowFlags() & ~Qt::WindowContextHelpButtonHint);
//饼状图
pie_series = new QPieSeries(this);
// connect(pie_series, SIGNAL(clicked(QPieSlice*)), this, SLOT(onPieSeriesClicked(QPieSlice*)));
//定义各扇形切片的颜色
// static QList<QColor> list_pie_color = {
// QColor(255, 255, 255),//白色
// QColor(0, 0, 180), // 0.001 → 深蓝
// QColor(2, 6, 255), // 0.2 → 纯蓝
// QColor(3, 255, 2), // 0.4 → 绿色
// QColor(254, 255, 2), // 0.6 → 黄色
// QColor(254, 151, 4), // 0.8 → 橙色
// QColor(255, 70, 2) // 1.0 → 红色
// };
// 预定义的17个热力图颜色(从蓝到红)
static QList<QColor> list_pie_color = {
// 蓝色系:7种渐变(从深蓝到淡蓝)
QColor(255, 255, 255),//白色
QColor(0, 0, 180), // 1. 深蓝色
QColor(0, 30, 210), // 2. 暗蓝色
QColor(0, 60, 235), // 3. 中深蓝
QColor(0, 90, 255), // 4. 纯蓝色
QColor(30, 130, 255), // 5. 亮蓝色
QColor(60, 170, 255), // 6. 天蓝色
QColor(90, 210, 255), // 7. 淡天蓝色
// 绿色系:4种渐变
QColor(0, 220, 200), // 8. 蓝绿色
QColor(0, 230, 150), // 9. 青绿色
QColor(0, 240, 100), // 10. 绿青色
QColor(0, 255, 50), // 11. 亮绿色
// 黄色系:1种
QColor(255, 255, 0), // 12. 纯黄色
// 橙色系:3种渐变
QColor(255, 200, 0), // 13. 橙黄色
QColor(255, 150, 0), // 14. 橙色
QColor(255, 100, 0), // 15. 深橙色
// 红色系:1种
QColor(255, 0, 0) // 16. 纯红色
};
//设置数据
QList<qreal> list_data = {0,0, 0, 0, 0, 0, 0,0, 0, 0, 0, 0, 0, 0, 0, 0,0};
//扇形
for (int i = 0; i < list_pie_color.size(); i++) {
QPieSlice* pie_slice = new QPieSlice(this);
pie_slice->setLabelVisible(true);
pie_slice->setValue(list_data[i]);
pie_slice->setLabel(QString::number(list_data[i]));
pie_slice->setColor(list_pie_color[i]);
pie_slice->setLabelColor(list_pie_color[i]);
pie_slice->setBorderColor(list_pie_color[i]);
pie_series->append(pie_slice);
slices.append(pie_slice);//加入饼状图显示
}
// 统一设置所有扇形的标签字体
QFont sliceFont;
sliceFont.setPointSize(12);
sliceFont.setFamily("Microsoft YaHei"); // 可选:设置字体
sliceFont.setBold(false);
foreach(QPieSlice* slice, slices) {
slice->setLabelFont(sliceFont);
}
//图表视图
/*QChart**/ chart = new QChart;
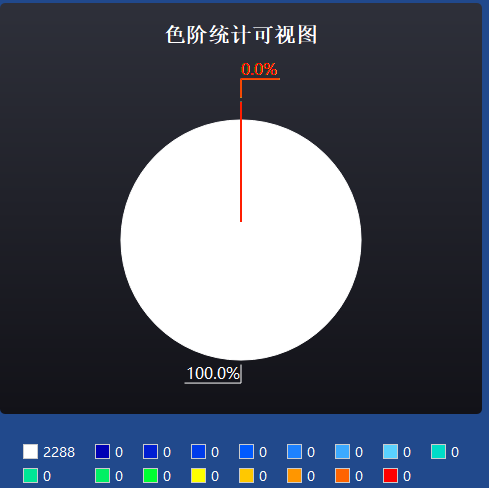
chart->setTitle("色阶统计可视图");
//设置暗黑主题
chart->setTheme(QChart::ChartThemeDark);
//标题字体
QFont font = qApp->font();
font.setBold(true);
font.setPointSize(16);
chart->setTitleFont(font);
//加入饼图
chart->addSeries(pie_series);
chart->setAnimationOptions(QChart::SeriesAnimations);
//图例
// //图例设置(关键:图例会显示QPieSlice的name属性,默认是label)
// chart->legend()->setAlignment(Qt::AlignBottom);
// chart->legend()->setBackgroundVisible(false);
// QFont legendFont = chart->legend()->font();
// legendFont.setPointSize(9);
// legendFont.setFamily("Microsoft YaHei");
// chart->legend()->setFont(legendFont);
// 隐藏默认图例(关键步骤)
chart->legend()->hide();
chart->addSeries(pie_series);
chart->setAnimationOptions(QtCharts::QChart::SeriesAnimations);
//加入绘画视图
/*QChartView* */chartView = new QChartView(this);
chartView->setRenderHint(QPainter::Antialiasing);
chartView->setChart(chart);
// 4. 自定义图例(核心:实现图例显示"序号:数据大小")
// QWidget *legendWidget = new QWidget();
// QHBoxLayout *legendLayout = new QHBoxLayout(legendWidget); // 横向布局,也可以用纵向QVBoxLayout
// legendLayout->setAlignment(Qt::AlignCenter); // 居中对齐
// legendLayout->setSpacing(20); // 每个图例项之间的间距
// // 为每个切片创建图例项(颜色块 + 文本)
// for (int i = 0; i < 17; i++) {
// // 容器:存放颜色块和文本
// QWidget *itemWidget = new QWidget();
// QHBoxLayout *itemLayout = new QHBoxLayout(itemWidget);
// itemLayout->setContentsMargins(0, 0, 0, 0);
// itemLayout->setSpacing(5); // 颜色块和文本的间距
// // 颜色块(显示切片的颜色)
// QLabel *colorLabel = new QLabel();
// colorLabel->setFixedSize(15, 15); // 颜色块大小
// colorLabel->setStyleSheet(QString("background-color: %1; border: 1px solid #ccc;")
// .arg(list_pie_color[i].name()));
// // 图例文本:显示"序号:数据大小"(你想要的内容)
// QLabel *textLabel = new QLabel();
// textLabel->setText(QString("%1").arg(list_data[i]));
// textLabel->setStyleSheet("color: white;"); // 适配暗黑主题,设置白色文本
// textLabel->setFont(QFont("Microsoft YaHei", 10)); // 字体和大小
// Charttextlabel.append(textLabel);
// // 添加到项布局
// itemLayout->addWidget(colorLabel);
// itemLayout->addWidget(textLabel);
// // 添加到图例布局
// legendLayout->addWidget(itemWidget);
// }
QWidget *legendWidget = new QWidget();
legendWidget->setSizePolicy(QSizePolicy::Preferred, QSizePolicy::Fixed);
// 创建网格布局,2列,自动行数
QGridLayout *legendLayout = new QGridLayout(legendWidget);
legendLayout->setHorizontalSpacing(20); // 列间距
legendLayout->setVerticalSpacing(5); // 行间距
for (int i = 0; i < 17; i++) {
// 容器:存放颜色块和文本
QWidget *itemWidget = new QWidget();
QHBoxLayout *itemLayout = new QHBoxLayout(itemWidget);
itemLayout->setContentsMargins(0, 0, 0, 0);
itemLayout->setSpacing(5); // 颜色块和文本的间距
// 颜色块(显示切片的颜色)
QLabel *colorLabel = new QLabel();
colorLabel->setFixedSize(15, 15); // 颜色块大小
colorLabel->setStyleSheet(QString("background-color: %1; border: 1px solid #ccc;")
.arg(list_pie_color[i].name()));
// 图例文本:显示"序号:数据大小"
QLabel *textLabel = new QLabel();
textLabel->setText(QString("%1").arg(list_data[i]));
textLabel->setStyleSheet("color: white;");
textLabel->setFont(QFont("Microsoft YaHei", 10));
Charttextlabel.append(textLabel);
// 添加到项布局
itemLayout->addWidget(colorLabel);
itemLayout->addWidget(textLabel);
// 计算行和列的位置
int row = i / 9; // 每2个换一行
int column = i % 9; // 0表示第一列,1表示第二列
// 添加到网格布局
legendLayout->addWidget(itemWidget, row, column);
}
// 5. 整体布局:图表在上,自定义图例在下
QWidget *centralWidget = new QWidget();
QVBoxLayout *mainLayout = new QVBoxLayout(centralWidget);
mainLayout->setContentsMargins(0, 0, 0, 0);
mainLayout->setSpacing(10); // 图表和图例的间距
mainLayout->addWidget(chartView);
// mainLayout->addWidget(legendWidget, 0, Qt::AlignCenter); // 图例居中
// 创建图例容器包装,确保更好的居中效果
QWidget *legendContainer = new QWidget();
QVBoxLayout *containerLayout = new QVBoxLayout(legendContainer);
containerLayout->setContentsMargins(0, 0, 0, 0);
containerLayout->addWidget(legendWidget, 0, Qt::AlignCenter);
// 添加图例容器到主布局
mainLayout->addWidget(legendContainer);
// //加入布局
// QVBoxLayout* layout = new QVBoxLayout;
// layout->setContentsMargins(0, 0, 0, 0);
// layout->addWidget(chartView);
ChartDialogcom->setLayout(mainLayout);
connect(pie_series, &QPieSeries::hovered, [](QPieSlice *slice, bool state) {
static QPieSlice* lastHovered = nullptr;
if (state && slice) {
if (lastHovered) {
lastHovered->setExploded(false);
}
slice->setExploded(true);
lastHovered = slice;
} else if (!state && lastHovered) {
lastHovered->setExploded(false);
lastHovered = nullptr;
}
});
}
cpp
    //饼状图
    QPieSeries *pie_series;
    void initChart();
    QDialog *ChartDialogcom;
    QChart* chart;
    QChartView* chartView;
    QList<QPieSlice*> slices;
    QList<QLabel*> Charttextlabel;
    QTimer* ChartdataTimer;
使用定时器实时刷新数据更新饼状图:
cpp
void onChartdataTimeout()
{
    QCPColorMap *colorMap = static_cast<QCPColorMap*>(ui->widget->plottable(0));
    if (!colorMap) return;
    // 获取热力图数据
    int nx = colorMap->data()->keySize();
    int ny = colorMap->data()->valueSize();
    // 收集所有数据点
    QVector<double> allData;
    allData.reserve(nx * ny);

    for (int x = 0; x < nx; ++x) {
        for (int y = 0; y < ny; ++y) {
            double value = colorMap->data()->cell(x, y);
            allData.append(value);
        }
    }
    int colorValue=maxcolorevalue/16;//获取颜色最小值到最大值的每份区间
    int NumberIntervals[17]={0};//存储数据区间个数
    int totalNumber=current_x_num*current_y_num;
    for(int i=0;i<totalNumber;i++)
    {
        if(allData.at(i)<1)
        {
            NumberIntervals[0]++;
        }else if(allData.at(i)<colorValue)
        {
            NumberIntervals[1]++;
        }else if(allData.at(i)<2*colorValue)
        {
            NumberIntervals[2]++;
        }else if(allData.at(i)<3*colorValue)
        {
            NumberIntervals[3]++;
        }else if(allData.at(i)<4*colorValue)
        {
            NumberIntervals[4]++;
        }else if(allData.at(i)<5*colorValue)
        {
            NumberIntervals[5]++;
        }else
        {
            NumberIntervals[6]++;
        }

    }

    //更新每个扇形的分布大小
    for (int i = 0; i < 17; i++) {
        slices.at(i)->setLabelVisible(true);
        slices.at(i)->setValue(NumberIntervals[i]);
        // slices.at(i)->setLabel(QString::number(NumberIntervals[i]/totalNumber*100)+"%");
        // 正确计算百分比:先转为浮点数,再计算
        double percentage = (static_cast<double>(NumberIntervals[i]) / totalNumber) * 100.0;

        // 设置标签:同时显示数量和百分比
        QString labelText = QString("%1%")
                                .arg(percentage, 0, 'f', 1);

        slices.at(i)->setLabel(labelText);

        Charttextlabel.at(i)->setText(QString::number(NumberIntervals[i]));
    }


}
实现效果图