前序教程请参照专栏,如您是从0开始阅读,可以直接跳到Python运动规划库教程(Python Motion Planning)-0-简介与安装。
定义起点和终点。本库直接用元组表示坐标点。在栅格地图坐标系里,元组中的数值都是整数。如果是世界坐标系则是浮点数。
python
start = (5, 5)
goal = (45, 25)
将起点和终点添加到栅格地图中。这个是为了方便起点和终点的可视化,同时可以清除对应点的障碍物防止规划失败。
python
map_.type_map[start] = TYPES.START
map_.type_map[goal] = TYPES.GOAL
创建路径规划器并规划路径。这里以A*算法为例。规划函数返回地图坐标系路径和详细规划信息(包括成功与否、路径长度、路径代价、扩展结点等)。
python
planner = AStar(map_=map_, start=start, goal=goal)
path, path_info = planner.plan()
print(path)
print(path_info)
map_.fill_expands(path_info["expand"])  # 这句代码是为了后续可视化扩展结点
打印规划结果:
[(5, 5), (5, 6), (5, 7), (5, 8), (5, 9), (5, 10), (5, 11), (5, 12), (6, 13), (6, 14), (6, 15), (7, 16), (7, 17), (8, 18), (9, 18), (10, 19), (11, 19), (12, 19), (13, 19), (14, 19), (15, 19), (16, 19), (17, 19), (18, 19), (19, 19), (20, 19), (21, 19), (22, 18), (23, 17), (24, 16), (25, 15), (26, 14), (27, 13), (28, 12), (29, 11), (30, 11), (31, 12), (32, 12), (33, 13), (34, 14), (35, 15), (36, 16), (37, 17), (38, 18), (39, 19), (40, 20), (41, 21), (42, 22), (43, 23), (44, 24), (45, 25)]
{'success': True, 'start': (5, 5), 'goal': (45, 25), 'length': 60.76955262170047, 'cost': 60.76955262170047, 'expand': {(5, 5): Node((5, 5), None, 0, 44.721359549995796), ...}}
可视化。
python
vis = Visualizer("Path Visualizer")
vis.plot_grid_map(map_)
vis.plot_path(path, style="--", color="C4")
vis.show()
vis.close()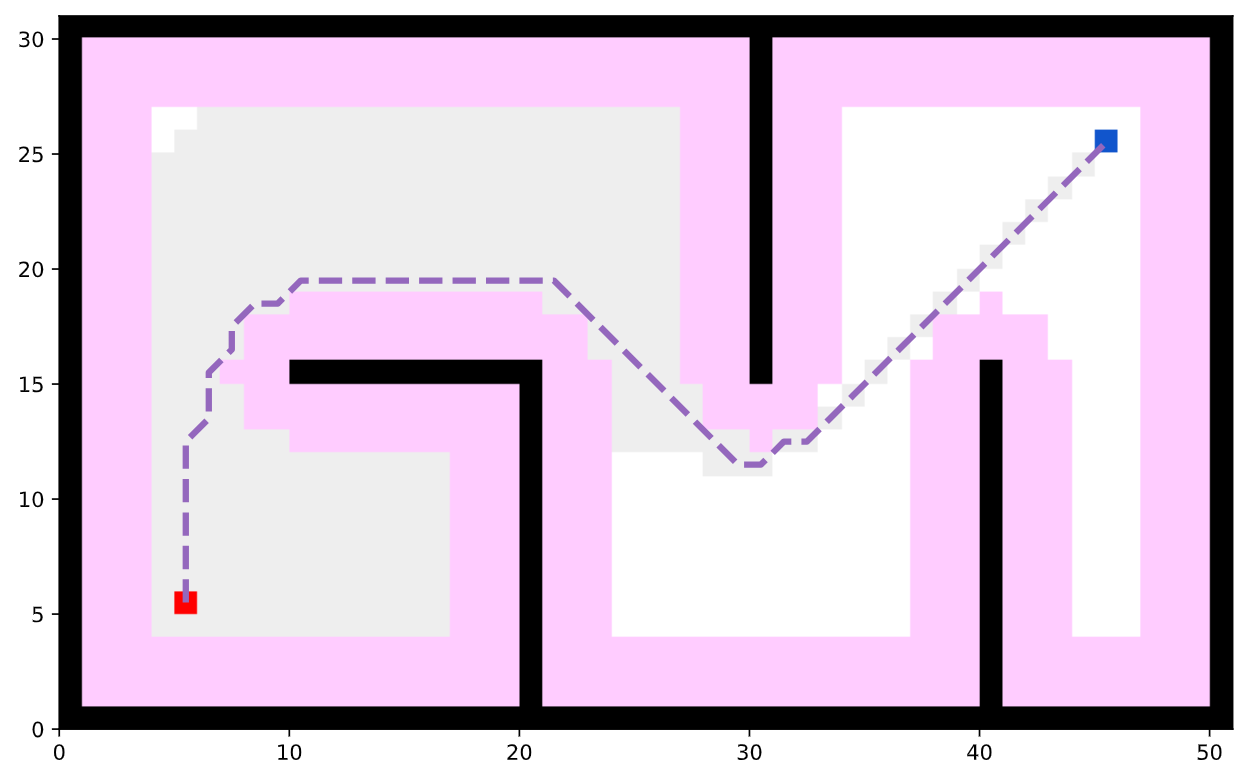
完整的可运行代码:
python
import random
random.seed(0)

import numpy as np
np.random.seed(0)

from python_motion_planning.common import *
from python_motion_planning.path_planner import *
from python_motion_planning.controller import *

map_ = Grid(bounds=[[0, 51], [0, 31]])

map_.fill_boundary_with_obstacles()
map_.type_map[10:21, 15] = TYPES.OBSTACLE
map_.type_map[20, :15] = TYPES.OBSTACLE
map_.type_map[30, 15:] = TYPES.OBSTACLE
map_.type_map[40, :16] = TYPES.OBSTACLE

map_.inflate_obstacles(radius=3)

start = (5, 5)
goal = (45, 25)

map_.type_map[start] = TYPES.START
map_.type_map[goal] = TYPES.GOAL

planner = AStar(map_=map_, start=start, goal=goal)
path, path_info = planner.plan()
print(path)
print(path_info)
map_.fill_expands(path_info["expand"])  # 这句代码是为了后续可视化扩展结点

vis = Visualizer2D()
vis.plot_grid_map(map_)
vis.plot_path(path, style="--", color="C4")
vis.show()
vis.close()
如需了解更多图搜索规划器及其参数,请参阅官方教程文档中的API Reference部分。