不想刷第三方的固件,但是又想要温度监控,正好试试AI编程,于是有了这篇文章。
方案如下:AX86u按频率上报温度信息给服务器后端,服务端后端负责接收处理数据,和前端展示。服务器后端程序用Python编写,跑在NAS的docker中。
AX86u脚本上报
AX86u官方固件中的curl,wget两个命令都不能访问内网服务,外网可以。这里用的是nc命令。
- 温度上报
bash
#!/bin/sh

# 配置区
# 目标地址已修改为192.168.50.244
TARGET_HOST="192.168.50.244"
TARGET_PORT="50000"
API_PATH="/receive_temp"
CPU_TEMP_FILE="/sys/class/thermal/thermal_zone0/temp"

# 1. CPU温度获取(完全保留原始代码)
CPU_TEMP_RAW=$(cat "$CPU_TEMP_FILE" 2>/dev/null)
CPU_TEMP_C=$(echo "$CPU_TEMP_RAW" | awk '{printf "%.1f", $1/1000}')

# 2. 2.4G WiFi温度获取(完全保留原始代码)
WIFI2G_RAW=$(wl -i $(nvram get wl0_ifname) phy_tempsense 2>/dev/null)
WIFI2G_TEMP_C=$(echo "$WIFI2G_RAW" | awk '{printf "%.1f", $1/2+20}')

# 3. 5G WiFi温度获取(完全保留原始代码)
WIFI5G_RAW=$(wl -i $(nvram get wl1_ifname) phy_tempsense 2>/dev/null)
WIFI5G_TEMP_C=$(echo "$WIFI5G_RAW" | awk '{printf "%.1f", $1/2+20}')

# 4. 生成时间戳+JSON(完全保留原始代码)
TIMESTAMP=$(date "+%s")
JSON_DATA=$(printf '{"timestamp":"%s","cpu_temp":"%s","wifi2g_temp":"%s","wifi5g_temp":"%s"}' \
    "$TIMESTAMP" "$CPU_TEMP_C" "$WIFI2G_TEMP_C" "$WIFI5G_TEMP_C")

# 5. 上报+结果提示(移除输出重定向,直接终端显示)
echo "待上报数据:$JSON_DATA"

# 构造完整的HTTP POST请求
CONTENT_LENGTH=${#JSON_DATA}
HTTP_REQUEST=$(cat <<EOF
POST $API_PATH HTTP/1.1
Host: $TARGET_HOST:$TARGET_PORT
Content-Type: application/json
Content-Length: $CONTENT_LENGTH

$JSON_DATA
EOF
)

# nc指令上报数据
echo "$HTTP_REQUEST" | nc "$TARGET_HOST" "$TARGET_PORT"

# 保留原始结果提示逻辑
if [ $? -eq 0 ]; then
    echo "上报成功"
else
    echo "上报失败(请检查接口)"
fi- 任务调度
bash
#!/bin/sh

# 步骤1:提示用户输入执行间隔(分钟)
echo "======================================"
echo "开始管理定时任务"
echo "======================================"
echo "请输入脚本执行间隔(单位:分钟,建议输入10、30等正整数):"
read INTERVAL

# 验证用户输入是否为有效正整数
if ! echo "$INTERVAL" | grep -q "^[1-9][0-9]*$"; then
    echo "输入错误!请输入大于0的正整数,脚本退出。"
    exit 1
fi

# 配置项:修改为你的实际脚本路径(必须是绝对路径)
SCRIPT_PATH="/jffs/scripts/tempReport.sh"
TASK_NAME="push_temp"

# 步骤2:删除旧的同名定时任务(若存在)
echo ""
echo "[步骤1:删除旧任务(若存在)]"
cru d $TASK_NAME

# 验证删除结果(通过查看任务列表判断)
if ! cru l | grep -q "$TASK_NAME"; then
    echo "旧任务已成功删除(或原本无同名任务)"
else
    echo "旧任务删除失败,将强制继续添加新任务"
fi

# 步骤3:验证目标推送脚本是否存在
echo ""
echo "[步骤2:验证推送脚本可用性]"
if [ -f "$SCRIPT_PATH" ]; then
    echo "推送脚本存在:$SCRIPT_PATH"
else
    echo "推送脚本不存在:$SCRIPT_PATH,请检查路径是否正确"
    exit 1
fi

# 步骤4:给推送脚本赋予执行权限(确保可运行)
if [ ! -x "$SCRIPT_PATH" ]; then
    echo "推送脚本缺少执行权限,正在添加..."
    chmod +x "$SCRIPT_PATH"
    if [ -x "$SCRIPT_PATH" ]; then
        echo "推送脚本执行权限添加成功"
    else
        echo "推送脚本执行权限添加失败,无法继续配置定时任务"
        exit 1
    fi
else
    echo "推送脚本已拥有执行权限"
fi

# 步骤5:添加新的自定义间隔调度定时任务(cru add改为cru a,移除日志输出)
echo ""
echo "[步骤3:添加新的自定义间隔调度任务]"
cru a $TASK_NAME "*/$INTERVAL * * * * /bin/sh $SCRIPT_PATH"

# 步骤6:验证新任务是否添加成功
echo ""
echo "[步骤4:验证新任务配置结果]"
if cru l | grep -q "$TASK_NAME"; then
    echo "新任务已成功添加!"
    echo ""
    echo "任务详情:"
    cru l | grep "$TASK_NAME"
    echo ""
    echo "后续可执行 'cru l' 查看任务列表"
else
    echo "新任务添加失败,请检查命令格式或固件是否支持cru命令"
fi

echo ""
echo "======================================"
echo "定时任务配置流程结束"
echo "======================================"
路径放在/jffs/scripts下面,只需要执行一次任务调度脚本即可。
服务端
python
from flask import Flask, request, render_template_string
from flask_sqlalchemy import SQLAlchemy
import datetime
import io
import base64
import matplotlib
matplotlib.use('Agg')
import matplotlib.pyplot as plt
from matplotlib.dates import DateFormatter, HourLocator
app = Flask(__name__)
# 配置SQLite数据库
app.config['SQLALCHEMY_DATABASE_URI'] = 'sqlite:////db/temp_data.db'
app.config['SQLALCHEMY_TRACK_MODIFICATIONS'] = False
db = SQLAlchemy(app)
# 定义数据库模型
class TempRecord(db.Model):
id = db.Column(db.Integer, primary_key=True)
timestamp = db.Column(db.String(30), nullable=False) # 存储格式化后的时间字符串
cpu_temp = db.Column(db.Float, nullable=False)
wifi2g_temp = db.Column(db.Float, nullable=False)
wifi5g_temp = db.Column(db.Float, nullable=False)
# 初始化数据库
with app.app_context():
db.create_all()
# 接收路由器推送数据的接口
@app.route('/receive_temp', methods=['POST'])
def receive_temp():
try:
data = request.get_json()
# 直接使用设备上报的时间并格式化为YYYY-MM-DD HH:MM:SS
record = TempRecord(
timestamp=datetime.datetime.fromtimestamp(float(data['timestamp'])).strftime('%Y-%m-%d %H:%M:%S'),
cpu_temp=float(data['cpu_temp']),
wifi2g_temp=float(data['wifi2g_temp']),
wifi5g_temp=float(data['wifi5g_temp'])
)
db.session.add(record)
db.session.commit()
return "Data saved to DB successfully", 200
except Exception as e:
return f"Error: {str(e)}", 500
# 删除数据接口
@app.route('/delete_data', methods=['POST'])
def delete_data():
try:
data = request.get_json()
if data.get('delete_all'):
TempRecord.query.delete()
else:
start_time = data.get('start_time')
end_time = data.get('end_time')
if start_time and end_time:
TempRecord.query.filter(
TempRecord.timestamp >= start_time,
TempRecord.timestamp <= end_time
).delete()
db.session.commit()
return "Data deleted successfully", 200
except Exception as e:
return f"Error: {str(e)}", 500
# Web可视化页面
@app.route('/')
def index():
# 获取时间范围参数
time_range = request.args.get('range', '1d')
start_time = request.args.get('start_time')
end_time = request.args.get('end_time')
# 计算时间范围
now = datetime.datetime.now()
if time_range == '1d':
delta = datetime.timedelta(days=1)
elif time_range == '3d':
delta = datetime.timedelta(days=3)
elif time_range == '5d':
delta = datetime.timedelta(days=5)
elif time_range == '1w':
delta = datetime.timedelta(weeks=1)
else:
delta = datetime.timedelta(days=1)
# 计算起始时间
start_dt = now - delta
start_str = start_dt.strftime('%Y-%m-%d %H:%M:%S')
# 根据参数筛选数据
if start_time and end_time:
records = TempRecord.query.filter(
TempRecord.timestamp >= start_time,
TempRecord.timestamp <= end_time
).order_by(TempRecord.id.desc()).all()
else:
records = TempRecord.query.filter(
TempRecord.timestamp >= start_str
).order_by(TempRecord.id.desc()).all()
# 获取最近一条数据用于单独展示
latest_record = TempRecord.query.order_by(TempRecord.id.desc()).first()
# 准备图表数据
img_base64 = ""
if records:
# 反转数据,让图表按时间正序显示
records.reverse()
# 关键修改1:将字符串格式的timestamp转换为datetime对象(适配matplotlib时间刻度)
timestamps_str = [r.timestamp for r in records]
timestamps_dt = [datetime.datetime.strptime(ts, '%Y-%m-%d %H:%M:%S') for ts in timestamps_str]
# 提取温度数据(保持原有逻辑不变)
cpu_temps = [r.cpu_temp for r in records]
wifi2g_temps = [r.wifi2g_temp for r in records]
wifi5g_temps = [r.wifi5g_temp for r in records]
# 生成温度折线图
plt.figure(figsize=(12, 6))
# 关键修改2:使用转换后的datetime对象绘图
plt.plot(timestamps_dt, cpu_temps, label='CPU Temp (°C)', marker='o', markersize=4)
plt.plot(timestamps_dt, wifi2g_temps, label='2.4G WiFi Temp (°C)', marker='^', markersize=4)
plt.plot(timestamps_dt, wifi5g_temps, label='5G WiFi Temp (°C)', marker='*', markersize=4)
# 关键修改3:配置X轴,按每小时显示一个标签
ax = plt.gca() # 获取当前坐标轴对象
ax.xaxis.set_major_locator(HourLocator(interval=1)) # 每1小时显示一个主刻度
ax.xaxis.set_major_formatter(DateFormatter('%Y-%m-%d %H:%M')) # 时间格式:年-月-日 时:分
ax.spines['top'].set_visible(False) # 隐藏上部边框
ax.spines['right'].set_visible(False) # 隐藏右侧边框
# 原有标签与样式(保留不变,优化旋转对齐)
plt.xlabel(' ')
plt.ylabel('Temperature (°C)')
plt.title('AX86u Temperature History')
plt.legend()
plt.xticks(rotation=45, ha='right') # ha='right'让旋转后的标签更贴近刻度线
plt.tight_layout()
# 将图表转为base64编码(保持原有逻辑不变)
img_buffer = io.BytesIO()
plt.savefig(img_buffer, format='png', dpi=100, bbox_inches='tight')
img_buffer.seek(0)
img_base64 = base64.b64encode(img_buffer.getvalue()).decode()
plt.close()
# 渲染HTML页面(保持原有逻辑不变)
html_template = '''
<!DOCTYPE html>
<html>
<head>
<title>AX86u Temperature Monitor</title>
<meta name="viewport" content="width=device-width, initial-scale=1.0">
<style>
* { box-sizing: border-box; margin: 0; padding: 0; font-family: "Segoe UI", "Roboto", "Arial", sans-serif; }
body { margin: 0 auto; padding: 20px 10px; background-color: #f0f4f8; max-width: 1000px; }
.container { background: #ffffff; border-radius: 18px; padding: 24px 16px; box-shadow: 0 3px 25px rgba(0, 0, 0, 0.05); margin-bottom: 20px; width: 100%; max-width: 1200px; }
h1 { color: #111827; margin-bottom: 32px; text-align: center; font-size: 30px; font-weight: 700; letter-spacing: 0.5px; }
h2 { color: #374151; margin-bottom: 20px; text-align: center; font-size: 22px; font-weight: 600; }
.section-card { margin: 30px 0; padding: 16px; background-color: #f9fafb; border-radius: 10px; border: 1px solid #e5e7eb; }
.controls { display: flex; flex-wrap: wrap; gap: 16px; justify-content: center; align-items: center; margin-bottom: 30px; }
.controls > * { padding: 10px 12px; border: 1px solid #e5e7eb; border-radius: 10px; font-size: 15px; flex: 1; min-width: 180px; background-color: #ffffff; transition: all 0.2s ease; }
.controls button { background-color: #2563eb; color: #ffffff; cursor: pointer; border: 1px solid #2563eb; border-radius: 10px; font-weight: 500; }
.controls button:hover { background-color: #1d4ed8; border-color: #1e40af; box-shadow: 0 4px 12px rgba(37, 99, 235, 0.2); }
.data-management-card { margin: 30px 0; padding: 16px; background-color: #f9fafb; border-radius: 10px; border: 1px solid #e5e7eb; }
.toggle-delete-section { width: 100%; padding: 10px; background-color: #f8fafc; color: #1f2937; border: 1px solid #e5e7eb; border-radius: 10px; font-size: 16px; cursor: pointer; transition: all 0.3s ease; text-align: center; font-weight: 500; margin-bottom: 16px; }
.toggle-delete-section:hover { background-color: #e2e8f0; border-color: #cbd5e1; box-shadow: 0 4px 12px rgba(0, 0, 0, 0.05); }
.delete-section { display: none; padding: 16px; background-color: #fffafb; border-radius: 10px; border: 1px solid #fecdd3; box-shadow: 0 2px 10px rgba(0, 0, 0, 0.03); }
.data-item { display: flex; justify-content: space-between; align-items: center; margin: 12px 0; font-size: 16px; padding: 8px 0; width: 100%; border-bottom: 1px solid #f3f4f6; }
.data-item:last-child { border-bottom: none; }
.data-label { font-weight: 600; text-align: left; color: #1f2937; flex-shrink: 0; }
.data-value { text-align: right; color: #4b5563; flex-shrink: 0; }
.chart-container { width: 100%; margin: 0 auto; padding: 0; min-height: auto !important; height: auto !important; display: block; }
img { max-width: 100%; width: 100%; height: auto; border-radius: 10px; box-shadow: 0 6px 20px rgba(0, 0, 0, 0.1); display: block; margin: 0 auto; }
.no-chart-tip { text-align: center; color: #6b7280; padding: 10px 0; margin: 0; font-size: 16px; }
input[type="datetime-local"] { -webkit-appearance: none; -moz-appearance: none; appearance: none; min-width: 0; box-sizing: border-box; background-color: #ffffff; }
input:focus, select:focus { outline: none; border-color: #2563eb; box-shadow: 0 0 0 3px rgba(37, 99, 235, 0.1); }
table { width: 100%; border-collapse: collapse; margin-top: 30px; border-radius: 10px; overflow: hidden; box-shadow: 0 3px 15px rgba(0, 0, 0, 0.05); }
th, td { padding: 12px 16px; text-align: left; border-bottom: 1px solid #e5e7eb; }
th { background-color: #2563eb; color: #ffffff; font-weight: 500; }
tr:hover { background-color: #f9fafb; transition: background-color 0.2s ease; }
@media (max-width: 768px) {
.container { padding: 16px 12px; max-width: 100%; }
.controls { flex-direction: column; align-items: stretch; }
.controls > * { min-width: unset; width: 100%; }
h1 { font-size: 26px; }
h2 { font-size: 20px; }
.data-item { font-size: 15px; }
.chart-container { padding: 0; width: 100%; min-height: auto !important; }
.no-chart-tip { font-size: 15px; }
}
</style>
</head>
<body>
<div class="container">
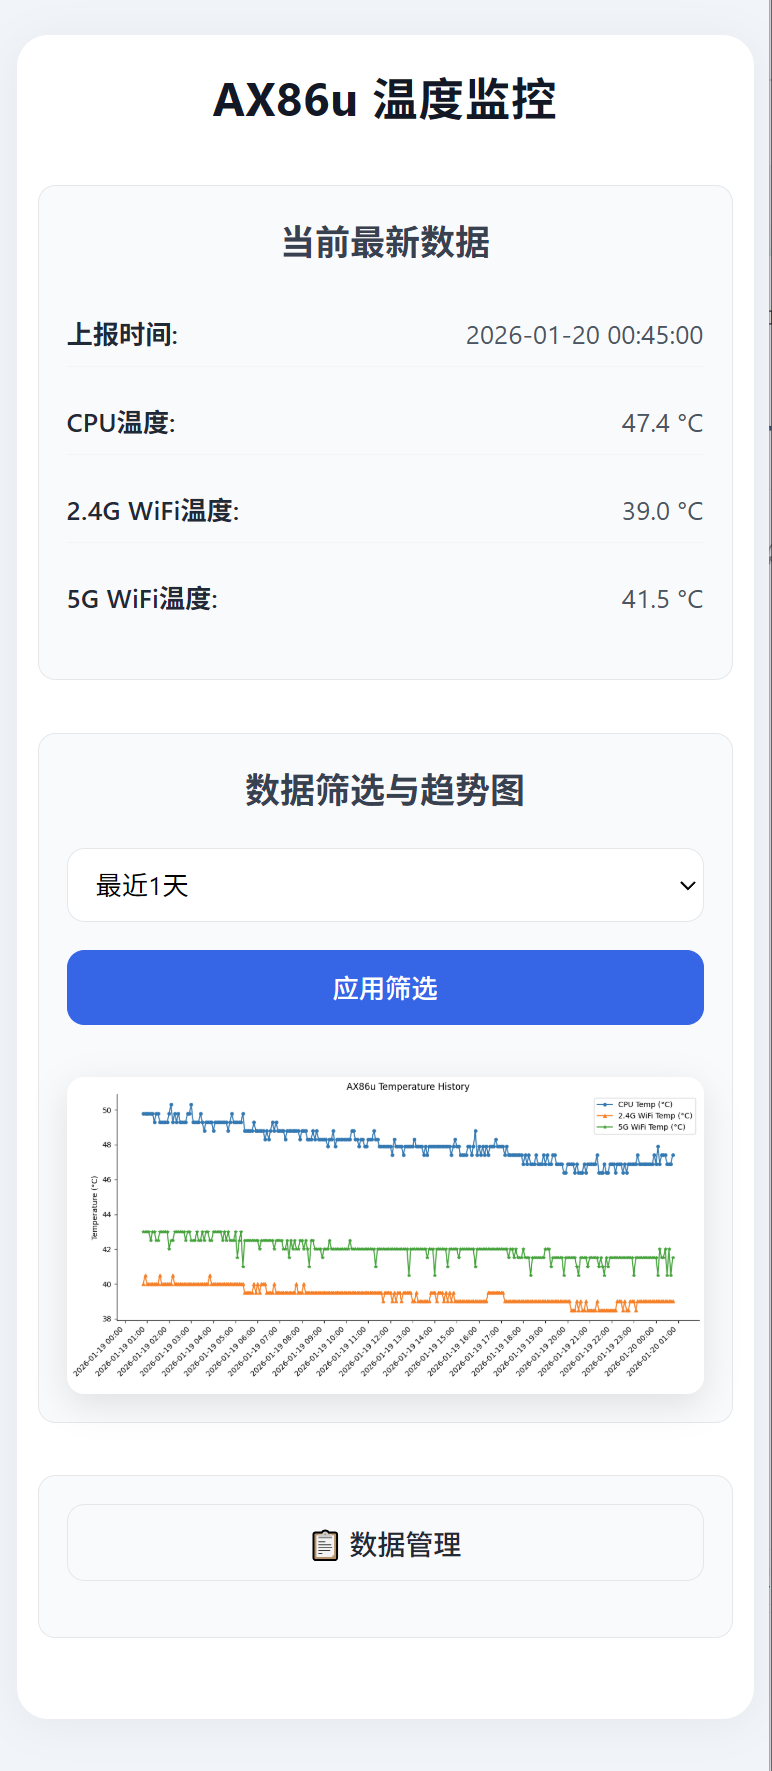
<h1>AX86u 温度监控</h1>
<div class="section-card">
<h2>当前最新数据</h2>
{% if latest_record %}
<div class="data-item"><span class="data-label">上报时间:</span><span class="data-value">{{ latest_record.timestamp }}</span></div>
<div class="data-item"><span class="data-label">CPU温度:</span><span class="data-value">{{ latest_record.cpu_temp }} °C</span></div>
<div class="data-item"><span class="data-label">2.4G WiFi温度:</span><span class="data-value">{{ latest_record.wifi2g_temp }} °C</span></div>
<div class="data-item"><span class="data-label">5G WiFi温度:</span><span class="data-value">{{ latest_record.wifi5g_temp }} °C</span></div>
{% else %}
<p class="no-chart-tip">暂无数据</p>
{% endif %}
</div>
<div class="section-card">
<h2>数据筛选与趋势图</h2>
<div class="controls">
<select id="timeRange">
<option value="1d" {% if time_range == '1d' %}selected{% endif %}>最近1天</option>
<option value="3d" {% if time_range == '3d' %}selected{% endif %}>最近3天</option>
<option value="5d" {% if time_range == '5d' %}selected{% endif %}>最近5天</option>
<option value="1w" {% if time_range == '1w' %}selected{% endif %}>最近1周</option>
<option value="custom">自定义时间</option>
</select>
<input type="datetime-local" id="startTime" value="{{ start_time }}" style="display: none;">
<input type="datetime-local" id="endTime" value="{{ end_time }}" style="display: none;">
<button onclick="applyFilter()">应用筛选</button>
</div>
<div class="chart-container">
{% if img_base64 %}
<img src="data:image/png;base64,{{ img_base64 }}" alt="Temperature Chart">
{% else %}
<p class="no-chart-tip">暂无图表数据</p>
{% endif %}
</div>
</div>
<div class="data-management-card">
<button class="toggle-delete-section" onclick="toggleDeleteSection()">📋 数据管理</button>
<div class="delete-section" id="deleteSection">
<h2>数据管理</h2>
<div class="controls">
<button onclick="deleteAllData()">删除所有数据</button>
<input type="datetime-local" id="delStartTime">
<input type="datetime-local" id="delEndTime">
<button onclick="deleteRangeData()">删除指定时间段数据</button>
</div>
</div>
</div>
</div>
<script>
const timeRangeEl = document.getElementById('timeRange'), startTimeEl = document.getElementById('startTime'), endTimeEl = document.getElementById('endTime'), deleteSectionEl = document.getElementById('deleteSection'), toggleDeleteBtnEl = document.querySelector('.toggle-delete-section');
timeRangeEl.addEventListener('change', function() {
const isCustom = this.value === 'custom';
startTimeEl.style.display = isCustom ? 'block' : 'none';
endTimeEl.style.display = isCustom ? 'block' : 'none';
});
function applyFilter() {
const range = timeRangeEl.value;
let url = `/?range=${range}`;
if (range === 'custom') {
const start = startTimeEl.value, end = endTimeEl.value;
if (start && end) {
const startStr = start.replace('T', ' ') + ':00', endStr = end.replace('T', ' ') + ':00';
url += `&start_time=${encodeURIComponent(startStr)}&end_time=${encodeURIComponent(endStr)}`;
}
}
window.location.href = url;
}
function resetBtnState(btn) { btn.disabled = false; btn.style.backgroundColor = "#2563eb"; }
function deleteAllData() {
const btn = event.currentTarget;
btn.disabled = true;
btn.style.backgroundColor = "#6b7280";
if (confirm('确定要删除所有数据吗?此操作不可恢复!')) {
fetch('/delete_data', {
method: 'POST',
headers: { 'Content-Type': 'application/json' },
body: JSON.stringify({ delete_all: true })
}).then(response => {
if (response.ok) { alert('所有数据已删除'); window.location.reload(); }
else { resetBtnState(btn); }
}).catch(error => { resetBtnState(btn); console.error('Delete error:', error); });
} else { resetBtnState(btn); }
}
function deleteRangeData() {
const btn = event.currentTarget;
btn.disabled = true;
btn.style.backgroundColor = "#6b7280";
const start = document.getElementById('delStartTime').value, end = document.getElementById('delEndTime').value;
if (!start || !end) { alert('请选择完整的时间范围!'); resetBtnState(btn); return; }
if (confirm('确定要删除该时间段的数据吗?此操作不可恢复!')) {
const startStr = start.replace('T', ' ') + ':00', endStr = end.replace('T', ' ') + ':00';
fetch('/delete_data', {
method: 'POST',
headers: { 'Content-Type': 'application/json' },
body: JSON.stringify({ start_time: startStr, end_time: endStr, delete_all: false })
}).then(response => {
if (response.ok) { alert('指定时间段数据已删除'); window.location.reload(); }
else { resetBtnState(btn); }
}).catch(error => { resetBtnState(btn); console.error('Delete error:', error); });
} else { resetBtnState(btn); }
}
window.onload = function() { if (timeRangeEl.value === 'custom') { startTimeEl.style.display = 'block'; endTimeEl.style.display = 'block'; } };
function toggleDeleteSection() {
const isHidden = deleteSectionEl.style.display === 'none' || deleteSectionEl.style.display === '';
deleteSectionEl.style.display = isHidden ? 'block' : 'none';
toggleDeleteBtnEl.textContent = isHidden ? '📋 收起数据管理' : '📋 数据管理';
}
</script>
</body>
</html>
'''
return render_template_string(
html_template,
img_base64=img_base64,
latest_record=latest_record,
time_range=time_range,
start_time=start_time,
end_time=end_time
)
if __name__ == '__main__':
app.run(host='0.0.0.0', port=5000, debug=False)docker配置文件
docker-compose.yml
python
version: '3'
services:
  temp-monitor:
    # 使用第三方Python镜像,官方无法访问
    image: docker.1ms.run/library/python:3.11-slim
    container_name: ax86u-temp-monitor
    restart: always
    ports:
      # 宿主机端口:容器端口 → 可自定义宿主机端口,如8081:5000
      - "50000:5000"
    volumes:
      # 挂载代码目录到容器内
      - ./app:/app
      # 挂载数据库目录到容器内,实现数据持久化
      - ./db:/db
    working_dir: /app
    command: >
      sh -c "pip install --no-cache-dir -r requirements.txt && python app.py"
    environment:
      - TZ=Asia/Shanghai
requirements.txt
python
flask==3.0.0
flask-sqlalchemy==3.1.1
matplotlib==3.8.2
python-dateutil==2.8.2
其它
python
#################### docker 文件件结构 ###################
temp_monitor
    /app
        --app.py
        --requirements.txt
    /db
--docker-compose.yml

#################### 运行docker ##########################
# 建立
sudo docker-compose up -d
# 停止并清理
sudo docker-compose down
# 查看容器实时日志
sudo docker-compose logs -f
# 停止
sudo docker-compose stop
# 开始
sudo docker-compose start

##########################################################
总结:
-
全程问的豆包,有些智能,有些傻,提问很重要。
-
curl和wget一直不能访问内网,研究了很久,豆包也没给出什么好的方法,偶然发现nc能行。
-
体验了一天,索然无味,浪费资源。